SDSS White Dwarf mass distribution at low effective temperatures
Abstract
The DA white dwarfs in the Sloan Digital Sky Survey, as analyzed in the papers for Data Releases 1 and 4, show an increase in surface gravity towards lower effective temperatures below 11500 K. We study the various possible explanations of this effect, from a real increase of the masses to uncertainties or deficiencies of the atmospheric models. No definite answer is found but the tentative conclusion is that it is most likely the current description of convection in the framework of the mixing-length approximation, which leads to this effect.
1 Introduction
Almost every contribution at this white dwarf meeting mentions the Sloan Digital Sky Survey (SDSS) or is even based on its data. Because of the huge impact the survey has on this field, it is very important to critically analyze all aspects of the data collection and reduction process, to understand possible uncertainties and biases. One problem related to white dwarfs, which was obvious already in the first white dwarf catalogue publication (Kleinman et al., 2004), was the apparent systematic increase of the mean surface gravity of DAs below effective temperatures of approximately 12000 K, determined from spectral fits, was again demonstrated in the data of the Data Release 4 (Eisenstein et al., 2006) and confirmed by Kepler et al. (2007) and DeGennaro et al. (2008).
While the huge number of objects and the homogeneity of the survey make this feature very obvious, it is by no means a new discovery. A similar trend was first recognized with data from the Palomar-Green Survey (Bergeron et al., 1990; Bergeron, 1992, and several other papers of the Montreal group), and more recently by Liebert et al. (2005). A similar effect was also found in the data from the ESO Supernova Ia Progenitor Survey (SPY) by Voss (2006). A first conclusion therefore is that this effect is not a peculiarity of the SDSS data collection or reduction processes. In this paper we study the remaining possibilities
-
•
the effect could be real, i.e. the DAs show a real increase of the average mass towards lower temperatures
-
•
it could be caused by the fitting between observations and theoretical models used to determine the atmospheric parameters
-
•
uncertainties in input physics or a flaw in the models used
For our study we use the data of DR4 as provided from the SDSS database, with slight changes in reduction software compared to Eisenstein et al. (2006). We also use very nearly the same models as used in that work for our “standard analysis” (see below). The major difference are the fitting algorithms: whereas the SDSS uses the whole spectra, adjusted with a polynomial using information from the photometry, we here use only the spectral lines, with the continuum adjusted on both sides of the line center. This technique minimizes the influence of uncertainties in the flux calibration. The SDSS photometry gives an independent estimate of parameters, which is used to distinguish between the two solutions, which exist for most objects between 8000 and 18000 K.
In the main part of this study we vary some of the parameters in the input physics, in the hope of finding some hints for the origin of the effect. This concerns the treatment of convection, of the non-ideal effects in the occupation numbers, and a possible admixture of invisible helium. All these possible explanations have been proposed and studied in various papers of the Montreal group. We partially repeat this work here with a much larger and very homogeneous sample.
2 Statement of the problem
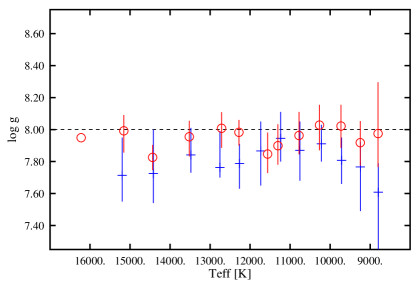
Figure 2 shows a subsample of the brighter, cool ( K) DAs in the DR4 results. The parameters were determined by SJK; the only significant difference to Eisenstein et al. (2006) was a larger model grid. While the scatter of the distribution and trend towards large is similar for the two subsets, it is much smaller than in the total sample, which includes many fainter stars (see DR4 for a comparison). A S/N of at least 20, and preferably is a minimum requirement for reliable spectral analysis; we will therefore in the remaining tests use the bright sample with . The trend in becomes even clearer, if we bin the results in intervals of 500 to 1000 K (Fig. 2). The spectroscopic fits show a clear increase below = 11500 K, which is somewhat more pronounced in the DR4 results than in our own fits. Since everything else is very similar, we attribute this difference to the different fitting methods. A tentative explanation could be that the SDSS polynomial correction to the flux calibration is problematic for the very extended wings of the broad Balmer lines, especially in this temperature range.
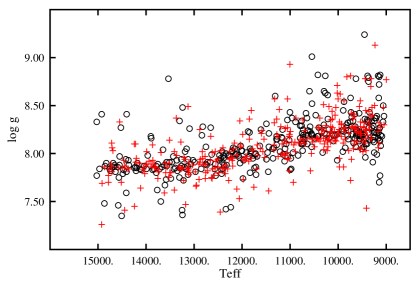
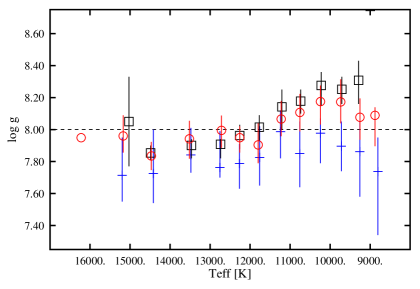
The surface gravity derived from fitting the 5 SDSS magnitudes simultaneously are slightly lower than the spectroscopic results. They also show a small increase of for lower but this is much less pronounced than in the spectroscopic data. We would like to make a few remarks regarding the SDSS photometry, which is not used as much for the analysis of white dwarfs as it deserves. In the case of the DAs the discrimination for and is very good in the range from 16000 K to 8000 K, and a determination using e.g. the two-color diagram vs. can in principle give results as accurate as from spectroscopy, without the problem of having two possible solutions above and below the Balmer line maximum. However, there is still some small uncertainty in the calibration of the magnitude zero-points. As a test, we have increased the observed magnitude by 0.03, which results in a perfectly constant average sequence close to 8.0. While we do not imply that the uncertainty is as large as this, we believe that because of the calibration uncertainties the photometry should at this time not have very high weight in a study of systematic effects in the stellar parameters. We will, however, in the following sections also show the effect of model changes on the photometric solutions, which in an ideal case would agree with the spectroscopic solution.
3 Could the mass change with be real?
The input physics for our “standard” models is the same as used for the DR4 fits and will be described in more detail below. Our spectroscopic fits with these models to the DAs brighter than and between 8500 and 16000 K is our reference set for this study. There are 61 DAs with multiple spectra in this set; from the differences in the determined parameters we estimate a typical uncertainty of 2.4% for , and 0.15 in . Since the instrumentation, reduction, models, and analysis methods were the same, this is certainly still an underestimate of the real errors. Nevertheless, the number of objects are large, and the increase so systematic that it certainly cannot be explained by uncertainties of the parameter determinations.
With our reference fits the mean mass of the DAs is 0.573 M⊙ for the objects above 11500 K and 0.658 M⊙ below. Could this increase of the white dwarf masses be a real effect? Possible explanations might be different cooling times for high versus low mass white dwarfs, or higher mass progenitors (and consequently high mass wds) for older stars, which originated from older progenitors with lower metal abundances. The latter argument is, however, contradicted by the findings of Hansen et al. (2007), that old white dwarfs in globular clusters have masses close to 0.5 M⊙. All these arguments have been discussed in Kepler et al. (2007) and found not to be convincing. It is also very difficult to explain the rather sudden increase around 11500 K with these explanations, which all should lead to a more gradual transition if any.
4 Non-ideal effects in equation of state and occupation numbers
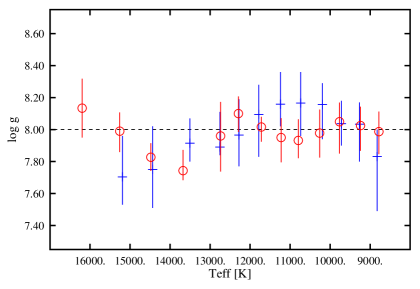
The standard treatment of these effects in white dwarf atmosphere models is the Hummer-Mihalas-Däppen occupation probability mechanism (Hummer & Mihalas, 1988; Mihalas et al., 1988; Däppen et al., 1988). For any effect above 10000 K only the interactions with charged particles are of interest. Bergeron (1993) has demonstrated that a more consistent fit between low and higher Balmer lines can be achieved by increasing the parameter in the HMD formalism from 1 to 2. The effect is to decrease the absorption in the wings of the Balmer lines, compared to the standard treatment.
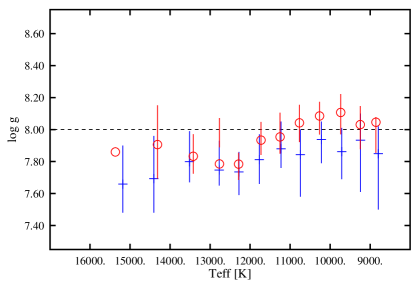
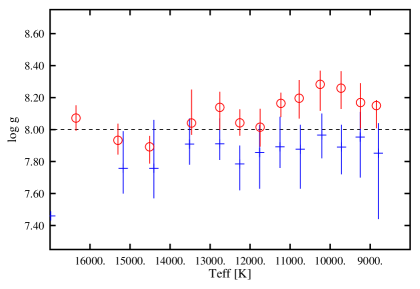
We have experimented with this parameter and show two extreme cases in Figs. 4 and 4. For the smaller value (stronger line wings) the spectroscopic solution results in smaller , as expected, and the values agree better with the photometric solution. The opposite is true for larger . Neither of the changes offers any real improvements, since the jump at 11500 K remains. This could also be expected, because the effect of changing the strength of the charged particle interaction should be continuous around this critical region. We therefore exclude this change as a possible solution.
5 Invisible helium in the atmosphere
This possible explanation was also first proposed by the Montreal group (Bergeron et al., 1990). Why could this solve the problem of increasing ? The surface gravity, which along with are the stellar parameters determined in an analysis, is only a proxy. The emission from a hot plasma is – in addition to the elemental abundances – determined by the thermodynamic variables, e.g. pressure and temperature. These variables are of course not constant throughout the visible atmosphere, but they can be described by characteristic values. For the temperature this is the effective temperature. The pressure is determined by the hydrostatic equation Assuming a constant absorption coefficient (per mass) this can be integrated to to give , showing that the pressure is inversely proportional to the absorption coefficient per mass. The latter is much smaller for helium than for hydrogen around 10000 - 12000 K, and therefore a significant helium pollution leads to higher pressure, mimicking a higher surface gravity.
A possible source of helium could be helium dredge-up by the convection zone (CVZ), which (with the standard description of convection in white dwarfs) increases significantly in depth for effective temperatures below 11500 K.
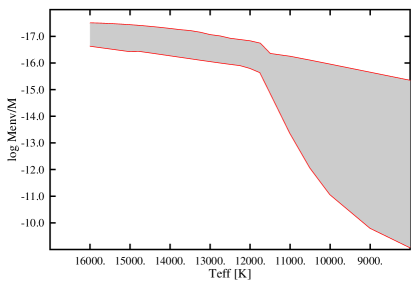
If the total amount of hydrogen in the outer layer is less than about of the total mass, such a mixing could happen near the interesting temperature range.

For simplicity we show in Figs. 7 and 7 the effect of adding a helium contamination with He:H = 0.1 and 1 by numbers in all models with K. Obviously this goes in the direction of a constant mass for all temperatures. In reality we would expect a helium pollution, which increases with decreasing , with an even more convincing result (removing the dip between 11000 and 12000 K).
Could such a helium contamination be detected directly? We remind the reader of two recently discovered objects, which provide some guidance - HS 0146+1847 and GD362. Both stars were at first classified as massive DAZ, with very strong Balmer lines and CaII (Koester et al., 2005; Gianninas et al., 2004; Zuckerman et al., 2007). Yet, at closer inspection, they turned out to be in fact helium-rich, with normal masses. In both cases high resolution and high S/N spectra were necessary to discover the weak helium lines, although the helium content is far larger than necessary to explain the average increase. In order to find more similar objects we have systematically searched spectra from the SPY survey for weak helium lines, with no new discoveries. However, an abundance ratio of He:H = 1 or smaller would in general not be detectable at the typical S/N of that survey. We also note, that both helium-rich objects also have metal traces, indicating that some kind of accretion has happened and the stars are peculiar. Nevertheless, from the observational point alone, helium pollution could be the solution.
From the theoretical side this would be very difficult to understand. The latest asteroseismological study of ZZ Cetis (Castanheira & Kepler, 2008) finds a few objects with a hydrogen layer (none ), but the vast majority have much thicker layers where no mixing is expected in the ZZ Ceti range.
6 The treatment of convection
The description of the energy flux by convection is one of the few remaining problems in stellar astrophysics. In the field of white dwarfs it has become customary to increase the freedom in the mixing-length approximation with 3 more parameters in addition to the mixing-length itself. The different versions are distinguished as ML1, ML2, ML3, with the mixing length added as in ML1/ or short ML1/2.0 (see e.g. Fontaine et al., 1981; Koester et al., 1994, for the nomenclature). For our current study the main point is that these versions differ in the efficiency of energy transport: the more efficient a version is the smaller can the temperature gradient be which transports the necessary flux. This temperature gradient in turn has a strong influence on the line profiles, and to a lesser degree also on the continuum energy distribution.
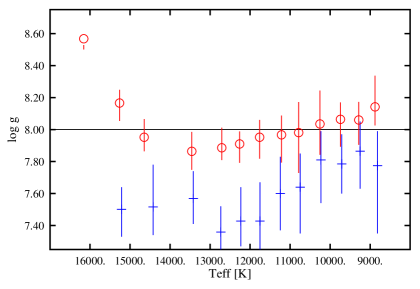
We have experimented with various mixing-lengths in the framework of the ML1 and ML2 versions. The changes always bring changes to the sequence of average , but none solves the problem in the sense that a constant average results. As two extreme examples (which are outside the ML framework) we present in Figs. 9 and 9 a model set with convection totally suppressed (extremely inefficient) and another one with the convective gradient forced to the adiabatic gradient (infinite efficiency). In the second case this has an influence even at rather high temperatures, because there are thin convection zones, which are, however, normally inefficient and don’t change the radiative gradient.
While this result is not encouraging, we nevertheless want to argue, that incorrect description of the convective gradient is still the most likely and in our opinion the only possibility to account for the observed effect.
First, there is a very striking coincidence near K between the steep increase in the thickness of the convection zone and the increase in the average . Of the other possible solutions only the helium contamination would be able to explain this coincidence.
Second, and even more important: we definitely know that our current description of convection is incorrect. The current choice of parameters in the mixing-length approximation (ML2/0.6, or very similarly ML1/1.75) was introduced by Koester et al. (1994) and Bergeron et al. (1995) to allow a consistent parameter determination from optical and ultraviolet spectra. The effective temperatures found with this version for ZZ Cetis are in many cases so hot, that the thermal time scale of the CVZ is at most a few seconds, much shorter than the pulsation periods. On theoretical grounds, these timescales are expected to be of similar magnitude, and consequently Bergeron et al. (1995) concluded that no single choice of ML parameters can simultaneously reproduce optical and UV spectra and the location of the instability strip. Convection must be more efficient in deeper layers than in the atmosphere, at least when studied within the ML framework.
This same conclusion was reached completely independently by Ludwig et al. (1994). When comparing the temperature profile from a two-dimensional hydrodynamic simulation of a white dwarf with = 12600 K, = 8 with mixing-length models of the atmosphere and envelope they found that the mixing-length must increase with depth.
7 Conclusions
The frustrating result of this study is that we cannot propose any change of approximations in the input physics, which would clearly lead to the desired result – a constant average mass for all white dwarfs for all effective temperatures. Variations of parameters in the Hummer-Mihalas-Däppen occupation probabilities can be excluded. Helium pollution cannot be definitely excluded, but could be tested with high resolution, high S/N spectra of (apparent) DAs in the range 10000 - 12000 K. Because of the asteroseismology results discussed above we consider this solution unlikely.
That leaves by default convection as the only suspect. Given the current amount of uncertainty about the correct description, and the contradictions in the current applications, we consider it quite possible that a more physically sound description of the convective flux and gradient might solve the problem.
At the end of this study a final word of caution: fitting observed spectra with theoretical models is as much an art as an objective science. One should be very sceptical of results from spectra with S/N 30, as well as DA spectra that do not include the higher Balmer lines with high S/N. Never believe the errors so readily calculated by a routine; these are errors which consider only statistical errors in the observed data. With modern CCD spectra from large telescopes systematic effects of reduction, the fitting process, and model deficiencies result in much larger errors. These can only be estimated in a meaningful way from comparing results for the same objects from different observations, and if possible, from different authors, with different fitting routines and model grids.
7.1 Acknowledgments
D.K. wishes to thank the German DAAD and Brazilian CAPES for a grant to visit his colleagues in Brazil, as well as for their kind hospitality in Florianopolis and Porto Alegre.
References
- Bergeron (1992) Bergeron, P. 1992, JRASC, 86, 309
- Bergeron (1993) Bergeron, P. 1993, in NATO ASIC Proc. 403: White Dwarfs: Advances in Observation and Theory, ed. M. A. Barstow, 267
- Bergeron et al. (1990) Bergeron, P., Wesemael, F., Fontaine, G., & Liebert, J. 1990, ApJ, 351, L21
- Bergeron et al. (1995) Bergeron, P., Wesemael, F., Lamontagne, R., et al. 1995, ApJ, 449, 258
- Castanheira & Kepler (2008) Castanheira, B., Kepler, S.O. 2008, MNRAS, in press
- Däppen et al. (1988) Däppen, W., Mihalas, D., Hummer, D. G., & Mihalas, B. W. 1988, ApJ, 332, 261
- DeGennaro et al. (2008) DeGennaro, S., von Hippel, T., Winget, D. E., et al. 2008, AJ, 135, 1
- Eisenstein et al. (2006) Eisenstein, D. J., Liebert, J., Koester, D., et al. 2006, AJ, 132, 676
- Fontaine et al. (1981) Fontaine, G., Villeneuve, B., & Wilson, J. 1981, ApJ, 243, 550
- Gianninas et al. (2004) Gianninas, A., Dufour, P., & Bergeron, P. 2004, ApJ, 617, L57
- Hansen et al. (2007) Hansen, B. M. S., Anderson, J., Brewer, J., et al. 2007, ApJ, 671, 380
- Hummer & Mihalas (1988) Hummer, D. G. & Mihalas, D. 1988, ApJ, 331, 794
- Kepler et al. (2007) Kepler, S. O., Kleinman, S. J., Nitta, A., et al. 2007, MNRAS, 375, 1315
- Kleinman et al. (2004) Kleinman, S. J., Harris, H. C., Eisenstein, D. J., et al. 2004, ApJ, 607, 426
- Koester et al. (1994) Koester, D., Allard, N. F., & Vauclair, G. 1994, A&A, 291, L9
- Koester et al. (2005) Koester, D., Napiwotzki, R., Voss, B., Homeier, D., & Reimers, D. 2005, A&A, 439, 317
- Liebert et al. (2005) Liebert, J., Bergeron, P., & Holberg, J. B. 2005, ApJS, 156, 47
- Ludwig et al. (1994) Ludwig, H.-G., Jordan, S., & Steffen, M. 1994, A&A, 284, 105
- Mihalas et al. (1988) Mihalas, D., Dappen, W., & Hummer, D. G. 1988, ApJ, 331, 815
- Voss (2006) Voss, B. 2006, PhD thesis, Universität Kiel
- Zuckerman et al. (2007) Zuckerman, B., Koester, D., Melis, C., Hansen, B. M., & Jura, M. 2007, ApJ, 671, 872