11email: paola.marziani@oapd.inaf.it; massimo.calvani@oapd.inaf.it 22institutetext: Department of Physics and Astronomy, University of Alabama, Tuscaloosa, AL 35487, USA
22email: jsulenti@bama.ua.edu,zamfi001@bama.ua.edu 33institutetext: INAF, Osservatorio Astronomico di Bologna, Via Ranzani 1, 40127 Bologna, Italy
33email: giovanna.stirpe@oabo.inaf.it
VLT/ISAAC Spectra of the H Region in Intermediate-Redshift Quasars††thanks: Based on observations made with ESO Telescopes at the Paranal Observatory under programme ID 073.B–0398(A) and 075.B–0171(A).
Abstract
Aims. We present new VLT ISAAC spectra for 30 quasars, which we combine with previous data to yield a sample of 53 intermediate redshift ( 0.9 – 3.0) sources. The sample is used to explore properties of prominent lines in the H spectral region of these very luminous quasars.
Methods. We compare this data with two large low redshift (0.8) samples in a search for trends over almost 6dex in source luminosity.
Results. We find two major trends: (1) a systematic increase of minimum FWHM H with luminosity (discussed in a previous paper). This lower FWHM envelope is best fit assuming that the narrowest sources radiate near the Eddington limit, show line emission from a virialized cloud distribution, and obey a well defined broad line region size vs. luminosity relation. (2) A systematic decrease of equivalent width [Oiii]4959,5007 (from W15 to 1Å) with increasing source bolometric luminosity (from 43 to 49). Further identified trends require discrimination between so-called Population A and B sources. We generate median composite spectra in six luminosity bins to maximize S/N. Pop. A sources show reasonably symmetric Lorentzian H profiles at all luminosities while Pop. B sources require two component fits involving an unshifted broad and a redshifted very broad component. Very broad H increases in strength with increasing while the broad component remains constant resulting in an apparent “Baldwin effect” with equivalent width decreasing from 80 to 20 Å over our sample luminosity range. The roughly constant equivalent width shown by the H very broad component implies production in optically-thick, photoionized gas. The onset of the redshifted very broad component appears to be a critical change that occurs near the Pop. A-B boundary at FWHM H 4000 km s-1which we relate to a critical Eddington ratio (0.1).
Key Words.:
quasars: general quasars: emission lines – emission lines: profiles – black hole physics1 Introduction
Much remains to be defined in quasar research even if one restricts attention to the broad emission lines often used to define them. Their broad line spectra show considerable diversity complicating attempts to generate composite spectra and making estimates of intrinsic properties such as black hole mass unreliable. In addition, the relationship between broad line emitting active galactic nuclei (Type 1 AGN) and various classes of sources that do not show broad lines (e.g. Type 2 AGN, LINERs, Blazars, NLRGs) is still uncertain. It is difficult to imagine how advances in physical understanding can come until source phenomenology is clarified. We have focused on clarifying the phenomenology of Type 1 sources because of their relatively unambiguous broad line signature. Leaving aside reverberation studies making use of source variability, observational advances can be expected to come from two areas of spectroscopic investigation: (1) inter-line comparisons (from Ly to H) in terms of relative intensity and profile shape (e.g., Shang et al., 2007); (2) moderate dispersion and high S/N studies of the H spectral region in quasars with . There is a long history of infrared spectroscopy of the Balmer lines in high redshift AGN (e.g., Kuhr et al., 1984; Espey et al., 1989; Carswell et al., 1991; Hill et al., 1993; Baker et al., 1994; Elston et al., 1994; Evans et al., 1998; Murayama et al., 1998, 1999) but only recently has it become possible to obtain spectra with resolution and S/N comparable to those for optical spectra of low sources. IR spectroscopy of H at 1.0 enables one to use the same line (H), the same rest frame determination ([Oiii]4959,5007 or narrow component of H) and the same reduction procedures for estimating the central black hole mass (). Even so observations of the most numerous and most luminous quasars at 2 can only be made when the optical lines are redshifted into one of the IR bands of high atmospheric transmission.
Spectrographs on HST have provided UV coverage of higher ionization broad lines in low- Type 1 sources (Seyfert 1 and quasars) with 150 sources having useful measures of Civ1549 (e.g., Brotherton et al., 1994; Marziani et al., 1996; Baskin & Laor, 2005; Sulentic et al., 2007). Almost all of these sources now have matching optical spectroscopic measures of the H region (e.g., Marziani et al., 2003a; Baskin & Laor, 2005; Shang et al., 2007). Continuing with a litany of difficulties we note that even some of these UV observations show marginal S/N while many do not cover the full range from Ly to 3500 Å. Optical coverage is usually not synoptical. This makes detailed intercomparisons of the strongest high and low ionization broad lines possible for only a few tens of objects at best. The lack of spectra covering the rest frame from Ly to H is unfortunate since line intensity and profile ratios provide a wealth of physical constraints. The ability to compare lines from ions of widely different ionization potentials has helped to elucidate two main emitting regions within the broad line region (BLR): (a) one responsible for the production of low-ionization lines (LIL) like Feii, H as well as Mgii2800 and (b) one that emits mainly lines (Civ1549, Heii4686) from ions of high ionization potential (HIL; e.g., Collin-Souffrin et al., 1988). Meaningful line profile studies begin with observations of Civ1549and H as the most typical HIL and LIL.
Our attempt at clarifying type 1 AGN phenomenology involves the Eigenvector 1 formalism of Boroson & Green (1992) and was later expanded into 4 dimensions (4DE1). The latter focused on four parameters including measures of H and Feii (Sulentic et al., 2000a, ; Sulentic et al., 2000b, 2007). Changes in the width and relative strength of H and Feii lines appear to be primarily related to Eddington ratio convolved with source orientation (Shang et al., 2003; Marziani et al., 2003b; Yip et al., 2004; Boroson, 2005; Collin et al., 2006). 4DE1 studies also introduced the concept of two quasar populations A and B that maximize phenomenological differences and possibly identify sources with higher and lower Eddington ratios respectively. The width of broad H (FWHM or 2nd profile moment ) have been widely used as measures of velocity dispersion in the line emitting gas (see e.g. Peterson et al., 2004; Sulentic et al., 2006; Vestergaard & Peterson, 2006), allowing what are thought to be the most reliable estimates of black hole mass in low quasars. This approach has motivated us to seek similar measures in sources with the highest possible redshift rather than using other lines as H surrogates.
In this paper we leave aside inter-line comparisons and focus on the H spectral range in low and in intermediate-to-high quasars ( 1). Near IR spectra of the latter were obtained with the infrared spectrometer ISAAC on ESO VLT Unit 1. The high S/N and resolution of the new observations allow a meaningful comparison with measures obtained for low sources. Low measures come from two samples: (1) an atlas of bright sources with z 0.8 (Marziani et al., 2003a, hereafter, ATLAS sample) and (2) a magnitude-limited sample of 321 SDSS quasars (m17.0, 0.7 from Zamfir et al., 2008, hereafter SDSS sample).
In two previous papers we focused on a search for luminosity effects involving H, Feiiopt, and [Oiii]4959,5007 (Sulentic et al., 2004, hereafter Paper I) as well as on the use of H as a virial black hole mass estimator (Sulentic et al., 2006, hereafter Paper II). This paper presents observations and reductions for 30 additional sources (; §2). We briefly discuss the H, Feii and narrow line measures (§3) and then show that the addition of 27 new sources to the VLT sample reenforces the luminosity trends described in Paper I (§4). We then consider the distribution of VLT sources in the optical plane of 4DE1. Median 4DE1 and luminosity binned composite spectra are discussed in the context of the 4DE1 Population A-B concept Sulentic et al., 2000a ; Sulentic et al. (2008). In §5 we use the binned composite spectra to decompose H and make estimates of black hole mass and Eddington ratio for Pop. A and B sources.
2 Observations and Data Reduction
Spectra for intermediate-high redshift sources were obtained between 07/2004 and 07/2006 in service mode with the infrared spectrometer ISAAC mounted on VLT1 (ANTU) at the European Southern Observatory. Table 1 summarizes the new observations. The basic format is given below the Table, following almost exactly Tab. 1 of Paper II. In addition to the format provided below Table 1 we note that Col. (3) lists the blue apparent magnitude taken from Hamburg-ESO survey papers (Reimers et al., 1996; Wisotzki et al., 2000) while Col. (4) lists the source redshift computed as described in section 2.2. Col. (8) lists the radio-loudness parameter defined as the ratio between the specific flux at 6 cm and 4400 Å in the rest frame. We applied a correction for both the radio and optical data. In the case of the radio data: where the radio spectral-index is . Only 14 of the sources have radio detections; 1.4GHz upper limits were derived for undetected sources from the NVSS detection threshold or the Sydney University Molonglo Sky Survey (SUMSS; Bock et al., 1999). Two sources are formally radio-loud following our definitions (Zamfir et al., 2008).
Each spectrum corresponds to a wavelength range (IR windows sZ, J, sH, sK; Col. (10) of Tab. 1) that covers all or part the region involving H Feii4570 and/or Feii5130. Reduction of quasar spectra and standard stars followed exactly the same procedures described in Papers I and II. Wavelength calibration yielded rms residuals of 0.4, 0.6 and 0.9 Å in the sZ, J and sH windows, respectively. Absolute flux measures will be inaccurate because atmospheric seeing almost always exceeded the slit width ( 0”.6) resulting in significant light loss. Small offsets were present in the wavelength calibration because the arc lamp frames were obtained in daytime and therefore usually after grism movement. A correction for these shifts was obtained by measuring the centroids of 2–3 OH sky lines against the arc calibration and calculating the average difference.
2.1 Sample Considerations
All 53 sources in the VLT-ISAAC sample were selected from the Hamburg-ESO (HE) quasar survey which was a color-selected and magnitude-limited ( 17.5) quasar survey (Wisotzki et al., 2000). Thirty-one new spectra are presented for 30 sources in §1 with 27 sources not previously observed. They are merged with Paper I and II measures to yield a total sample of 53 sources. Two of the new observations involve previously observed sources that were discussed in Paper I. The independent pairs of measures provide a valuable consistency check and are treated as independent data points in our statistical analysis of §4. Two new spectra obtained for HE 1505+0202 are listed in Table 1 with average values used in the analysis. HE 0353-3919 (Paper I) has been excluded from quantitative analysis because its H profile is compromised by a gap in coverage between the sZ and Z bands (see Fig. 2 of Paper I). The resultant sample of 52 sources (and 54 data points) is henceforth referred to as the ISAAC sample.
The samples of Marziani et al. (2003a, ATLAS) and Zamfir et al. (2008, SDSS) are used as low- spectroscopic comparison samples. SDSS is more complete, involving the 321 brightest -band selected (17.0) in SDSS DR5 with 0.7 while the ATLAS sample involves a more heterogeneous selection of 215 quasars largely brighter than = 16.5. We make wide use of the SDSS sample in this study because of its higher level of completeness, larger number of sources, and because results from the ATLAS sample were already presented in Paper I and II. Both the SDSS and ATLAS data enable: (1) accurate measurements of H and Feiiopt emission, (2) decomposition of the broad H profile, and (3) measures of the narrow H component (H) and [Oiii]4959,5007 lines. The SDSS sample suffers a strong Malmquist bias. The ATLAS sample shows a more uniform luminosity distribution making a correlation analysis less biased. It will be used in the analysis of luminosity trends involving FWHM H (§5).
2.2 Data Analysis
Analysis of ISAAC spectra made use of IRAF tasks to accomplish continuum and Feiiopt modeling as well as subtraction. The specfit task was employed to make a reliable model of the H spectral region. The simultaneous fitting of continuum and Feii should be less dependent on subjective evaluations by the observer. We assume that the continuum underlying the H spectral region is a power law of variable slope. Continuum subtraction has severe limitations due to the small bandwidth of our spectra and to (unknown) internal reddening effects. However, specfit usually found a plausible continuum (see Fig. 1). Estimation of continuum subtraction uncertainty due to S/N involves choosing continuum fluxes at about –3 (minimum) and +3 (maximum) levels where is the standard deviation of the most likely continuum choice. Uncertainties of continuum placement were empirically defined from the difference between extreme high/low continua and the most probable one derived by specfit.
Feiiopt emission was modeled using a scaled and broadened template as previously employed by Marziani et al. (2003a). An important change was introduced to the Feii template emission underlying H as described below (§2.3). We stress again that a notable advantage of specfit is that the scaled and broadened template can be simultaneously fit over Å with a power-law continuum, the H profile and the narrow lines (H, [Oiii]4959,5007, Fe vii5160, Fe vii5177). The strong Feii blue blend (4450–4680 Å: Feii4570) was measured as an estimator of the Feiiopt strength. The Gaussian broadening factor from the best fitting template yields an estimate of FWHM Feii. A careful estimate of minimum and maximum plausible broadening factors was made to derive uncertainties. The blue side of the spectrum including Feii4570 is missing or only marginally covered in several sources. In these cases the best template fit was achieved for the red blend (Feii5130 in the range 5200–5600 Å) and Feii4570 was estimated assuming a fixed ratio between the red and blue blends. Fig. 2 shows the estimated Feii emission (green lines).
The H profile was modelled with: (1a) a core Lorentzian component plus a weaker/broader Gaussian on the blue (usually) or on the red side of the core or, alternatively, (1b) the sum of two Gaussians one always very broad and showing non-negligible velocity shift relative to a narrower core component; (2) a narrow component (H). We do not attribute any physical meaning to the “blind” decompositions performed with specfit in the case of the double Gaussian fits for individual sources. The two types of fit provide the simplest empirical description of broad H profiles in the majority of sources. The H profile was fit with a high order spline function (IRAF task sfit) in a few cases where the model fits showed significant deviations from the actual profile. Spline functions do not yield a model fit but only an empirical fit that smooths noise and reproduces the main features and inflections in H. The spline fit approach was the one used in our previous work (Marziani et al., 2003a) where sources with FWHM H and 4000 km s-1 favored Lorentzian and double Gaussian fits respectively. Systematic differences in flux and measurements as well as in line profile parameters between the empirical and specfit approach occur since the extended wings of Gaussian and especially Lorentzian profiles lead to a lower continuum placement. The effect however is within the estimated measurement uncertainty.
The [Oiii]4959,5007 lines were also simultaneously modelled with the following conditions strictly enforced during the fitting procedure: (1) the flux ratio between [Oiii]5007 and [Oiii]4959 3, (2) both lines should show identical profiles. It was often necessary to include a “semi-broad” and/or blueshifted component to model the [Oiii]4959,5007 profile since evidence for a strong blue asymmetry was observed in several cases. This approach yields a satisfactory reproduction of the observed [Oiii]4959,5007 profiles within our resolution and S/N limits. It is again an empirical method to properly estimate the total [Oiii]4959,5007 strength and describe the line profile shape. We do not make any assumptions about the actual nature of [Oiii]4959,5007 emission which will be the subject of a separate paper.
2.3 The Feiiopt template
Considerable attention has been given to theoretical and empirical estimation of Feiiopt emission in the spectral region of H, for a number of scientific (i.e., obtain a diagnostic of the BLR) and technical goals. Theoretical calculations of Feii emission, assuming the predominance of photoionization in the Broad Line Region have greatly improved in the last decade (Sigut & Pradhan, 2003; Sigut et al., 2004; Verner et al., 1999) with a 371-level model of the Fe+ ion presently included in the photionization code CLOUDY v. 07.01 (Ferland et al., 1998). A detailed analysis of the Feii emission in I Zw 1 (Véron-Cetty et al., 2004) revealed rich and complex emission from several line systems, each associated with a well-defined redshift and FWHM. In the case of sources with larger FWHM and data with intermediate resolution as well as average S/N an analysis as detailed as that made for I Zw 1 (Véron-Cetty et al., 2004) cannot be done. The Feiiopt template approach works satisfactorily for the heterogeneous variety of type-1 AGN (Boroson & Green, 1992; Marziani et al., 2003a; Zamfir et al., 2008) with the probable exception of some outliers and extremely strong Feii emitters.
There is however a major problem associated with the empirical template: it is difficult to estimate the Feii emission under the H line. Our empirical template differs from that of Boroson & Green (1992) because of lower Feii emission under H and from Véron-Cetty et al. (2004) for the opposite reason. The new analysis of the I Zw 1 spectrum by Véron-Cetty et al. (2004), coupled with photoionization models, suggests that emission under H should not be very strong. Therefore, the strength of the Feii lines underlying H has been computed with an appropriate photoionization model. In the context of photoionization the present understanding of the Feii emitting region suggests low ionization and high electron density (Verner et al., 1999; Bruhweiler & Verner, 2008). We assumed an ionization parameter , and electron density [cm-3] . This model provides an intensity ratio between Feii m29 and H consistent with that measured in I Zw1. These improvements in the template do not significantly affect our = F(Feii4570)/F(H) W(Feii4570)/W(H) measurements. Even in the strongest Feii emitters () the change in H intensity is much lower than the associated uncertainty. The effect on H profile is to lower the Feiiopt subtraction on the red side of H making it stronger. The change with respect to the previous template is negligible in the case of weak emission but may not be so if Feii is strong and relatively narrow (see §4.2). A blueshifted, broad component ascribed to a wind (Sulentic et al., 2002; Marziani et al., 2008) is affected qualitatively by the new Feiiopt subtraction, although there are several examples of individual ISAAC sources (HE02483628, HE05123329 in Paper II) that unambiguously confirm the existence of such a component which is obvious in Ly and especially Civ1549 for several low- sources (Marziani et al., 2008).
3 Reduced Spectra and Line Measures
3.1 Redshift Determination and Rest Frame Corrections
Rest frame determination is important in quasar spectroscopy because both broad and narrow emission lines are known to show velocity displacements relative to one another. We followed our standard procedure (Marziani et al., 2003a) and adopted the H peak redshift ( Å) as rest frame for our new sources. The [Oiii]4959,5007 lines ( 4958.9, 5006.85 Å) were only used when they gave the same value as H (see Col. (6) of Tab. 1). They sometimes show a blueshift relative to the H peak and are designated as “blue outliers” in extreme cases (Zamanov et al., 2002; Marziani et al., 2003b; Aoki et al., 2005; Boroson, 2005; Komossa et al., 2008). Blue outliers usually show FWHM H 2000 km s-1 but caution should be used when adopting [Oiii]5007 or H for rest frame determination (see also Hu et al., 2008a, who suggest a systematic Feiiopt redshift with respect to the quasar rest frame). The adopted estimates were used to de-redshift the spectra while the IRAF dopcor task applied a correction to convert observed specific fluxes into rest frame values. Fig. 1 shows the flux and wavelength calibrated spectra.
3.2 Optical Feii Lines
Fig. 2 shows the continuum subtracted spectra (left panels) with the adopted Feiiopt template model superimposed. Tab. 2 provides flux and equivalent width of H, as well as flux and FWHM of Feii4570. The data format is explained in the footnotes of each table. Care should be applied in using the FWHM values for Feii4570. These values were obtained through a minimization in the specfit procedure and therefore should at least be free of any subjective bias. Uncertainties were estimated by superimposing a sequence of templates with different FWHM values on the optimal Feii4570 spectrum and estimating the confidence levels where FWHM Feii became unacceptably large or small. We find that FWHM(Feii4570) is systematically smaller than FWHM(H) and that the median value is 4000 km s-1. Uncertainties of individual Feii measurements are quite large allowing only statistical inferences to be made.
3.3 Narrow Lines
Table 3 reports the flux and equivalent widths values for H and [Oiii]5007. H is weak/marginal in most sources and undetected in 4 sources. The total flux values for [Oiii]5007 often include narrow and semi-broad components which are required to adequately fit the [Oiii]4959,5007 line profiles using specfit. Differences between the H and [Oiii]4959,5007 profiles indicate that crude intensity ratios [Oiii]5007/H may not be meaningful. The ratio [Oiii]5007/H has a clear meaning only if there is a redshift and FWHM consistency between [Oiii]4959,5007 and H.
3.4 H Line Profiles
Measurements of the broad H profile including FWHM and other important line parameters such as asymmetry index, kurtosis and line centroid at various fractional intensities were obtained using a FORTRAN program developed for the purpose. These parameters are the same as defined in Paper I and are given in Tables 4 and 5. The right-hand panels of Fig. 2 emphasize the shape of H for each source. Table 5 lists measurements of the H centroid at various fractional intensities (in km s-1). Each line measurement in Tables 4 and 5 is followed in the next column by its appropriate uncertainty at the confidence level. The uncertainties on line profile parameters were estimated by changing the fractional height by . All of these measures are affected by the compositeness of the broad H profile which frequently shows unambiguous evidence for at least two distinct components: a broad component proper (H) and very broad component (H presumably from a very broad line region, VBLR). In the following, we will continue to refer to H as the total broad emission excluding H, and to H as to the H emission after H (and of course also H) removal.
4 Results
4.1 Luminosity Effects
H –
Fig. 3 shows the distribution of H profile measures as a function of bolometric luminosity where ( = 5100 Å) for the SDSS data. Bolometric luminosity was computed from and for the ISAAC sample because of the spectra uncertain flux scale. Figure 3a (upper left panel) shows the distribution of FWHM(H) measures as a function of log where low measures come from the SDSS sample (Zamfir et al., 2008) and ISAAC sources are indicated by larger filled circles. The only obvious, well defined FWHM trend found over 5 decades of source luminosity involves an increase in the minimum FWHM H with luminosity as previously reported in Paper I. Fig.3a shows a systematic increase with of mean/median FWHM H from mean/median 3200/2550 km s-1 to 5075/4900 km s-1 which is likely driven by the minimum FWHM trend. No trend is observed, for example, among sources with FWHM 4000 km s-1. The excess of sources with FWHM 8000 km s-1 in the range = 45.5 – 46.5 simply reflects Malmquist bias amplified by the increase of sources above 45.5 due to the onset of strong source evolution in the range 0.5 – 0.7. The correlation of FWHM H with source luminosity is weak (c.f. Paper I) but statistically significant for the increased samples of this paper, with Pearsson’s correlation coefficient ().
Figure 3b (upper right) shows the distribution of asymmetry index (A.I.) as a function of luminosity. An excess of red asymmetric profiles is seen at all luminosities but does not show up well in the mean or median values which lie in the range 0.03 – 0.06 because of the strong SDSS source concentration between A.I. = 0.05. The ISAAC sample shows the highest (reddest) mean and median values with A.I. = 0.11 and 0.09, respectively. If we focus on the sources with more extreme A.I. values then we find the largest difference between the “strips” A.I. and A.I.: red asymmetries outnumber blue ones by a factor of seven. Only 17 SDSS sources (zero ISAAC) show blue asymmetries greater than –0.2 while 85 show red asymmetries greater than +0.2 (17 ISAAC). No luminosity correlation is detected with the red asymmetric excess visible at all luminosities.
Figures 3c (lower left) and 3d (lower right) show the distributions of H “peak” and “base” profile velocity displacements (line shifts), respectively. shows a strong source concentration around zero (unshifted profile base) but a significant excess of redshifts at all luminosities. There is evidence for a trend with mean/median values increasing from 56/57 km s-1 in the lowest luminosity decade to 671/292 km s-1 for the ISAAC sample. Thirteen sources (7 ISAAC) show base redshifts between 2000–4000 km s-1 while no sources show blueshifts in that range. Clearly the red excess in Figures 3b and 3d are related. If we distinguish between radio quiet (RQ) and radio loud (RL) sources (Zamfir et al., in preparation) we find the striking absence of a RL source concentration near zero. Radio loud sources span the full range of observed red and blueshifts however with a preference for redshifts. The concentration around zero is a pure RQ effect.
The centroid shows only a small number of sources with shifts above 1000 km s-1 (4 red and 7 blue and 0 ISAAC). The approximately 2 for 1 preference for blueshifts is confirmed in the range = 600 –1000 km s-1 with 8 red and 15 blueshifted sources. Mean values are slightly blue for lower luminosities (–20 to –40 km s-1 for ) and become slightly red in the highest luminosity SDSS and ISAAC bins (+35 km s-1). The simplest accretion disk models predict redshifted profile bases and blueshifted peaks (Chen et al., 1989; Eracleous & Halpern, 2003) leaving open the possibility that an underlying disk signature is present in all sources. Later discussion however does not support that conclusion for redshifted and red asymmetric profiles. The absence of strong luminosity correlations in Figure 3 is confirmed by Pearson and Spearman correlation coefficients.
[Oiii]4959,5007–
Perhaps the most striking difference between the SDSS and ISAAC samples involves the relative weakness of narrow line emission in 80% of the latter. Table 3 shows only three ISAAC sources with ([Oiii]5007) 13 Å. We previously found (Sulentic et al., 2000b) mean values for low sources in the range ([Oiii]5007)= 23 – 27 Å with standard deviations for various subsamples in the range 10 – 30 Å. Only one source in the ISAAC sample shows ([Oiii]5007) greater than the mean of the low sample: HE 0109-3518 with ([Oiii]5007) 38.5 Å, an extremely large value especially considering the high luminosity of this 2.4 quasar. This is the ISAAC source (Figure 1) that most closely resembles a low quasar. Twelve blue outliers identified by Marziani et al. (2003b) show ([Oiii]5007) 7.5Å which is the same as the mean value for the sources listed in Table 3. There is a high fraction of sources in the ISAAC sample that may show a systematic blueshift with respect to H, making several ISAAC sources similar to the blue outliers in terms of the [Oiii]4959,5007 properties. The issue will be however discussed in a separate paper.
4.2 4DE1 Parameters
A 4DE1 spectroscopic parameter space previously defined (Sulentic et al., 2000b, 2007) involves measures of FWHM(H), Civ1549 shift, and soft-X ray spectral slope (see also Boroson & Green, 1992). We focus here on the optical plane of 4DE1 where, as far as we can tell, none of the four principal parameters show a correlation with optical or UV luminosity out to 0.8. Fig. 4 shows the SDSS and ISAAC source distributions in the 4DE1 optical plane (FWHM H vs. ). Low- quasars are distributed along a curved sequence with sources showing both large FWHM H and apparently forbidden. The distribution of SDSS sources matches closely the one found in the ATLAS sample. The zone of occupation extends from the upper left where FWHM(H) is large, Feiiopt is least prominent and 50% of the sources are RL. At the opposite (lower right) end we find sources with the narrowest FWHM H profiles, strong Feiiopt and 1% radio loud sources. The centroid of the SDSS source distribution lies near FWHM H= 3800 – 4000 km s-1 and = 0.3 – 0.4.
We use the 4DE1 optical plane to see if the higher luminosity ISAAC sample shows any difference in source distribution that might hint at a luminosity trend. ISAAC sources are shown as large dots with error bars in Fig. 4. The largest distribution differences involve: (a) the absence of ISAAC sources below FWHM 3000 km s-1 and (b) an apparent displacement of almost half of the ISAAC sample towards larger values of FWHM H and : on average by 1 – 2000 km s-1 in FWHM H and by 0.1–0.2 in . Difference (a) involves the previously discussed increase in minimum FWHM H with luminosity and can be described as a zone of avoidance for high luminosity sources in the 4DE1 optical plane. Difference (b) requires more detailed study in the next section.
4.3 4DE1 Spectral Types and Composite Profiles
Further analysis of 4DE1 and source luminosity trends are best accomplished using composite spectra. This avoids confusion introduced by details in individual spectra and optimizes S/N. Composite spectra in the context of the optical 4DE1 plane have special value because Feiiopt prominence is one of the key parameters and FWHM H is arguably the most reliable virial estimator of black hole mass. Fig. 4 is subdivided into bins of FWHM(H) km s-1 and , following Sulentic et al. (2002).
Spectral types (bins) B1+, B4 and A3 each contain a single ISAAC source. A reexamination of the single B4 source HE1505+0212 suggests that Feii4570 emission is unusually strong with no reasonable continuum adjustment capable of moving it further to the left than bin B3. This source is either a genuine outlier or an extreme Pop. A source (following the luminosity-dependent boundary between Pop. A and B discussed in §4.5.1). Many ISAAC sources are located in bin B2 while SDSS sources are apparently rarer there and much more concentrated toward the lower left corner of the bin. is relatively insensitive to small changes in the adopted continuum leading us to conclude that the displacement of ISAAC sources towards higher cannot only be attributed to an effect of the data reduction. This supports the reality of distribution difference (b) discussed above.
4.3.1 Decomposition and Fitting of ISAAC Spectra in the Optical Plane of 4DE1
Median composite ISAAC spectra were computed for sources in 4DE1 bins A1, A2, B1, B2 (Fig. 5) using calibrated and de-redshifted spectra normalized to specific flux of unity at 5100 Å. The first two composites show broader FWHM(H) and the second two show stronger compared to ATLAS (Sulentic et al., 2002) or SDSS composites for the same bins.
Pop. A sources can usually be modelled with a single unshifted Lorentzian component. This is also true for bin A1 and A2 ISAAC sources. Pop. B sources usually require a double Gaussian (unshifted broad H and redshifted very broad H components: Sulentic et al., 2002). H profiles in bin B1 and B2 sources are best fit with a double Gaussian model implying that both unshifted H and redshifted H components seen in low quasars are also present in high luminosity sources (Fig. 6). The decomposition is not always unique and it can therefore be difficult to estimate the relative contributions of the two components. An important clue about the proper decomposition comes from profile variations in the source PG1416–129 (Sulentic et al., 2000c, see also 3C 206 in Corbin & Smith (2000)) where the H almost disappeared following a continuum decline while the H showed less variation and was revealed much more clearly as very broad and redshifted. The highest S/N inflected spectra in the ISAAC sample (e.g. HE0109–3518) also clearly favor this decomposition which is adopted throughout our analysis.
4.4 Luminosity Binned Spectra
Comparing mean or median spectra for random samples of quasars observed in different luminosity ranges is unlikely to yield meaningful results. Any difference would be obscured by the intrinsic dispersion of spectral properties at any given apparent luminosity. As stressed in much of our previous work (see especially the review by Sulentic et al., 2000a, ), and illustrated again in Fig. 5, all quasar spectra are not self-similar. Figure 3a reenforces this point in one dimension by showing that FWHM H spans a very large range from 500 km s-1 to 20000 km s-1. We suggest that a minimum requirement for physically meaningful comparisons among low- samples involves distinguishing between 4DE1 Pop. A and B sources. More refined comparisons becomes possible by generating composite spectra for individual Pop. A and B bins: e.g. A1, A2, A3, …and B1, B2, B1+, etc. The population A – B concept was perhaps the most controversial part of our 4DE1 formalism where sources were arbitrarily divided into population A and B based on FWHM H profile measures above and below 4000 km s-1 respectively. However we find a multitude of differences when we distinguish sources this way (Sulentic et al., 2007). Most RL sources belong to Pop. B, and about 25-30% of RQ sources also belong to Pop. B, but the Pop. A/B distinction appears to be more effective than more traditional RQ vs. RL comparisons in terms of BLR structure.
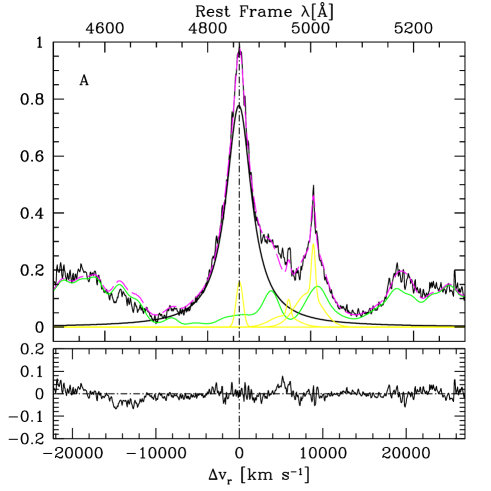
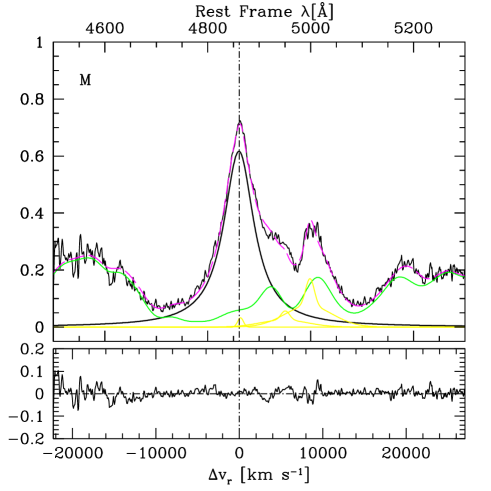
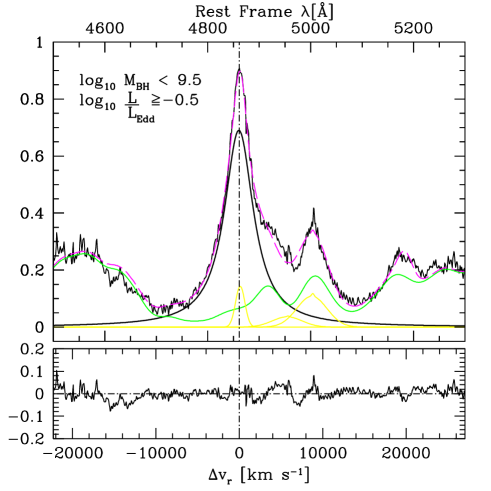
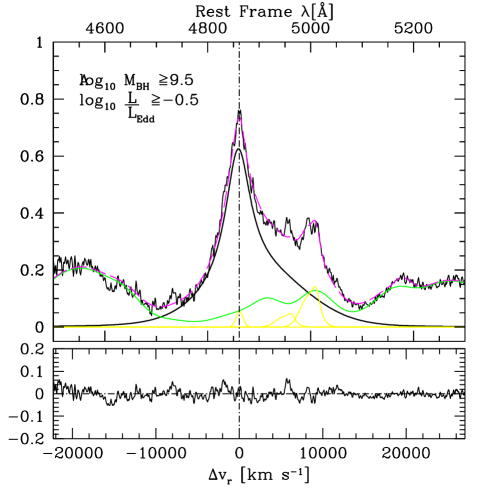
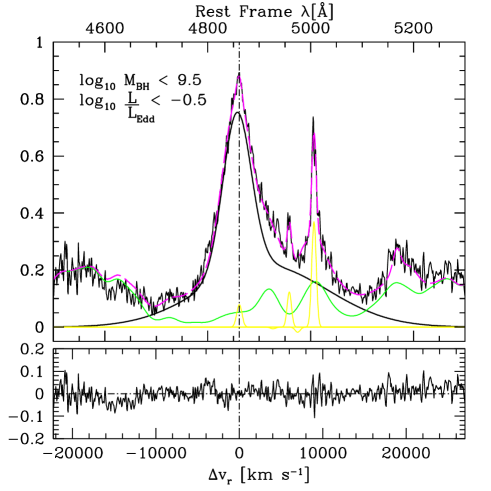
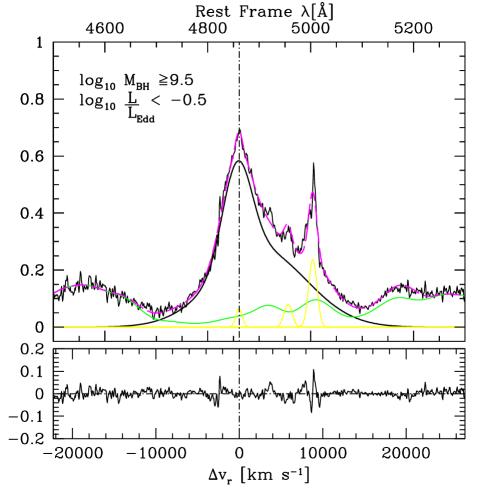
Fig. 7 shows median composite spectra in six luminosity intervals using 321 SDSS and 53 ISAAC sources. Composites were generated separately for Pop. A and B sources in decades of = 43 – 44 to 48 – 49. All ISAAC sources lie in the interval = 47–49 with a small number creating the highest bin (48–49). Pop A and B quasars show parallel trends with increasing luminosity: [Oiii]4959,5007 and H systematically decrease in equivalent width but H at the same time increasingly becomes redward asymmetric. The strong decrease in narrow line strength is expected from standard nebular theory (see e.g. Netzer, 1990, with the caveats of Sulentic et al. (2007)). The Eigenvector 2 anti-correlation between strength of Heii4686 and luminosity (Boroson & Green, 1992) is also seen. No obvious trend involving Feiiopt is seen which reflects the orthogonality of luminosity with respect to Eigenvector 1 measures using principal component analysis (PCA). The ISAAC sample median spectra are most similar to the highest luminosity SDSS bin composite. The change in H towards high luminosity appears to be concentrated in the strength of the red side of the line which was already anticipated as a red asymmetry and line base red shift in Figures 3b and 3c.
4.4.1 Decomposition of Luminosity Binned Spectra
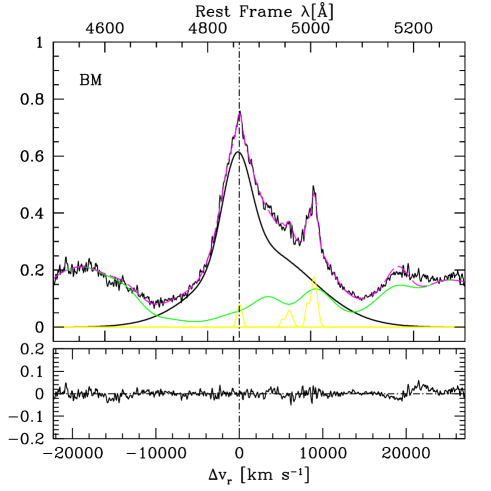
The next logical step is to decompose and quantify individual lines and line components in different Pop. A and B luminosity bins. Earlier attempts revealed one of the most obvious differences among low redshift H profiles and provided one of the motivations for the population A–B concept (Sulentic et al., 2002; Marziani et al., 2003b; Sulentic et al., 2007). Fig. 8 shows Pop A and B median spectra binned in luminosity after continuum subtraction. Tab. 6 provides line equivalent width measures and FWHM Feii values for various spectral bins discussed in the text. Tab. 7 tabulates line profile measures and Tab. 8 provides H centroid measures and estimated uncertainties for the same bins. Formats appear as footnotes below each table. The first seven lines present various 4DE1 bin values for ISAAC sources while the remainder provide luminosity bin values following the designations in Fig. 4. Measures in these tables reflect the results of simultaneous fits to all lines and components in each median composite spectrum. Attempts at a sequential line-by-line decomposition yielded very similar results. Numbers quoted in the discussion of Figure 3 are averages or medians based on individual source measures while Tables 6, 7, 8 give values derived from composite spectra. There are no significant discrepancies between measures estimated in these two ways. Source codes for bins use the first two digits of the bin followed by A or B for the population (e.g. values for line 43A correspond to measures of the Pop. A luminosity composite for log = 43 – 44). Narrow line changes with luminosity will be discussed in a separate paper so that we can concentrate on the properties of H and H. FWHM H in Pop. A sources shows a systematic increase with from 2000 km s-1 to 4100 km s-1 across the six luminosity bins likely driven by the increase in minimum FWHM H with shown in Figure 3a.
Pop. B shows no clear FWHM trend with but we find that (H) decreases systematically with increasing luminosity. Pop. A does not show an obvious trend although (H) is smallest in the most luminous Pop. A bins. The Pop. B “Baldwin Effect” shows (H) decreasing from 143 Å to 82 Å with increasing . Pop. B sources show 6–7 times larger asymmetry indices at the highest source luminosities as well as evidence for a redshift near the base () of the line. The mean velocity redshift increases by 9 times from the lowest to highest luminosity bin. Fig. 9 shows the increase with source luminosity of the fraction of redshifts for Pop. B sources. The excess flux in the red wing of H is revealed in Fig. 8 decompositions to be a real H flux excess and not due to Feiiopt contamination (see also Netzer & Trakhtenbrot, 2007, who found a similar result).
Conversely Feiiopt subtraction reveals that H shows little evidence for profile shifts and asymmetries in Pop. A sources. The apparent Pop. A red asymmetry appears to increase with luminosity in Figure 7; however Figure 8 suggests that it is mainly due to Feiiopt and [Oiii]4959,5007 contamination on the red side of H. Table 6 shows that (Feii4570) does not increase with luminosity but H decreases somewhat making red Feiiopt contamination appear to grow in strength, even if some redward, very broad emission cannot be excluded at a low flux level in the highest luminosity bins.
The quantification in Tables 6, 7, 8, and the two components required to model Pop. B sources, reenforce past evidence (Corbin, 1995; Sulentic et al., 2000c, 2002) for the existence of a redshifted very broad line component in H. The H is the most obvious profile difference between Pop. A and B, as well as between high and low luminosity sources in Pop. B. As noted earlier both RL and RQ sources are found in Pop. B and both Pop. B RL and Pop. B RQ sources show the H. This provides a strong spectroscopic argument in favor of the importance of the Pop. A-B concept compared to comparisons on the basis of radio loudness. The effect of the VBLR component is to produce a broader, more red asymmetric and redshifted H profile with the amplitude of these effects dependent on the relative strengths of the BLR and VBLR components. HE 0109–3518 in Fig. 1 is an example of a source with a weak/moderate VBLR component while HE 1039–0724 shows one of the strongest VBLR components in the ISAAC sample. Tab. 7, 8, Fig. 9, and the profile decompositions in Figure 8 show evidence for a uniform increase of H strength with luminosity.
4.5 Luminosity Dependence of Spectral Types
The left-hand panel of Fig. 10 shows the bolometric luminosity distributions for ISAAC sources showing H profile best fit with single Lorentzian and double Gaussian models. Ambiguous sources are excluded. A K-S test confirms that the two source luminosity distributions are not significantly different. The right panel shows the distribution of profile fits in an FWHM H vs. bolometric luminosity plane with Lorentzian, double-Gaussian and ambiguous sources denoted L, G and U respectively. No strong luminosity preference is seen for L or G sources. The difference between FWHM distributions for L and G profiles is highly significant with a K-S test suggesting that for sources with different profile shapes to be are drawn from the same parent population. This can be taken as an independent confirmation of the Pop. A-B dichotomy.
4.5.1 Spectral Types: A Refinement
The Pop. A-B FWHM(H) = 4000 km s-1 boundary was adopted using a low and low luminosity sample. There is no strong evidence that it has a direct physical meaning even if it is better motivated empirically than the limit at FWHM(H) km s-1 used to separate “Narrow Line” Seyfert 1s (NLSy1s) from the rest of broad line AGN.
Fig.11 presents a reprise of Figure 3a with a much expanded low redshift sample including: (a) SDSS DR5 quasars brighter than g=17.0 within z=0.7, (b) FIRST radio detected SDSS DR5 quasars between g=17.0-17.5 within z=0.7 (Zamfir et al., 2008) and (c) the ATLAS sample of low redshift quasars (Marziani et al., 2003a). This provides a somewhat better mapping of the low source distribution in the FWHM – plane. The SDSS quasar sample does not include sources with FWHM H1000 km s-1 which were classified in SDSS as galaxies. The narrowest of these “broad line” sources can be confirmed as Type 1 AGN (NLSy1) by the presence of Feii4570 emission in their spectra. Among the 400+ highest S/N SDSS quasars that we have studied in detail (Zamfir et al., 2008) all but five show detectable Feiiopt emission suggesting that the presence of optical Feiiopt emission is an ubiquitous property of Type 1 AGN. A recent survey (Zhou et al., 2006) of NLSy1s using SDSS DR3 provides a representative census of these sources. They found sources ( 0.7) brighter than between FWHM H= 450 – 2000 km s-1 and these are indicated in Figure 11 with filled triangles. The old Pop. A-B and NLSy1-rest of Type-1 AGN “boundaries” at 4000 and 2000 km s-1, respectively are indicated. This figure provides us with a better defined lower edge to the FWHM H distribution. We superpose curves corresponding to exponents a=0.52 (Bentz et al., 2006) and 0.67 (Paper II) in the Kaspi relation which will be considered in the discussion. Fig.11 also shows a revised Pop. A-B boundary following the form of an a = 0.67 Kaspi relation as done in Paper I.
Figures 10 and 11 suggest a modified 4DE1 Pop. A/B boundary is required for high luminosity quasars. We define modified 4DE1 spectral types MA1, MA2, MB1, MB2, etc. where the boundary between the MA and MB Populations is now luminosity-dependent and given by FWHM (a = 0.67; analogous to Paper I). Composite line H profiles for the revised 4DE1 bins are similar to those obtained with the fixed FWHM definition (Fig. 5 and Fig. 6) and are therefore not shown.
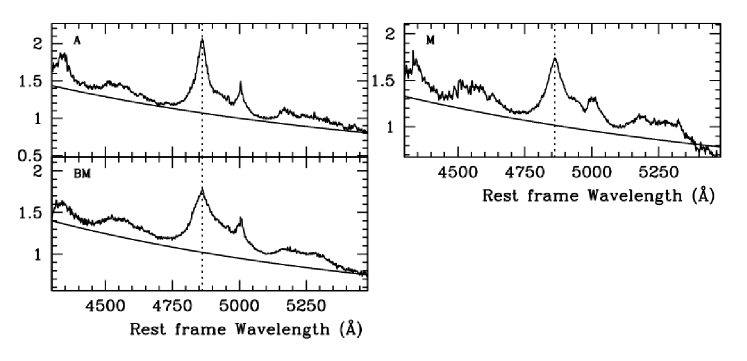
In order to decide whether the fixed (4000 km s-1) or luminosity dependent boundary is more significant we defined three samples: (1) the old Pop. A, (2) an intermediate population between 4000 km s-1 and new luminosity-dependent limit and (3) a modified Pop. B MB . We can also consider a modified Pop. A, MA . The H spectral region before and after continuum subtraction for the median spectra of A, M and MB are shown in Fig. 12 and Fig. 13 respectively. The M median most closely resembles the Pop. A median rather than MB (or B). Fig.12 and 13 show that the M H spectral region resembles the one of Pop. A, and that the H fit is well fit by a Lorentzian function, as it is the case for Pop. A sources. This suggests that the luminosity dependent limit FWHM might be more appropriate. The distribution of G and L sources in the FWHM(H) vs. luminosity plane (Fig. 10) also supports this result. Although individual fits should be treated with caution we see that the shapes are predominantly Lorentzian in the Pop. A and M regions while they are Gaussian in the MB area of the plane.
4.6 Black Hole Mass and Eddington Ratio
FWHM(H) has been used as a virial estimator of (Vestergaard & Peterson, 2006) at low redshift. The problem is what to use above redshift 0.9. The use of Civ1549 as an H surrogate involves problems that seriously reduce the reliability of high z estimates (Sulentic et al., 2007; Netzer et al., 2007). We have chosen instead to follow H out to the highest possible redshifts via infrared spectroscopy. We use the updated relationships linking FWHM(H), specific luminosity at 5100 Å and BLR radial distance from Vestergaard & Peterson (2006, their Eq. (5)). We do not enter into the caveats of black hole mass and Eddington ratio determinations (see e.g. Collin et al., 2006; Sulentic et al., 2006; Marconi et al., 2008; Shen et al., 2008) remarking only that values are uncertain by a factor 2–3 at 1 confidence level if derived from single-epoch observations. It is also possible to infer bolometric luminosity from the specific continuum flux assuming a constant bolometric correction. One can therefore also estimate the luminosity-to-mass ratio (/). This approach is very crude (see e.g. Hopkins et al., 2007; Kelly et al., 2008) but a bolometric correction is still relatively stable across RQ and most RL sources with the obvious exception of core-dominated (beamed) sources.
The distribution of ISAAC quasars with L- and G–type fits as a function of and are shown in the left- and right-hand panels of Fig. 14 respectively. Fig. 15 shows all ISAAC sources (including U H profiles) in the vs. plane. We derive quite large masses in the range log =8.5-10.0 with a range of log = to 0.0. L (assumed Pop. A) and G (assumed Pop. B) profiles favor lower/higher log and higher/lower log values, respectively, as previously found for our ATLAS sample (Marziani et al., 2003b). The difference in the distribution is significant for both and , with a low probability that sources with L- and G-type profiles come from the same parent distribution of and : K-S tests indicate a probability . However, there is a range of ( –0.3) where L– and G– type sources are almost equally represented. The absence of a sharp boundary can be understood in terms of error effects as well as of systemic biases. Typical uncertainty in is 0.1, if one assumes that the bolometric luminosity is uncertain by 50%, and that the FWHM(H) has typical error of 10%. However, this estimate neglects the scatter in the size-luminosity relationship for the BLR. In addition, orientation effects – which are established among radio loud quasars (see e.g., Sulentic et al., 2003; Rokaki et al., 2003) – may well raise the of several sources of Pop. B. They are not considered in the and estimates presented here. Moreover, the magnitude limit of our ISAAC sample makes possible that we can detect only Pop. B sources with the largest values (cf. Fig. 7 of Paper II).
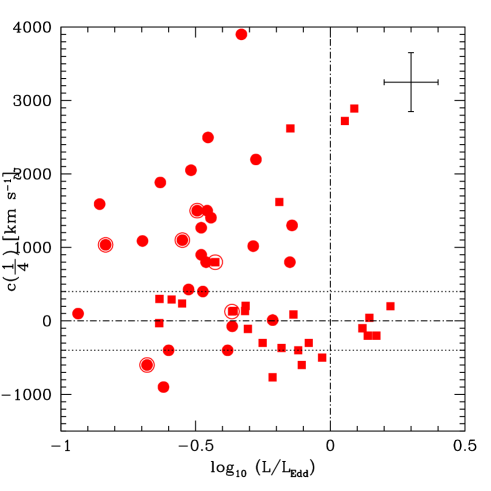
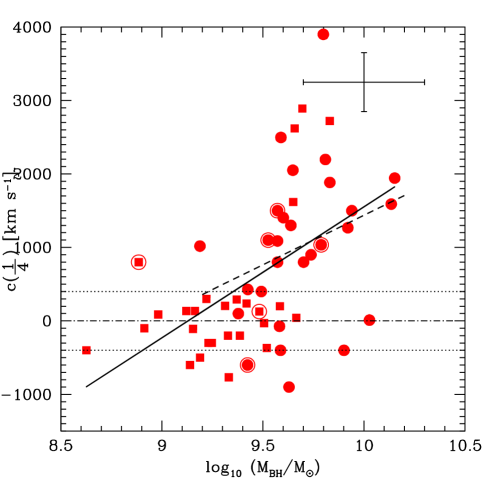
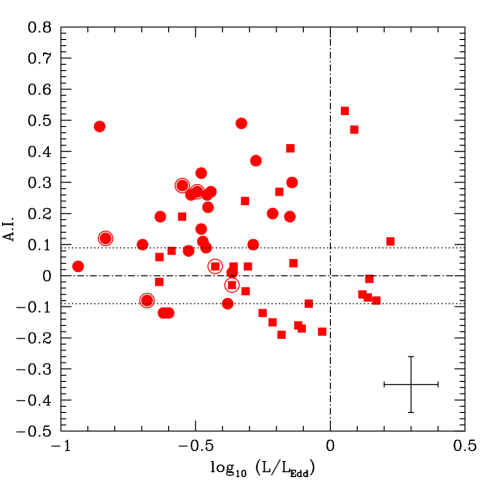
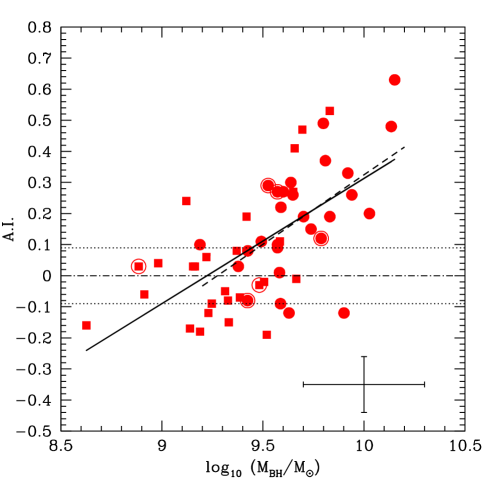
Fig. 16 shows the dependence of and A.I. on and . Significant correlations between and both A.I. and are found while no significant correlations are found involving . The A.I. vs correlation is marginally significant () if Pop. B sources are considered alone; in this case and are not significantly correlated. This is perhaps not surprising considering the small number of sources, the typical errors, the “segregation” between Pop. A and B. Median spectra in bins of and point toward the origin of the correlation with (Fig. 17). The bin labeled as actually covers masses in the range , and for corresponds to the bin / in Figure 9 of Marziani et al. (2003b). The remaining three bins represent the extension to higher masses and that were not sampled at . We see a trend, as observed at low-, that for fixed the redward component is stronger for larger . This result is discussed in §5.4.
5 Discussion
5.1 Luminosity Trends
One of the motivations for the ISAAC survey was to search for trends, or even correlations, between emission line properties and source luminosity. Another motivation was to compare high and low luminosity source properties in the 4DE1 context. PCA of a bright quasar sample (Boroson & Green, 1992) found source luminosity to be orthogonal to all line measures except (Heii4686). An [Oiii]5007 measure was included among the original Eigenvector 1 parameters (Boroson & Green, 1992) showing a large scatter likely due to the strong dependence that we find with ISAAC. We did not adopt an [OIII] measure in our 4DE1 formalism because we preferred to avoid narrow line considerations as much as possible (Sulentic et al., 2000b). Subsequent 4DE1 studies at low (e.g., Paper I and references found no luminosity dependence on broad line LIL measures. What was thought to be the most significant (inverse) correlation between luminosity and broad line HIL measures (especially Civ1549) (Baldwin et al., 1978) is now known to be present in quasar samples with small redshift/luminosity dispersion (Xu et al., 2008) and is likely related to intrinsic source properties such as Eddington ratio (Bachev et al., 2004).
Only one luminosity trend was found over the 5-6 luminosity decades covered in this study (without Pop. A/B discrimination). Profile parameter distributions (Figure 3) are essentially the same at all luminosities. The one exception involves an increase in minimum FWHM H with visible in Figure 3a (see also Paper I). Low luminosity ( = 43.0) sources show FWHM H values as low as 500–750 km s-1 while the minimum value at = 48 appears to be FWHM H 3000 km s-1. The lower FWHM H limit is expected if broad Balmer line emission arises in a virialized cloud distribution (or accretion disk) that obeys a Kaspi (see e.g. Kaspi et al., 2005) relation. We can think of the minimum FWHM- trend as the boundary for sources radiating sub-Eddington. NLSy1s defined (at low ) as sources with FWHM H 2000 km s-1 are absent from the ISAAC sample.
It is unclear if a Kaspi relation () is valid above redshifts of a few tenths. There has been much discussion about the correct exponent in the Kaspi relation with values between a = 0.5 – 0.7 favored (Kaspi et al., 2000, 2005; Bentz et al., 2006). Figure 11 provides an empirical representation of the minimum FWHM H trend. Note that the expected trend has been quadratically combined with the instrumental resolution (assumed to be 200 km s-1 at FWHM, appropriate for the SDSS). Superposed curves corresponding to a = 0.52 (Bentz et al., 2006), and 0.67 (Kaspi et al., 2005, Paper II) show that discrimination between these values becomes possible above 47. A first impression is that a = 0.52 is disfavored by the ISAAC data unless a considerable number of these sources are super-Eddington radiators. Thus values in the range a = 0.6-0.7 are favored. However a complicating factor involves the dependence of FWHM H on source orientation which is especially important if one accepts the paradigm of a line emitting accretion disk. Some low redshift sources with small FWHM H (extreme NLSy1 sources) show rapid high amplitude X-ray variability (e. g. Brinkmann et al., 2003) or blue shifted narrow lines (blue outliers) which have been argued to signal near face-on orientation. In a previous paper (Marziani et al., 2003b) we attempted inclination corrections for blue outliers assuming a dependence of FWHM. Using a tentative correction that increases black hole mass by 0.4 we were able to move many apparently superEddington NLSy1 radiators (sources with 46 that lie below the a = 0.5 curve in Figure 11) below = 1. It seems unlikely that more than a very few ISAAC sources involve preferred orientation (5 are nominally super-Eddington) given the distribution of observed FWHM H values even if optical luminosity is orientation dependent. It is also possible that orientation becomes increasingly less important in higher sources because of radiative instabiliy in the accretion disk (Blaes, 2007). A value as large as a = 0.67 would imply that all quasars radiate well below the Eddington limit. We conclude that there is no strong evidence for a population of super-Eddington radiators in our low and ISAAC samples.
5.2 4DE1 Populations A and B
This study suggests that, in order to isolate luminosity effects and other fundamental trends in quasar samples, one should work in the context of the 4DE1 formalism and take advantage of the Population A-B concept. The empirical evidence continues to grow in favor of two distinct populations of quasars. We recently summarized the multitude of empirical differences between the two populations (Sulentic et al., 2007, 2008). If luminosity trends exist for only one of the populations then the lack of a trend in the other might obscure the effect in a mixed sample such as the one displayed in Figure 11. The Pop A – B boundary was empirically defined, after noting a discontinuity between the sources whose FWHM(H) lies in the range 2000 – 4000 km s-1and those of Pop. B (also because almost all RL sources are pop. B). The similarity in emission line parameters between those sources and the NLSy1s then suggested a single population for the entire 0–4000 km s-1range. In analogy with the minimum FWHM H trend which corresponds to a fixed Eddington ratio of 1 we can expect that the limit between Pop. A and B will also be luminosity dependent (Paper I).
We have previously suggested that the Pop. A-B FWHM H boundary might reflect a critical accretion rate/Eddington ratio (). We note that a number of recent studies have independently arrived at a similar “critical” FWHM or value (Marziani et al., 2003b; Collin et al., 2006; Bonning et al., 2007; Kelly et al., 2008; Hu et al., 2008b). Such a critical value might signal a significant change in disk structure/kinematics that is reflected in systematically larger FWHM H, the demise of a Civ1549 wind as well as weaker soft X-ray and Feii emission. It is interesting to point out that the thin accretion disk approximation is expected to break down at 0.3 with the development of an inner thick structure (Hubeny et al., 2000). This kind of change might well affect the spectroscopic signature of the BLR.
It is probably naïve to expect a luminosity dependence as strong as the one predicted by a fixed (Fig. 11). The Pop. A/B boundary is found to be close to 4000 km s-1, following four lines of evidence: (1) the median spectrum for Pop. A in the luminosity bin 4344 shows that the H is Lorentzian; (2) between constant FWHM(H)=4000 km s-1 and the = 0.15 line, and for , most ATLAS sources show typical Pop. A properties. A minority of core-dominated radio-loud sources are located there since they are expected to be observed almost pole-on, at minimum FWHM. If ATLAS sources are mainly located within –500 km s-1 of FWHM = 4000 km s-1, their H profiles are similar to but not exactly the same as the ones of Pop. A. In the present paper we consider the luminosity dependence of the boundary to follow Paper I assuming a 0.67. It is assumed constant corresponding to FWHM4000 km s-1 below .
5.3 An H “Baldwin Effect” is Present only in Population B
The Pop. A/B concept provides a useful alternate way to evaluate luminosity properties. When we discriminate by source population we immediately find possible luminosity trends between FWHM and (H) for Pop. A and Pop. B respectively. The former trend sees a mean FWHM H increase with luminosity from 2000 km s-1 up to 4000 km s-1. This is likely driven by the minimum FWHM H trend already discussed as well as by Malmquist bias since all of the highest luminosity sources lie at higher redshifts and are preferentially selected in a flux limited sample. Assuming an underlying correlation between black hole mass and source luminosity we expect systematically larger black hole masses for the ISAAC sources as is observed.
Pop. B sources show a decrease in (H) by almost a factor of two over our source luminosity range. This H Baldwin effect is difficult to interpret because H is a composite feature (H + H). Tab.6 presents an attempt at quantitatively separating BLR and VBLR components for the six Pop. B luminosity binned composite spectra. The same can be done for Pop. A but the BLR component always dominates H in all luminosity bins. The BLR component in Pop. B ranges from 60% of H at low luminosity to 25% at = 47 – 48. Correction for the VBLR component yields a “super” Baldwin effect where (H) decreases by a factor of four over our luminosity range. At the same time we find considerable scatter but no obvious trend in the strength of Feii emission as measured in the Feii4570 blend. The highest luminosity Pop. B sources with smallest (H) show an apparently more prominent H while its contribution in low luminosity sources seems modest because H dominates.
The simplest interpretation of these results involves changes in physical conditions of the BLR emitting region due to: (1) source luminosity and (2) the Pop. A-B dichotomy. As alluded to above the first may involve changes related to radiation pressure dominance in the accretion disk at higher source luminosity and the second changes related to a critical Eddington ratio. The tendency for FWHM(Feii) to follow FWHM H in BLR-dominated Pop. A sources can be taken as evidence for an Feii – H BLR commonality. The inferred lower density of the VBLR (e.g., Sulentic et al., 2000c) in (less BLR dominated) Pop. B sources disfavors an Feii/VBLR emission region commonality (Marziani et al., 2008). (H) is found to be approximately constant in the six luminosity bins suggesting that it arises largely in optically thick gas photoionized by the central continuum. The largest challenge is to explain the fourfold decrease in H strength observed only Pop. B sources. The simplest interpretation involves a change in Pop. B physical conditions that suppresses H. Since H and Feii are thought to arise in the same region this might point toward collisional quenching of H BLR emission as originally suggested by Gaskell (1988). Another, even simpler possibility involves different sized annuli for Feii and H emitting regions. If we correct (H) measures for H and recalculate parameters we find that many/most Pop. B sources will move towards higher values 1 in the 4DE1 optical plane. The similar ratios observed in Pop. A luminosity bins (using H only) suggest also a similarity in physical conditions. In other words, we would have a similar low-ionization BLR in both Pop. A and B sources plus a second VBLR only in Pop. B sources.
5.4 Black Hole Mass and Eddington Ratio
Tab. 6 presents FWHM H estimates for Pop. B luminosity bins. The H of Tab. 6 is related to the “reverberating” component almost equivalent to the entire H profile in Pop. A sources. We note that the decomposition H– H of Pop. B sources assumes two Gaussians while the intrinsic shapes of H and H, especially in the radial velocity range where they overlap is, unknown. The origin of the redward asymmetry often seen in the H profile is also unclear. It seems too large to be due to gravitational redshift associated with line emission from increasingly smaller distances from the central black hole (under the assumption that the motion is predominantly virial). A likely possibility is non-virial motion associated with gas infall toward the central black hole (see e.g. Hu et al., 2008a; Gaskell & Goosmann, 2008, who provide renewed support for the hypothesis of infalling emitting regions), but alternatives like Compton scattering have also been considered (e.g. Kallman & Krolik, 1986). However, if the VBLR is mainly made of optically thick gas the radial velocity range underlying the H is especially ambiguous. Note also that the width reestimation is not the same as using the 2nd moment of the H profile: (Peterson et al., 2004; Collin et al., 2006) may have little meaning for a composite line since it is measured on the whole H profile. The reestimation leads to a more extreme reduction than suggested in Paper II; actually, all VBLR corrected FWHM values decrease to within 1000 km s-1 of the Pop. A-B boundary (4–5000 km s-1). In fact the highest luminosity bins show FWHM(H) within the revised Pop. A range as defined in Figure 10.
An important implication of this correction involves its effect on and estimation for Pop. B sources. Pop. B sources would essentially cease to exist as a separate population in the context of estimation. All values for Pop B would decrease from the previous range (Paper II) log = 7.5 – 9.5 to 7.0 – 9.0 which is more similar to the Pop. A range but still consistent with the view (Sulentic et al., 2000a, ) that Pop. B quasars are radiating at lower , as further discussed below.
Considering the uncertain and somewhat speculative nature of the corrections applied to Pop. B sources, FWHM H in Pop. A sources appears to provide more direct and reliable black hole mass estimates yielding a range in log = 6.0 – 8.5 at low and 9.0 – 10.0 at 1.0 (see figures in Paper II). The major source of uncertainty involves the inclination correction which depends on the BLR geometry. A weak VBLR component and/or blue asymmetry are present in an uncertain number of sources which might lead to slight overestimates of when assuming that the virial line component is a symmetric Lorentzian. Gaussian fits to Pop. A profiles (e.g. Shen et al., 2008) lead to significant overestimates of . Median values from our luminosity composite profiles (assuming mean FWHM H and for sources in that bin) show a clear luminosity correlation ranging from 6 – 10 for the most luminous ISAAC sources. Estimates corrected for H asymmetries are slightly lower but only for the SDSS bins.
The values in Table 6 increase from 0.02 to 0.6 in the highest luminosity bins of Pop. B. We remark that the value for the most luminous bin ( 1) is especially uncertain because of the limited number of sources and of the large correction amplitude (FWHM(H)9300 km s-1; FWM(H)4300 km s-1). values obtained using FWHM (H) without removing H (Table 7) range from 0.02 to 0.27. Similar values are obtained if FWHM(Feii4570) is used as a virial estimator to compute . The corresponding estimates for Pop. A luminosity composites also show an increase ranging from 0.2 (lowest luminosity) to 1.3 in the highest luminosity bin. Ranges for Pop A from Paper II were = 0.05 – 1.0 at low and 0.5 – 1.0 at 1.0 assuming that sources above 1.0 are the result of face-on orientation. The luminosity trend is expected for both Pop. A and B since we are sampling preferentially higher radiators with increasing (as shown in Paper II). Without H correction the difference between the of Pop. A and B is 0.6 for the SDSS luminosity bin, decreasing to 0.3 for the ISAAC luminosity bins (47 and 48). If we consider the width of H only, 0.5, even if this difference becomes rather small in the ISAAC bins, probably because of the extreme amplitude of the correction, and of the caveats listed at the beginning of this section. At any rate, from the SDSS sample we can conclude that Pop. B appears to be a population of lower Eddington ratio than Pop. A. Pop. B is likely to be an older and more evolved quasar population than Pop A, since black holes seem to reside in hosts with large spheroidal components, often elliptical galaxies (Woo et al., 2005). On the contrary the morphology of NLSy1 hosts (i.e., in many ways the “extreme Pop. A” sources) in the local Universe often involves high surface brightness star-forming galaxies (Krongold et al., 2001; Ohta et al., 2007). They are often barred and/or remarkably perturbed suggesting that they may be young systems sustained by a large flow of matter toward their central black holes (see e.g. the review by Sulentic et al., 2008).
5.5 Occupation of Spectral Type B2
ISAAC sources are found in the B2 bin of the 4DE1 optical plane (FWHM= 4-8000 km s-1 and = 0.5 – 1.0. The low ATLAS sample included only 11 sources (5%) in that bin but the more complete SDSS sample involves 40 B2 sources (10%). Bin B2 may involve sources with the largest black hole masses (several times 109 M⊙). The largest masses are expected to fall in the region of bin B2 (Zamanov & Marziani, 2002) but such massive black holes are not observed at low (see, for example the distribution as a function of in Paper II). In the ISAAC sample we derive values as high as (Sulentic et al., 2006). According to the grid in Fig. 2 of Zamanov & Marziani (2002) the B2 bin is expected to be occupied by sources with M⊙. The expected ratio is modest with . B2 sources therefore expected to share physical properties that are thought to be typical of Pop. B. The H line profile is well described by a double Gaussian decomposition also if we restrict our attention to revised bin MB2. This result is consistent with the conclusion that most sources in bin B2 are similar to those in B1 although with stronger . The H line profiles imply that both types may fall on the Pop. B side of a critical that separates Pop. A and Pop. -B boundary.
6 Conclusions
We presented VLT-ISAAC spectroscopic observations for 30 intermediate and high-luminosity HE quasars. Combined with previous data we have a sample of 53 objects ( = 0.9 – 3.0) which we compare with two large low- samples (Marziani et al., 2003a; Zamfir et al., 2008). We find few correlations/trends between broad emission line properties and source luminosity. We previously proposed an empirical limit at FWHM(H) km s-1 to distinguish between two populations A-B of quasars with very different spectroscopic properties. Sources with FWHM(H) 4000 km s-1 show Lorentzian H profiles while those above this limit are best fit with double Gaussian models. This low / low luminosity dichotomy is also found for the high luminosity ISAAC sources. Elementary computations suggest that the dichotomy may be explained if a critical is associated with a BLR structure change, but the issue of the Pop.A/B boundary deserves further scrutiny. Once the population A/B dichotomy is taken into account the phenomenology of the H emitting region, as well as inferences about BLR structure are quite similar over a 5 dex luminosity range that includes some of the most luminous known quasars. This overall scenario is described in more detail by the following results of the present paper:
-
1.
A minimum requirement for quantifying and interpreting BLR properties in Type 1 AGN involves the Pop. A–B dichotomy. Spectroscopic averaging without such a discrimination appears to be equivalent to discussing stellar properties without consideration of the OBAFGKM spectroscopic sequence
-
2.
Pop. A sources show a minimum FWHM H that increases with source luminosity from 500-1000 km s-1 to 3000-3500 km s-1. The best boundary to this lower envelope favors an exponent a 0.67 in the Kaspi relation. Pop. A sources span a FWHM H range of 4000 km s-1 driven by source orientation and virial motions in an accretion disk. The virial assumption implies a range of 4dex ( = 6–10) for this high accreting population. In the ISAAC sample studied in this paper Pop. A sources show .
-
3.
H emission in Pop. B sources involves both unshifted broad (H) and redshifted very broad line (H) components. Pop. B shows a “super” Baldwin effect with (H) decreasing by a factor 4 with increasing . At the same time (H) remains almost constant implying that it arises in a photo-ionized optically thick medium. FWHM(H) component shows no luminosity dependence after correction for H broadening. This yields an range similar to that for Pop. A. Pop. B is a lower accreting population with for the objects of this paper. One should bear in mind the caveats of §4.6 in analyzing the limits, and that 80% of Pop. B sources of the ISAAC sample show . Considering the blurring by errors in estimates, and results of previous papers, intrinsic ranges could be 0.01 – 0.2 (Pop. B) and 0.2 – 1 (Pop. A), with a separation at . Pop. B sources in the SDSS sample seem to remain a population of lower Eddington ratio even if the extreme correction to FWHM implied by removal of the H is applied (§5.4).
-
4.
Most Type 1 AGN do not show broad line profiles consistent with simple accretion disk models. Perhaps Lorentzian Pop. A profiles can be accommodated with thin/slim disk emission models (if disk emission is very extended) but Pop. B cannot. The redshifted H in Pop. B sources can not be considered part of a double peak signature since the asymmetry and the centroid shift at intensity (near the profile base is usually too large to be attributed to a gravitational redshift. Arp 102B – the prototypical “double-peaked” Balmer line emitter – shows a redshift at line base that is modest, and consistent with the value expected for gravitational redshift at the inner emitting radius of the accretion disk according to the model of Chen et al. (1989). This is however not the case for many Pop. B objects that have been included in so-called double-peaked source compilations (i.e. as accretion disk candidates: e.g., Strateva et al., 2003).
-
5.
H is the dominant broad line component at high luminosity (from 25% to 60% of the H flux over our range) for Pop. B sources. The geometry and kinematics of the VBLR are yet unclear. The H redshift 1–2000 km s-1 is unlikely to be gravitational in nature. The increase in dominance with redshift favors a connection to the hypothesized infall involved with the growth. Another possibility involves photon downshifting via some form of scattering (e.g. Laor, 2006, and references therein).
Acknowledgements.
Funding for the SDSS and SDSS-II has been provided by the Alfred P. Sloan Foundation, the Participating Institutions, the National Science Foundation, the U.S. Department of Energy, the National Aeronautics and Space Administration, the Japanese Monbukagakusho, the Max Planck Society, and the Higher Education Funding Council for England. The SDSS Web Site is http://www.sdss.org/. The SDSS is managed by the Astrophysical Research Consortium for the Participating Institutions. The Participating Institutions are the American Museum of Natural History, Astrophysical Institute Potsdam, University of Basel, University of Cambridge, Case Western Reserve University, University of Chicago, Drexel University, Fermilab, the Institute for Advanced Study, the Japan Participation Group, Johns Hopkins University, the Joint Institute for Nuclear Astrophysics, the Kavli Institute for Particle Astrophysics and Cosmology, the Korean Scientist Group, the Chinese Academy of Sciences (LAMOST), Los Alamos National Laboratory, the Max-Planck-Institute for Astronomy (MPIA), the Max-Planck-Institute for Astrophysics (MPA), New Mexico State University, Ohio State University, University of Pittsburgh, University of Portsmouth, Princeton University, the United States Naval Observatory, and the University of Washington.References
- Aoki et al. (2005) Aoki, K., Kawaguchi, T., & Ohta, K. 2005, ApJ618, 601
- Bachev et al. (2004) Bachev, R., Marziani, P., Sulentic, J. W., Zamanov, R., Calvani, M., & Dultzin-Hacyan, D. 2004, ApJ, 617, 171
- Baker et al. (1994) Baker, A. C., Carswell, R. F., Bailey, J. A., Espey, B. R., Smith, M. G., & Ward, M. J. 1994, MNRAS, 270, 575
- Baldwin et al. (1978) Baldwin, J. A., Burke, W. L., Gaskell, C. M., & Wampler, E. J. 1978, Nature, 273, 431
- Baskin & Laor (2005) Baskin, A., & Laor, A. 2005, MNRAS, 356, 1029
- Bentz et al. (2006) Bentz, M. C., Peterson, B. M., Pogge, R. W., Vestergaard, M., & Onken, C. A. 2006, ApJ, 644, 133
- Blaes (2007) Blaes, O. 2007, The Central Engine of Active Galactic Nuclei, 373, 75
- Bock et al. (1999) Bock, D. C.-J., Large, M. I., & Sadler, E. M. 1999, AJ, 117, 1578
- Bonning et al. (2007) Bonning, E. W., Cheng, L., Shields, G. A., Salviander, S., & Gebhardt, K. 2007, ApJ, 659, 211
- Boroson (2002) Boroson, T. A. 2002, ApJ, 565, 78
- Boroson (2005) Boroson, T. 2005, AJ, 130, 381
- Boroson & Green (1992) Boroson, T. A., & Green, R. F. 1992, ApJS, 80, 109
- Brinkmann et al. (2003) Brinkmann, W., Grupe, D., Branduardi-Raymont, G., & Ferrero, E. 2003, A&A, 398, 81
- Brotherton et al. (1994) Brotherton, M. S., Wills, B. J., Steidel, C. C., & Sargent, W. L. W. 1994, ApJ, 423, 131
- Bruhweiler & Verner (2008) Bruhweiler, F., & Verner, E. 2008, ApJ, 675, 83
- Carswell et al. (1991) Carswell, R. F., et al. 1991, ApJ, 381, L5
- Chen et al. (1989) Chen, K., Halpern, J. P., & Filippenko, A. V. 1989, ApJ, 339, 742
- Collin et al. (2006) Collin, S., Kawaguchi, T., Peterson, B. M., & Vestergaard, M. 2006, A&A, 456, 75
- Collin-Souffrin et al. (1988) Collin-Souffrin, S., Dyson, J. E., McDowell, J. C., & Perry, J. J. 1988, MNRAS, 232, 539
- Corbin (1995) Corbin, M. R. 1995, ApJ, 447, 496
- Corbin & Smith (2000) Corbin, M. R., & Smith, P. S. 2000, ApJ, 532, 136
- Elston et al. (1994) Elston, R., Thompson, K. L., & Hill, G. J. 1994, Nature, 367, 250
- Eracleous & Halpern (2003) Eracleous, M., & Halpern, J. P. 2003, ApJ, 599, 886
- Espey et al. (1989) Espey, B. R., Carswell, R. F., Bailey, J. A., Smith, M. G., & Ward, M. J. 1989, ApJ, 342, 666
- Evans et al. (1998) Evans, A. S., Sanders, D. B., Cutri, R. M., Radford, S. J. E., Surace, J. A., Solomon, P. M., Downes, D., & Kramer, C. 1998, ApJ, 506, 205
- Ferland et al. (1998) Ferland, G. J., Korista, K. T., Verner, D. A., Ferguson, J. W., Kingdon, J. B., & Verner, E. M. 1998, PASP, 110, 761
- Fine et al. (2008) Fine, S., et al. 2008, ArXiv e-prints, 807, arXiv:0807.1155
- Hill et al. (1993) Hill, G. J., Thompson, K. L., & Elston, R. 1993, ApJ, 414, L1
- Gaskell (1988) Gaskell, C. M. 1985, ApJ, 325, 114
- Gaskell & Goosmann (2008) Gaskell, C. M., & Goosmann, R. W. 2008, arXiv:0805.4258
- Hopkins et al. (2007) Hopkins, P. F., Richards, G. T., & Hernquist, L. 2007, ApJ, 654, 731
- Hu et al. (2008b) Hu, C., Wang, J.-M., Ho, L. C., Bian, W.-H., & Xue, S.-J. 2008b, ApJ, 683, L11
- Hu et al. (2008a) Hu, C., Wang, J.-M., Ho, L. C., Chen, Y.-M., Zhang, H.-T., Bian, W.-H., & Xue, S.-J. 2008a, ApJ, 687, 78
- Hubeny et al. (2000) Hubeny, I., Agol, E., Blaes, O., & Krolik, J. H. 2000, ApJ, 533, 710
- Kallman & Krolik (1986) Kallman, T. R., & Krolik, J. H. 1986, ApJ, 308, 805
- Kaspi et al. (2000) Kaspi, S., Smith, P. S., Netzer, H., Maoz, D., Jannuzi, B. T., & Giveon, U. 2000, ApJ, 533, 631
- Kaspi et al. (2005) Kaspi, S., Maoz, D., Netzer, H., Peterson, B. M., Vestergaard, M., & Jannuzi, B. T. 2005, ApJ, 629, 61
- Kelly et al. (2008) Kelly, B. C., Bechtold, J., Trump, J. R., Vestergaard, M., & Siemiginowska, A. 2008, ArXiv e-prints, 801, arXiv:0801.2383
- Komossa et al. (2008) Komossa, S., Xu, D., Zhou, H., Storchi-Bergmann, T., & Binette, L. 2008, ApJ, 680, 926
- Krongold et al. (2001) Krongold, Y., Dultzin-Hacyan, D., & Marziani, P. 2001, AJ, 121, 702
- Kuhr et al. (1984) Kuhr, H., McAlary, C. W., Rudy, R. J., Strittmatter, P. A., & Rieke, G. H. 1984, ApJ, 284, L5
- Laor (2006) Laor, A. 2006, ApJ, 643, 112
- Marconi et al. (2008) Marconi, A., Axon, D. J., Maiolino, R., Nagao, T., Pastorini, G., Pietrini, P., Robinson, A., & Torricelli, G. 2008, ApJ, 678, 693
- Marziani et al. (2008) Marziani, P., Dultzin, D., & Sulentic, J. W. 2008, Revista Mexicana de Astronomia y Astrofisica Conference Series, 32, 103
- Marziani et al. (1996) Marziani, P., Sulentic, J. W., Dultzin-Hacyan, D., Calvani, M., & Moles, M. 1996, ApJS, 104, 37
- Marziani et al. (2003a) Marziani, P., Sulentic, J. W., Zamanov, R., Calvani, M., Dultzin-Hacyan, D., Bachev, R., & Zwitter, T. 2003a, ApJS, 145, 199
- Marziani et al. (2003b) Marziani P., Zamanov R., Sulentic J. W., Calvani M., 2003b, MNRAS, 345, 1133
- Murayama et al. (1999) Murayama, T., Taniguchi, Y., Evans, A. S., Sanders, D. B., Hodapp, K.-W., Kawara, K., & Arimoto, N. 1999, AJ, 117, 1645
- Murayama et al. (1998) Murayama, T., Taniguchi, Y., Evans, A. S., Sanders, D. B., Ohyama, Y., Kawara, K., & Arimoto, N. 1998, AJ, 115, 2237
- Nazarova et al. (2007) Nazarova, L. S., Bochkarev, N. G., & O’Brien, P. T. 2007, Astronomical and Astrophysical Transactions, 26, 401
- Netzer (1990) Netzer, H. 1990, in Blandford, R. D., Netzer, H., Woltjer, L., Courvoisier, T. J.-L., & Mayor, M. (eds.) in Active Galactic Nuclei, Saas-Fee Advanced Course 20. Lecture Notes 1990. Swiss Society for Astrophysics and Astronomy, XII, Springer-Verlag: Berlin Heidelberg New York
- Netzer et al. (2007) Netzer, H., Lira, P., Trakhtenbrot, B., Shemmer, O., & Cury, I. 2007, ApJ, 671, 1256
- Netzer & Trakhtenbrot (2007) Netzer, H., & Trakhtenbrot, B. 2007, ApJ, 654, 754
- Ohta et al. (2007) Ohta, K., Aoki, K., Kawaguchi, T., & Kiuchi, G. 2007, ApJS, 169, 1
- Osterbrock & Pogge (1985) Osterbrock, D. E., & Pogge, R. W. 1985, ApJ, 297, 166
- Peterson et al. (2004) Peterson, B. M., et al. 2004, ApJ, 613, 682
- Reimers et al. (1996) Reimers, D., Koehler, T., & Wisotzki, L. 1996, AApS, 115, 235
- Rokaki et al. (2003) Rokaki, E., Lawrence, A., Economou, F., & Mastichiadis, A. 2003, MNRAS, 340, 1298
- Shang et al. (2003) Shang, Z., Wills, B. J., Robinson, E. L., Wills, D., Laor, A., Xie, B., & Yuan, J. 2003, ApJ, 586, 52
- Shang et al. (2007) Shang, Z., Wills, B. J., Wills, D., & Brotherton, M. S. 2007, AJ, 134, 294
- Shen et al. (2008) Shen, Y., Greene, J. E., Strauss, M. A., Richards, G. T., & Schneider, D. P. 2008, ApJ, 680, 169
- Sigut et al. (2004) Sigut, T. A. A., Pradhan, A. K., & Nahar, S. N. 2004, ApJ, 611, 81
- Sigut & Pradhan (2003) Sigut, T. A. A., & Pradhan, A. K. 2003, ApJS, 145, 15
- Strateva et al. (2003) Strateva, I. V., et al. 2003, AJ, 126, 1720
- Sulentic et al. (2007) Sulentic, J. W., Bachev, R., Marziani, P., Negrete, C. A., & Dultzin, D. 2007, ApJ, 666, 757
- (66) Sulentic, J. W., Marziani, P., & Dultzin-Hacyan, D. 2000a, ARA&A, 38, 521
- Sulentic et al. (2000b) Sulentic, J. W., Marziani, P., Zwitter, T., Dultzin-Hacyan, D., & Calvani, M. 2000b, ApJ, 536, L5
- Sulentic et al. (2000c) Sulentic, J. W., Marziani, P., Zwitter, T., Dultzin-Hacyan, D., & Calvani, M. 2000c, ApJL, 545, L15
- Sulentic et al. (2002) Sulentic, J. W., Marziani, P., Zamanov, R., Bachev, R., Calvani, M., & Dultzin-Hacyan, D. 2002, ApJ, 566, L71
- Sulentic et al. (2008) Sulentic, J. W., Zamfir, S., Marziani, P., & Dultzin, D. 2008, Revista Mexicana de Astronomia y Astrofisica Conference Series, 32, 51
- Sulentic et al. (2006) Sulentic, J. W., Repetto, P., Stirpe, G. M., Marziani, P., Dultzin-Hacyan, D., & Calvani, M. 2006, AAp, 456, 929 (Paper II)
- Sulentic et al. (2004) Sulentic, J. W., Stirpe, G. M., Marziani, P., Zamanov, R., Calvani, M., & Braito, V. 2004, AAp, 423, 121 (Paper I)
- Sulentic et al. (2003) Sulentic J. W., Zamfir S., Marziani P., Bachev R., Calvani M., Dultzin-Hacyan D., 2003, ApJ, 597, L17
- Tsuzuki et al. (2006) Tsuzuki, Y., Kawara, K., Yoshii, Y., Oyabu, S., Tanabé, T., & Matsuoka, Y. 2006, ApJ, 650, 57
- Verner et al. (1999) Verner, E. M., Verner, D. A., Korista, K. T., Ferguson, J. W., Hamann, F., & Ferland, G. J. 1999, ApJS, 120, 101
- Véron-Cetty et al. (2004) Véron-Cetty, M.-P., Joly, M., & Véron, P. 2004, A&A, 417, 515
- Vestergaard & Peterson (2006) Vestergaard, M., & Peterson, B. M. 2006, ApJ, 641, 689
- Wisotzki et al. (2000) Wisotzki, L., Christlieb, N., Bade, N., Beckmann, V., Köhler, T., Vanelle, C., & Reimers, D. 2000, A&A, 358, 77
- Woo et al. (2005) Woo, J.-H., Urry, C. M., van der Marel, R. P., Lira, P., & Maza, J. 2005, ApJ, 631, 762
- Xu et al. (2008) Xu, Y., Bian, W.-H., Yuan, Q.-R., & Huang, K.-L. 2008, ArXiv e-prints, 806, arXiv:0806.1787
- Yip et al. (2004) Yip, C. W., et al. 2004, AJ, 128, 2603
- Zamanov & Marziani (2002) Zamanov, R., & Marziani, P. 2002, ApJ, 571, L77
- Zamanov et al. (2002) Zamanov, R., Marziani, P., Sulentic, J. W., Calvani, M., Dultzin-Hacyan, D., & Bachev, R. 2002, ApJ, 576, L9
- Zamfir et al. (2008) Zamfir, S., Sulentic, J. W., & Marziani, P. 2008, MNRAS, 387, 856
- Zhou et al. (2006) Zhou, H., Wang, T., Yuan, W., Lu, H., Dong, X., Wang, J., & Lu, Y. 2006, ApJS, 166, 128
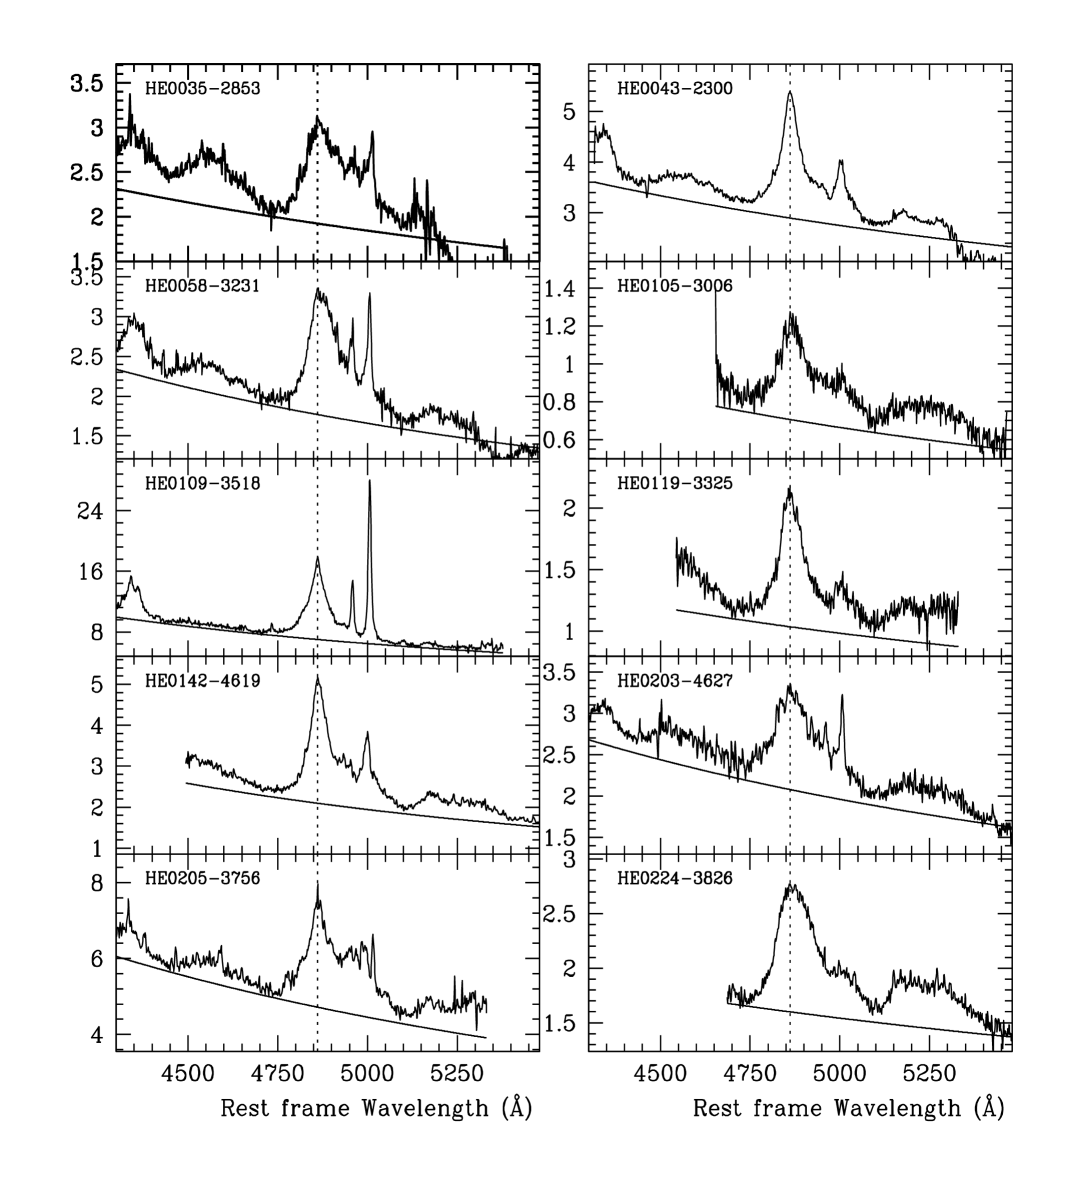


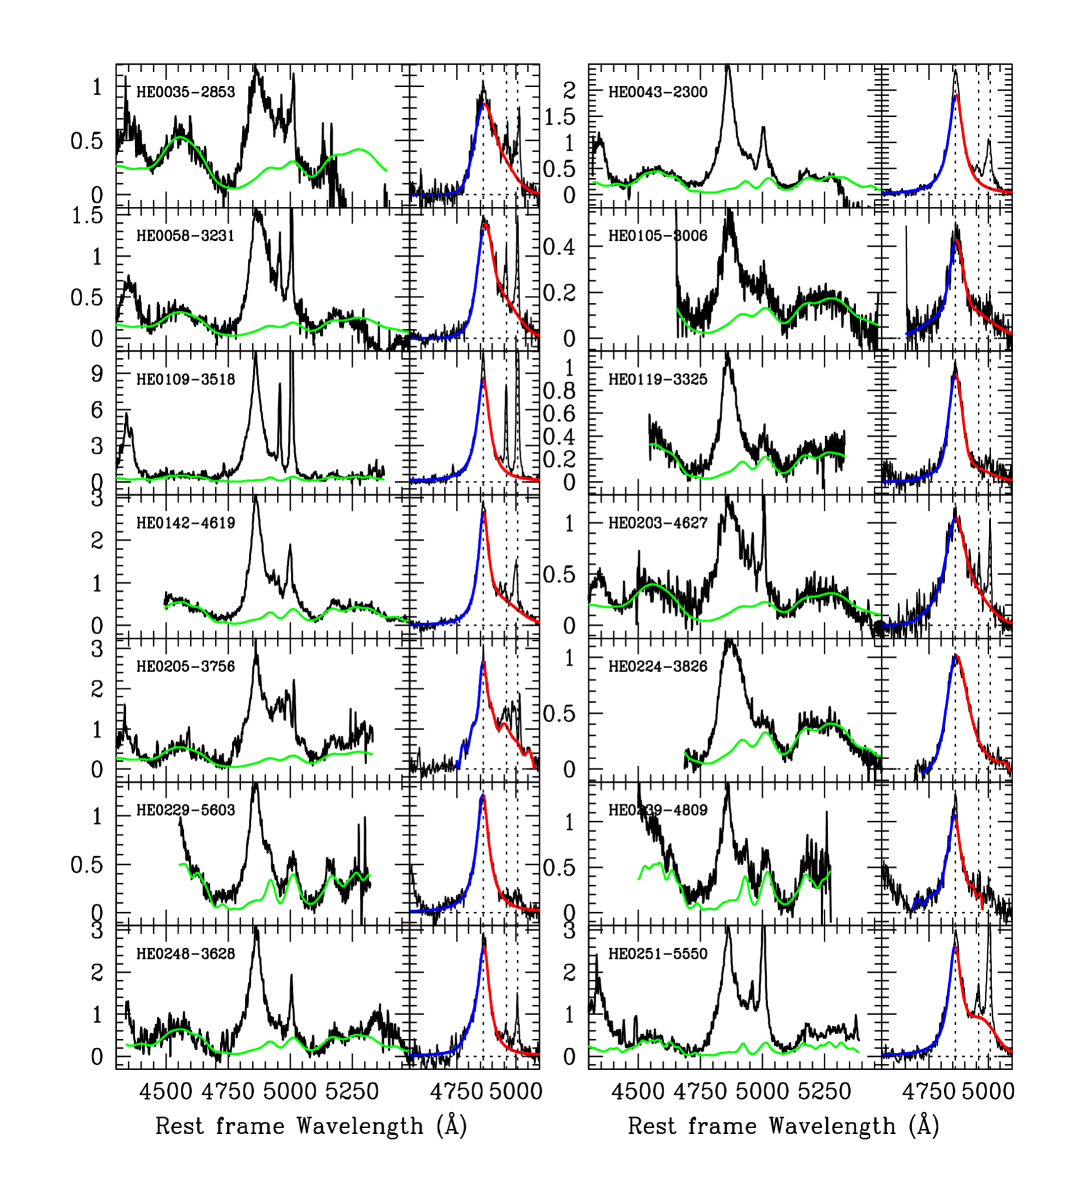
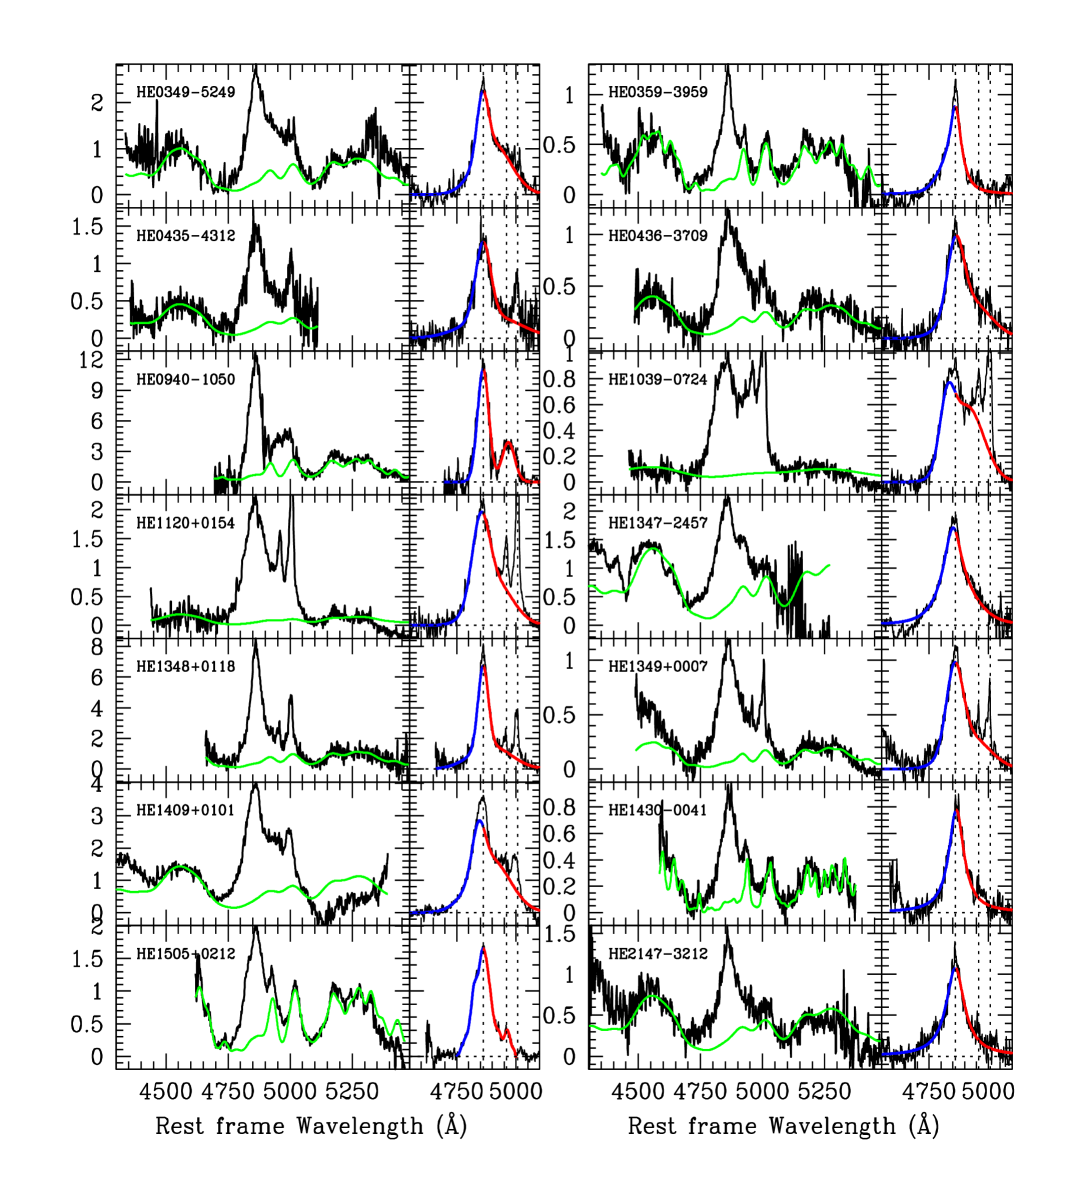
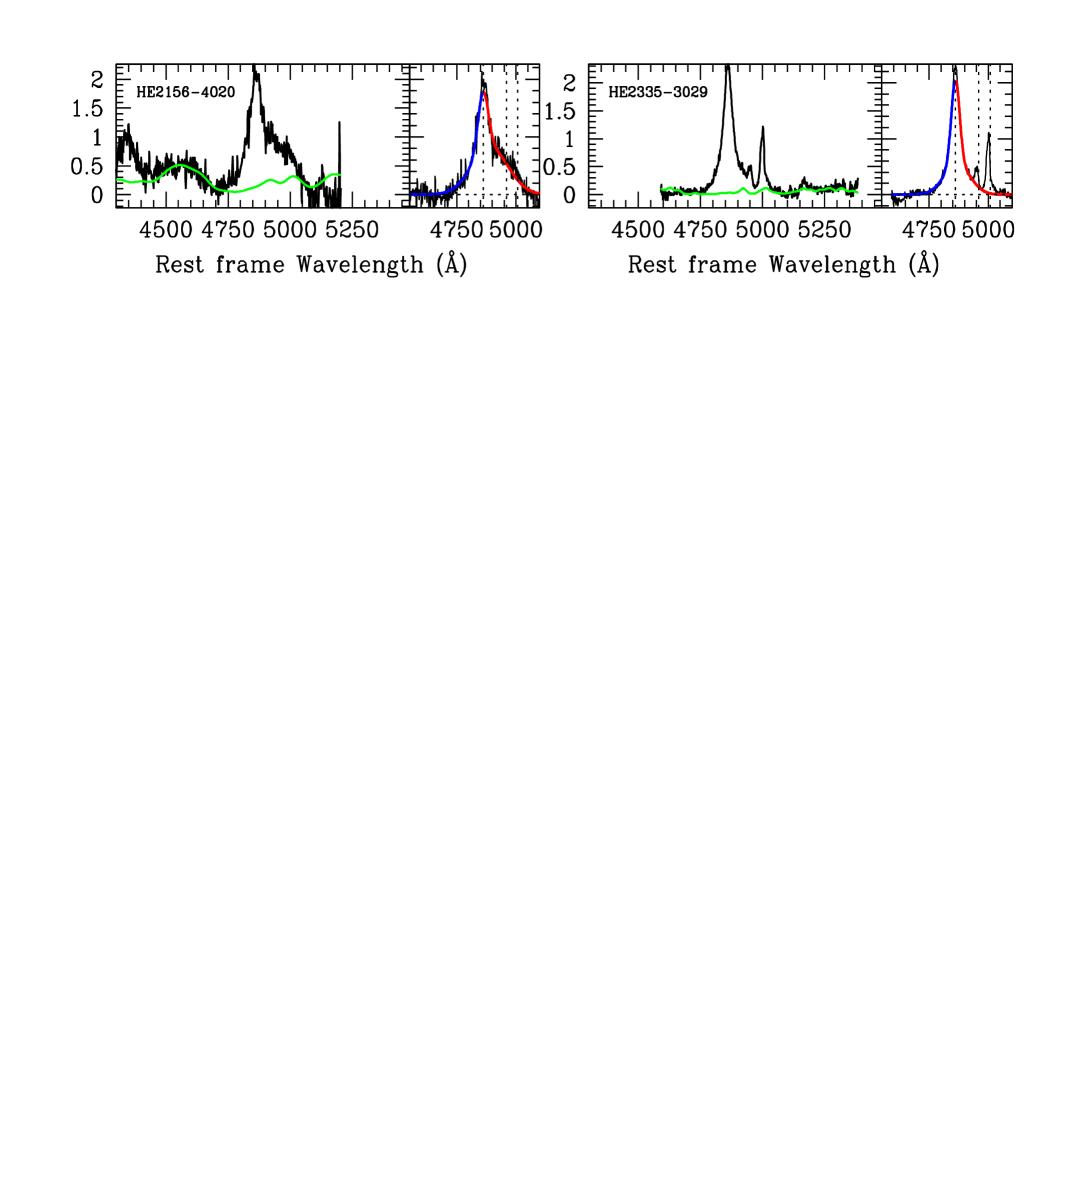
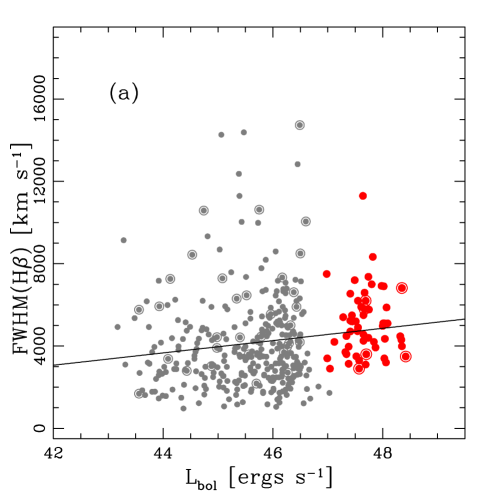
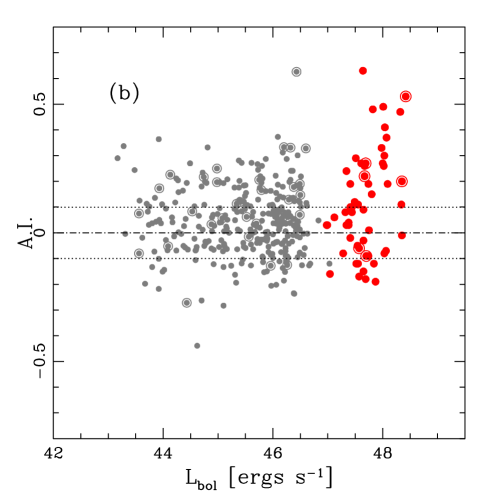
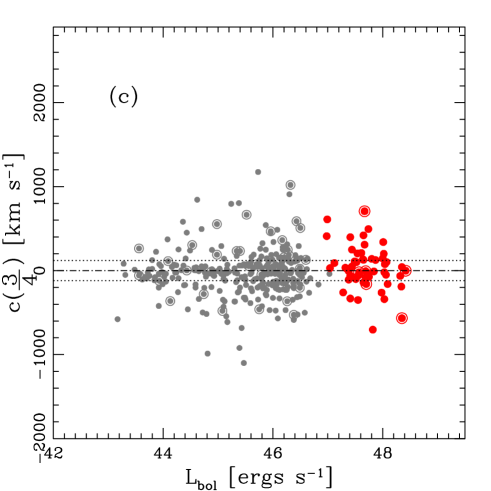
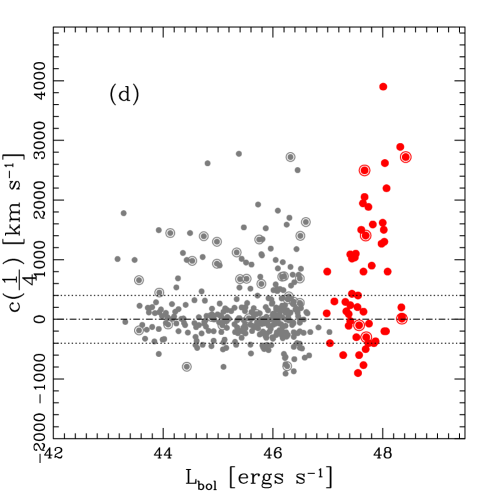
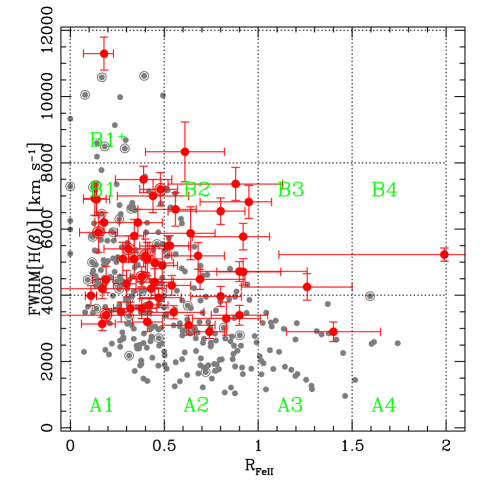
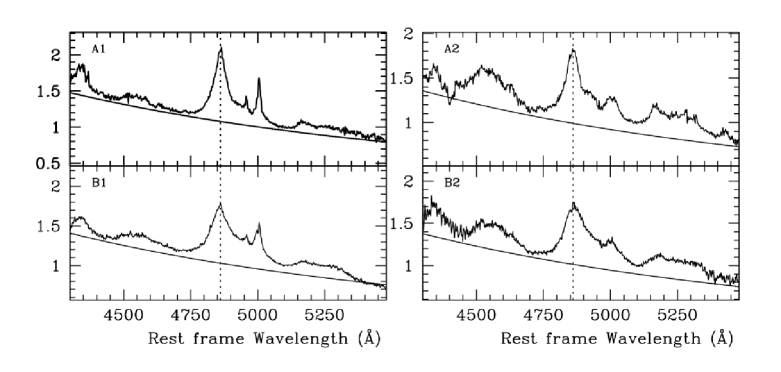
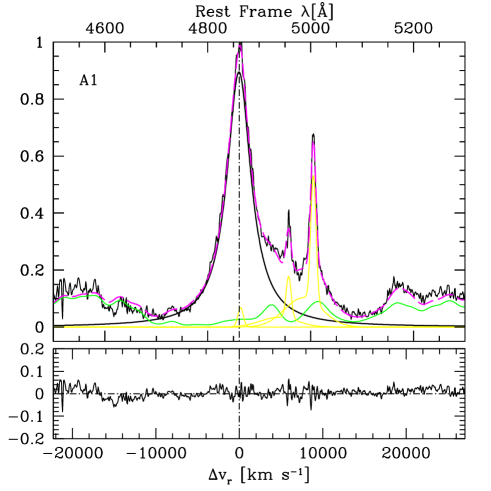
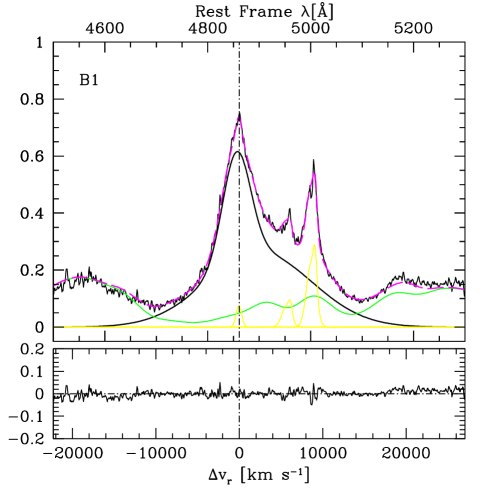
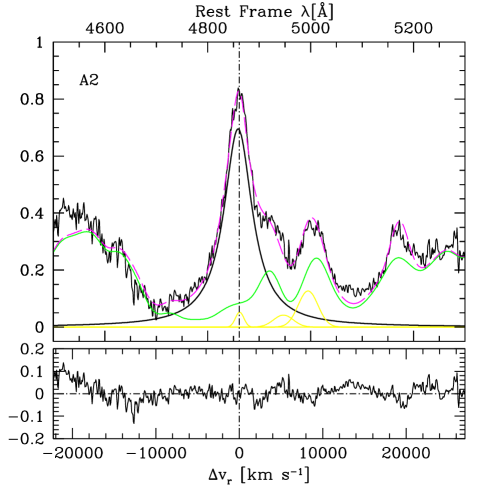


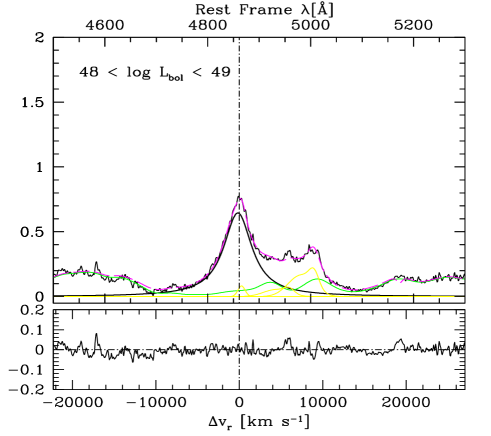
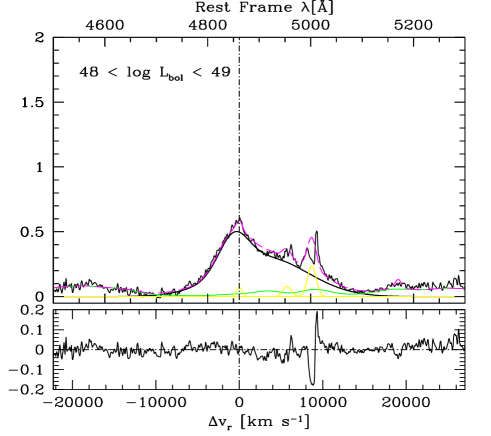
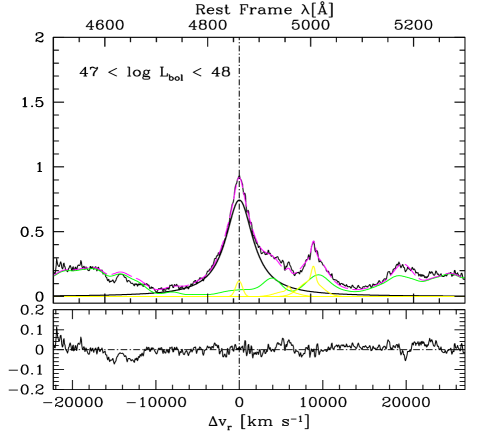
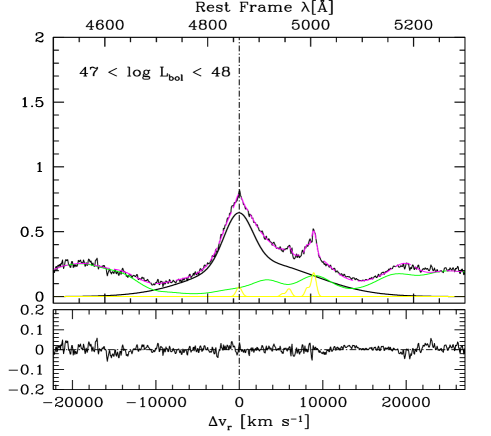
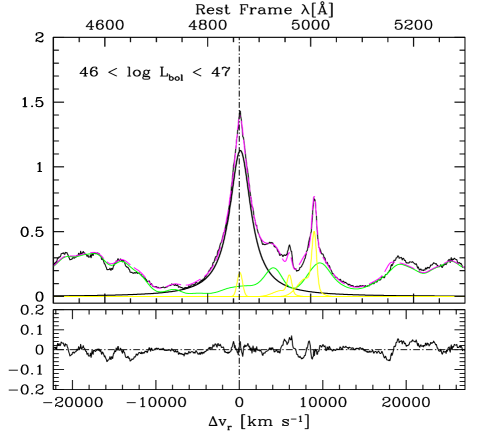
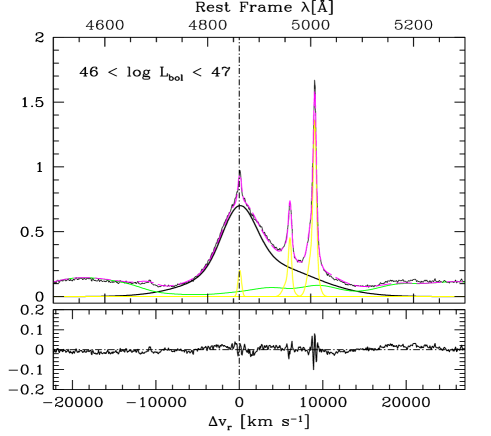
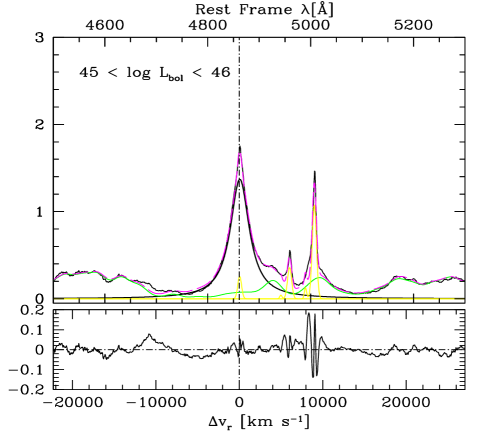
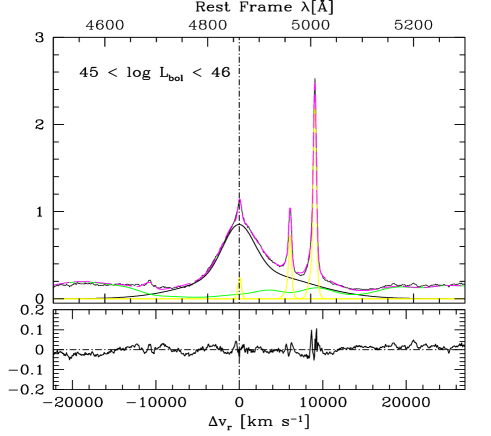

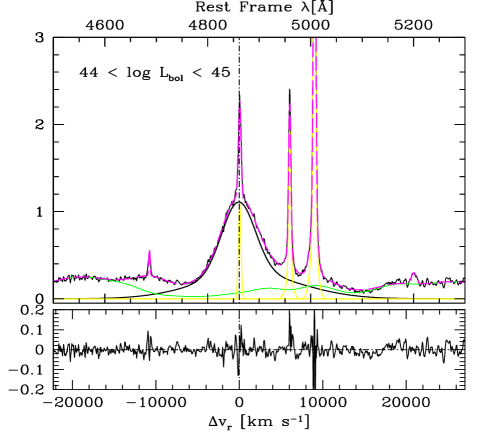
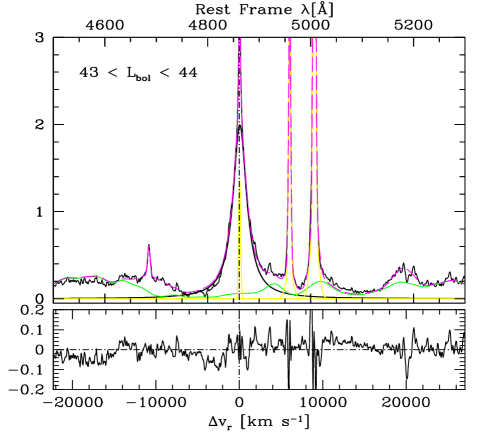
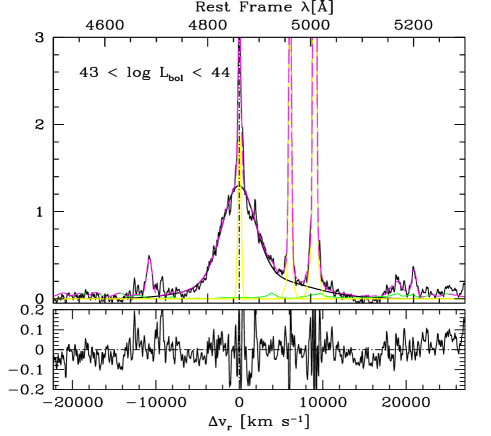
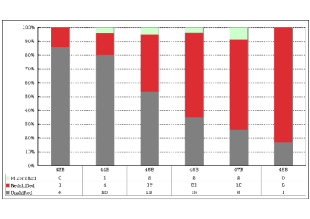

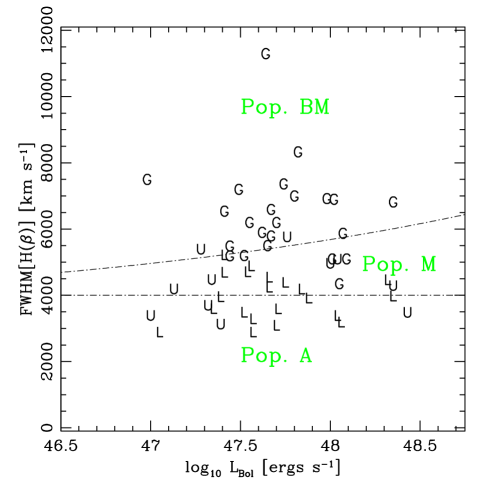

| Survey name | Other name | Linec | Datef | Bandg | DITh | N | Airmassj | S/Nk | |||||
|---|---|---|---|---|---|---|---|---|---|---|---|---|---|
| (1) | (2) | (3) | (4) | (5) | (6) | (7) | (8) | (9) | (10) | (11) | (12) | (13) | (14) |
| HE0035-2853 | 17.03 | 1.6377 | 0.0012 | 1,2,3 | -28.10 | 0.21 | 2004/07/13 | J | 180 | 20 | 1.12-1.03 | 20 | |
| HE0043-2300 | 17.06 | 1.5402 | 0.0014 | 1 | -27.89 | 2.03 | 2004/08/08 | J | 180 | 20 | 1.01-1.08 | 40 | |
| HE0058-3231 | Q 0058-3231 | 17.14 | 1.5821 | 0.0002 | 1,2,3 | -27.94 | 0.24 | 2004/07/11 | J | 180 | 20 | 1.02-1.01 | 20 |
| HE0105-3006 | Q 0105-301 | 16.79 | 1.0900 | 0.0004 | 1.3 | -27.36 | 0.12 | 2004/07/28 | sZ | 180 | 16 | 1.00-1.01 | 10 |
| HE0109-3518 | Q 0109-3518 | 16.44 | 2.4057 | 0.0003 | 1,2,3 | -29.63 | -0.04 | 2004/08/02 | sH | 180 | 20 | 1.49-1.23 | 20 |
| HE0119-3325 | Q 0119-3325 | 17.17 | 1.1422 | 0.0012 | 1 | -27.11 | 1.11 | 2004/08/02 | sZ | 180 | 20 | 1.11-1.03 | 12 |
| HE0142-4619 | 17.20 | 1.1665 | 0.0017 | 1 | -27.12 | 0.55 | 2004/08/02 | sZ | 180 | 20 | 1.07-1.08 | 20 | |
| HE0142-4619 | 2004/08/03 | J | 180 | 20 | 1.62-1.34 | 25 | |||||||
| HE0203-4627 | 17.34 | 1.4381 | 0.0007 | 1,2,3 | -27.49 | 2.07 | 2004/08/03 | J | 180 | 20 | 1.28-1.15 | 10-15 | |
| HE0203-4627 | 2004/08/08 | sZ | 180 | 20 | 1.20-1.11 | 10 | |||||||
| HE0205-3756 | Q 0205-379 | 17.17 | 2.4335 | 0.0057 | 1 | -28.87 | 1.06 | 2004/08/03 | sH | 180 | 32 | 1.05-1.03 | 25 |
| HE0224-3826 | 16.83 | 1.0763 | 0.0012 | 1 | -27.29 | 0.14 | 2004/08/04 | sZ | 180 | 16 | 1.06-1.03 | 15 | |
| HE0229-5603 | 17.07 | 1.1409 | 0.0015 | 1 | -27.22 | -0.29 | 2004/08/18 | sZ | 180 | 16 | 1.52-1.36 | 20 | |
| HE0239-4809 | 17.12 | 1.1660 | 0.0009 | 1 | -27.27 | 0.84 | 2004/08/22 | sZ | 180 | 16 | 1.29-1.18 | 20 | |
| HE0248-3628 | 16.58 | 1.5355 | 0.0007 | 1 | -28.45 | 0.55 | 2004/08/22 | J | 180 | 12 | 1.08-1.04 | 25 | |
| HE0251-5550 | H25.01 | 16.59 | 2.3505 | 0.0011 | 1 | -29.56 | 0.23 | 2004/08/18 | sH | 180 | 20 | 1.31-1.21 | 35 |
| HE0349-5249 | H27.03 | 16.13 | 1.5409 | … | 1 | -28.93 | 0.76 | 2004/08/22 | J | 180 | 12 | 1.17-1.14 | 17.5 |
| HE0359-3959 | 17.09 | 1.5209 | … | 1 | -27.89 | 0.22 | 2004/08/28 | J | 180 | 20 | 1.14-1.06 | 20 | |
| HE0435-4312 | 17.10 | 1.2321 | 0.0014 | 1 | -27.35 | 0.51 | 2004/09/17 | sZ | 180 | 16 | 1.47-1.28 | 10-5 | |
| HE0436-3709 | 16.84 | 1.4447 | 0.0023 | 1 | -27.93 | 0.38 | 2004/09/17 | J | 180 | 16 | 1.10-1.04 | 10 | |
| HE0940-1050 | 16.96 | 3.0932 | … | 1 | -29.82 | 0.10 | 2005/06/10 | sK | 180 | 24 | 1.18-1.50 | 10-45 | |
| HE1039-0724 | 17.16 | 1.4584 | 0.0002 | 1,2,3 | -27.86 | 0.20 | 2005/06/23 | J | 180 | 20 | 1.19-1.44 | 20 | |
| HE1120+0154 | UM 425 | 16.31 | 1.4720 | 0.0004 | 1,2,3 | -28.70 | -0.57 | 2005/06/24 | J | 180 | 16 | 1.42-1.75 | 35 |
| HE1347-2457 | 16.83 | 2.5986 | … | 1 | -29.64 | -0.68 | 2005/04/15 | sH | 180 | 28 | 1.16-1.54 | 65-10 | |
| HE1348+0118 | Q 1348+0118 | 17.08 | 1.0873 | 0.0012 | 1 | -27.05 | 0.24 | 2005/06/13 | sZ | 180 | 12 | 1.20-1.29 | 15 |
| HE1349+0007 | UM 617 | 16.83 | 1.4442 | 0.0010 | 1,2,3 | -28.00 | -0.18 | 2005/06/24 | J | 180 | 20 | 1.25-1.52 | 15 |
| HE1409+0101 | 16.92 | 1.6497 | 0.0039 | 1 | -28.30 | 0.40 | 2005/07/21 | J | 180 | 20 | 1.18-1.38 | 55-25 | |
| HE1430-0041 | Q 1430-0041 | 16.72 | 1.1216 | … | 1 | -27.60 | -0.39 | 2005/07/21 | sZ | 180 | 16 | 1.43-1.78 | 20 |
| HE1505+0212 | 17.06 | 1.0943 | … | 1 | -27.28 | 0.51 | 2004/07/18 | sZ | 180 | 16 | 1.26-1.53 | 50 | |
| HE1505+0212 | 1.0930 | 0.0240 | 1 | 2005/05/21 | sZ | 180 | 20 | 1.28-1.57 | 30 | ||||
| HE2147-3212 | 16.84 | 1.5432 | … | 1 | -28.15 | 0.14 | 2004/07/05 | J | 180 | 20 | 1.06-1.19 | 15 | |
| HE2156-4020 | 17.39 | 2.5431 | 0.0010 | 1 | -28.75 | -0.09 | 2004/07/10 | sH | 180 | 32 | 1.05-1.20 | 15-5 | |
| HE2335-3029 | 16.96 | 1.1194 | 0.0016 | 1 | -27.21 | 0.20 | 2004/07/11 | sZ | 180 | 16 | 1.58-1.31 | 25 |
-
a
Apparent B Johnson magnitude corrected because of Galactic absorption. The value of HE 04363709 referes to the b Strömgren magnitude.
-
b
Redshift, with uncertainty in parentheses.
-
c
Lines used for redshift calculations: 1: H, 2: [Oiii]5007. 3: [O iii]4959.
-
d
Absolute B magnitude, computed for km s-1 Mpc-1, , , and -correction spectral index .
-
e
Decimal logarithm of the specific flux ratio at 6cm and 4400 Å (effective wavelength of the B band). Upper limits are from the NVSS ( 2.5 mJy), and would place all undetected sources in the RQ domain.
-
f
Date refers to time at start of exposure.
-
g
Photometric band.
-
h
Detector Integration Time (DIT) of ISAAC, in seconds.
-
i
Number of exposures with integration time equal to DIT.
-
j
Airmass at start and end of exposure.
-
k
at continuum level in the proximity of H. Two values are reported in case of different on the blue and red side of H (blue side first). The value is with N estimated at a confidence level i.e., 2 times the rms.
| Object name | F(H)a | W(H)b | F(Feii4570)c | FWHM(Feii)d |
|---|---|---|---|---|
| (1) | (2) | (3) | (4) | (5) |
| HE00352853 | 115 | 60 | 101 | 6400 |
| HE00432300 | 214 | 74 | 82 | 3900 |
| HE00583231 | 173 | 100 | 60 | 5800 |
| HE01053006 | 58 | 83 | 39 | 6000 |
| HE01093518 | 831 | 119 | 95 | … |
| HE01193325 | 93 | 90 | 64 | 4500 |
| HE01424619 | 274 | 133 | 104 | 4100 |
| HE02034627 | 159 | 77 | 76 | 6600 |
| HE02053756 | 343 | 74 | 102 | 4900 |
| HE02243826 | 123 | 77 | 98 e | 5100 |
| HE02295603 | 118 | 77 | 94 | 3000 |
| HE02394809 | 111 | 44 | 102 | 2500 |
| HE02483628 | 250 | 40 | 119 | 4300 |
| HE02515550 | 353 | 71 | 67 | 2200 |
| HE03495249 | 289 | 63 | 186 | 4700 |
| HE03593959 | 88 | 45 | 111 | 2600 |
| HE04354312 | 165 | 118 | 86 | 5900 |
| HE04363709 | 139 | 88 | 78 | 5200 |
| HE09401050 | 922 | 43 | 505 e | 3000 |
| HE10390724 | 138 | 75 | 26 | … |
| HE1120+0154 | 270 | 63 | 35 | … |
| HE13472457 | 264 | 64 | 252 | 5100 |
| HE1348+0118 | 611 | 95 | 255 | 4300 |
| HE1349+0007 | 129 | 76 | 47 | 4000 |
| HE1409+0101 | 443 | 91 | 272 | 6300 |
| HE14300041 | 87 | 50 | 78 | 1000 |
| HE1505+0212 | 176 | 59 | 350 | 2700 |
| HE21473212 | 151 | 82 | 139 | 5800 |
| HE21564020 | 212 | 82 | 95 | 5200 |
| HE23353029 | 142 | 72 | 25 | 2000 |
-
a
Rest frame flux of H in Å confidence level uncertainty.
-
b
Rest frame equivalent width of H in Å confidence level uncertainty.
-
c
Rest frame flux of the Feii4570 blend in units of erg s-1 cm-2.
-
d
FWHM of lines in the blend. See text for details.
-
e
Rest frame flux of the Feii4570 blend estimated from the Feii5270 blend. See text for details.
| Object name | F(H)a | W(H)b | F([Oiii]5007)c | W([Oiii]5007)d |
|---|---|---|---|---|
| (1) | (2) | (3) | (4) | (5) |
| HE00352853 | 4.0 | 2.1 | 12.4 | 6.7 |
| HE00432300 | 12.0 | 4.1 | 27.8 | 10.1 |
| HE00583231 | 1.8 | 1.0 | 13.1 | 7.9 |
| HE01053006 | 0.3 | 0.4 | 1.2 | 1.8 |
| HE01093518 | 24.4 | 3.5 | 247.5 | 38.5 |
| HE01193325 | 0.8 | 0.7 | 1.6 | 1.6 |
| HE01424619 | 3.9 | 1.9 | 20.0 | 10.4 |
| HE02034627 | 1.0 | 0.5 | 8.3 | 4.2 |
| HE02053756 | 7.0 | 1.5 | 33.0 | 7.4 |
| HE02243826 | 1.0 | 0.0 | 3.0 | 1.9 |
| HE02295603 | 1.0 | 0.7 | 4.0 | 2.7 |
| HE02394809 | 2.8 | 1.1 | 7.2 | 2.9 |
| HE02483628 | 4.8 | 0.8 | 15.0 | 2.6 |
| HE02515550 | 5.6 | 1.1 | 49.0 | 10.3 |
| HE03495249 | 3.3 | 0.7 | 11.0 | 2.5 |
| HE03593959 | 4.3 | 2.3 | 0.8 | 0.4 |
| HE04354312 | 0.4 | 0.3 | 13.4 | 10.1 |
| HE04363709 | 1.5 | 0.9 | 3.2 | 2.1 |
| HE09401050 | 5.5 | 0.3 | 11.1 | 0.6 |
| HE10390724 | 5.0 | 2.7 | 26.2 | 15.5 |
| HE1120+0154 | 2.2 | 0.5 | 52.6 | 13.1 |
| HE13472457 | 5.0 | 1.2 | 3.0 | 5.8 |
| HE1348+0118 | 18.7 | 2.9 | 60.7 | 10.1 |
| HE1349+0007 | 2.6 | 1.5 | 9.4 | 6.1 |
| HE1409+0101 | 34.8 | 7.1 | 35.7 | 7.8 |
| HE14300041 | 2.0 | 1.2 | 2.0 | 1.2 |
| HE1505+0212 | 1.0 | 0.3 | 2.0 | 0.7 |
| HE21473212 | 2.0 | 1.1 | 1.8 | 1.1 |
| HE21564020 | 5.0 | 1.9 | 3.8 | 1.5 |
| HE23353029 | 4.0 | 2.0 | 19.0 | 10.2 |
-
a
Rest frame flux of H in units of 10-15 erg s-1 cm-2.
-
b
Rest frame equivalent width of H in Å.
-
c
Rest frame flux of [Oiii]5007 in units of 10-15 erg s-1 cm-2.
-
d
Rest frame equivalent width of the [Oiii]5007 line in Å.
| Source | FWZIa | FWHMa | A.I.c | Kurt.d | ||||
|---|---|---|---|---|---|---|---|---|
| (1) | (2) | (3) | (4) | (5) | (6) | (7) | (8) | (9) |
| HE0035-2853 | 23300 | 3600 | 7400 | 500 | 0.19 | 0.07 | 0.37 | 0.04 |
| HE0043-2300 | 25000 | 4500 | 4600 | 300 | -0.03 | 0.10 | 0.33 | 0.06 |
| HE0058-3231 | 25200 | 4400 | 5800 | 500 | 0.22 | 0.08 | 0.30 | 0.04 |
| HE0105-3006 | 20700 | 5000 | 5200 | 400 | 0.10 | 0.17 | 0.28 | 0.08 |
| HE0109-3518 | 24400 | 5900 | 4000 | 300 | -0.01 | 0.10 | 0.33 | 0.06 |
| HE0119-3325 | 25300 | 6800 | 4500 | 300 | 0.03 | 0.09 | 0.41 | 0.06 |
| HE0142-4619 | 26900 | 4200 | 3600 | 300 | 0.24 | 0.17 | 0.26 | 0.08 |
| HE0203-4627 | 27800 | 5100 | 7200 | 500 | 0.12 | 0.09 | 0.32 | 0.05 |
| HE0205-3756 | 20700 | 4400 | 4400 | 400 | 0.41 | 0.06 | 0.16 | 0.03 |
| HE0224-3826 | 20800 | 2900 | 6500 | 400 | 0.10 | 0.07 | 0.40 | 0.05 |
| HE0229-5603 | 26500 | 6300 | 4000 | 300 | 0.03 | 0.10 | 0.31 | 0.06 |
| HE0239-4809 | 19700 | 3900 | 4700 | 400 | 0.19 | 0.14 | 0.27 | 0.06 |
| HE0248-3628 | 22200 | 4400 | 3900 | 300 | -0.19 | 0.10 | 0.30 | 0.05 |
| HE0251-5550 | 25700 | 4400 | 4500 | 400 | 0.47 | 0.07 | 0.19 | 0.03 |
| HE0349-5249 | 26500 | 4000 | 5900 | 800 | 0.37 | 0.07 | 0.27 | 0.04 |
| HE0359-3959 | 18500 | 4800 | 4300 | 400 | -0.15 | 0.09 | 0.30 | 0.05 |
| HE0435-4312 | 25300 | 6100 | 5500 | 300 | 0.08 | 0.14 | 0.38 | 0.08 |
| HE0436-3709 | 26700 | 4300 | 6600 | 500 | 0.26 | 0.09 | 0.32 | 0.05 |
| HE0940-1050 | 15400 | 1400 | 3500 | 200 | 0.53 | 0.04 | 0.22 | 0.02 |
| HE1039-0724 | 22900 | 3300 | 11300 | 500 | 0.63 | 0.04 | 0.48 | 0.03 |
| HE1120+0154 | 25800 | 4300 | 6900 | 500 | 0.33 | 0.07 | 0.35 | 0.04 |
| HE1347-2457 | 24700 | 3600 | 6800 | 500 | 0.20 | 0.09 | 0.31 | 0.05 |
| HE1348+0118 | 23600 | 4400 | 3700 | 200 | 0.08 | 0.15 | 0.38 | 0.08 |
| HE1349+0007 | 23400 | 3500 | 6200 | 400 | 0.27 | 0.10 | 0.34 | 0.06 |
| HE1409+0101 | 21600 | 4600 | 8300 | 900 | 0.48 | 0.07 | 0.28 | 0.03 |
| HE1430-0041 | 19100 | 3600 | 4700 | 300 | -0.05 | 0.10 | 0.33 | 0.06 |
| HE1505+0212 | 18400 | 2300 | 5200 | 200 | -0.02 | 0.25 | 0.37 | 0.11 |
| HE2147-3212 | 25900 | 3900 | 5800 | 400 | 0.01 | 0.10 | 0.33 | 0.05 |
| HE2156-4020 | 26200 | 4400 | 5000 | 500 | 0.27 | 0.10 | 0.26 | 0.05 |
| HE2335-3029 | 18100 | 4000 | 3100 | 200 | 0.04 | 0.11 | 0.38 | 0.07 |
-
a
In units of km s-1.
-
b
2 confidence level uncertainty.
-
c
Asymmetry index defined as in Marziani et al. (1996).
-
d
Kurtosis parameter as in Marziani et al. (1996).
| Source | c(0/4)a | c(1/4)a | c(1/2)a | c(3/4)a | c(0.9)a | |||||
|---|---|---|---|---|---|---|---|---|---|---|
| (1) | (2) | (3) | (4) | (5) | (6) | (7) | (8) | (9) | (10) | (11) |
| HE0035-2853 | 3100 | 1800 | 1900 | 400 | 930 | 270 | 490 | 200 | 370 | 130 |
| HE0043-2300 | 100 | 2200 | 100 | 400 | 130 | 160 | 130 | 120 | 130 | 80 |
| HE0058-3231 | 3500 | 2200 | 2500 | 500 | 1010 | 240 | 710 | 150 | 640 | 100 |
| HE0105-3006 | 2900 | 2500 | 1000 | 1000 | 290 | 180 | 250 | 140 | 240 | 90 |
| HE0109-3518 | 400 | 3000 | 0 | 300 | 40 | 140 | 40 | 110 | 40 | 70 |
| HE0119-3325 | 800 | 3400 | 100 | 300 | 40 | 130 | 30 | 120 | 20 | 80 |
| HE0142-4619 | 1300 | 3400 | 100 | 300 | 40 | 130 | 30 | 120 | 20 | 80 |
| HE0203-4627 | -300 | 2100 | 1000 | 800 | 200 | 150 | 110 | 100 | 90 | 60 |
| HE0205-3756 | 2900 | 2200 | 2600 | 500 | 580 | 220 | 80 | 110 | 10 | 60 |
| HE0224-3826 | 3400 | 1500 | 1100 | 400 | 650 | 200 | 400 | 180 | 300 | 120 |
| HE0229-5603 | 1500 | 3200 | -100 | 300 | -110 | 150 | -110 | 110 | -110 | 60 |
| HE0239-4809 | -100 | 2000 | 200 | 600 | -330 | 180 | -330 | 130 | -310 | 70 |
| HE0248-3628 | 500 | 2200 | -400 | 400 | 10 | 160 | 130 | 110 | 150 | 60 |
| HE0251-5550 | 2900 | 2200 | 2900 | 600 | 90 | 200 | -60 | 120 | -90 | 70 |
| HE0349-5249 | 2700 | 2000 | 2200 | 500 | 640 | 420 | 100 | 150 | 20 | 90 |
| HE0359-3959 | -700 | 2400 | -800 | 400 | -320 | 180 | -140 | 120 | -90 | 70 |
| HE0435-4312 | 2700 | 3100 | 400 | 600 | 100 | 160 | 50 | 150 | 40 | 100 |
| HE0436-3709 | 2600 | 2100 | 2100 | 600 | 570 | 240 | 310 | 180 | 240 | 120 |
| HE0940-1050 | 3200 | 700 | 2700 | 200 | 0 | 90 | 0 | 90 | 0 | 70 |
| HE1039-0724 | 2000 | 1600 | 1900 | 300 | 1270 | 250 | 140 | 830 | -1380 | 160 |
| HE1120+0154 | 2700 | 2200 | 1300 | 500 | 60 | 260 | -260 | 190 | -350 | 120 |
| HE1347-2457 | 2400 | 1800 | 0 | 600 | -390 | 270 | -570 | 190 | -610 | 110 |
| HE1348+0118 | 3400 | 2200 | 300 | 400 | 70 | 110 | 30 | 100 | 30 | 70 |
| HE1349+0007 | 3000 | 1700 | 1400 | 700 | 180 | 200 | -10 | 170 | -60 | 110 |
| HE1409+0101 | 800 | 2300 | 1600 | 500 | 510 | 460 | -700 | 210 | -860 | 110 |
| HE1430-0041 | -400 | 1800 | 200 | 400 | 200 | 170 | 200 | 130 | 200 | 80 |
| HE1505+0212 | -800 | 1200 | 0 | 900 | -390 | 110 | -60 | 260 | 30 | 80 |
| HE2147-3212 | -1300 | 2000 | -100 | 500 | -70 | 210 | -70 | 160 | -70 | 100 |
| HE2156-4020 | 1700 | 2200 | 1600 | 500 | 390 | 250 | 150 | 130 | 100 | 80 |
| HE2335-3029 | 800 | 2000 | 100 | 300 | 10 | 90 | -10 | 80 | -10 | 60 |
-
a
In units of km s-1.
-
b
2 confidence level uncertainty.
| Object name | W(H)a | W(Feii4570)a | FWHM(Feii)b | F(H)/F(H)c | FWHM(H)d | He | He |
|---|---|---|---|---|---|---|---|
| (1) | (2) | (3) | (4) | (5) | (6) | (7) | (8) |
| A1 | 72 | 26 | 2700 | 1.00 | … | … | … |
| A2 | 65 | 49 | 3700 | 1.00 | … | … | … |
| B1 | 86 | 26 | 5200 | 0.27 | 4000 | … | … |
| B2 | 70 | 44 | 5000 | 0.32 | 4000 | … | … |
| A | 61 | 25 | 2700 | 1.00 | … | … | … |
| M | 67 | 35 | 3800 | 1.00 | … | … | … |
| MB | 86 | 31 | 5000 | 0.27 | 4100 | … | … |
| 43A | 91 | 36 | 3000 | 1.00 | … | 6.1 | -0.74 |
| 44A | 69 | 38 | 2600 | 1.00 | … | 6.8 | -0.47 |
| 45A | 86 | 43 | 2800 | 1.00 | … | 7.8 | -0.43 |
| 46A | 80 | 47 | 3000 | 1.00 | … | 8.6 | -0.26 |
| 47A | 68 | 30 | 3000 | 1.00 | … | 9.6 | -0.20 |
| 48A | 60 | 27 | 3800 | 1.00 | … | 10.3 | +0.11 |
| 43B | 130 | 8 | …f | 0.59 | 4600 | 7.1 | -0.68 |
| 44B | 125 | 38 | 5600 | 0.49 | 4700 | 7.7 | -1.37 |
| 45B | 111 | 29 | 4900 | 0.35 | 4400 | 8.4 | -0.98 |
| 46B | 93 | 22 | 5900 | 0.37 | 4800 | 9.1 | -0.73 |
| 47B | 92 | 38 | 4900 | 0.27 | 4000 | 9.6 | -0.24 |
| 48B | 75 | 12 | 4600 | 0.23 | 4300 | 10.3 | +0.03 |
-
a
Equivalent width of H (H+ H) and Feii4570in Å confidence level uncertainty. Note that those values have been computed on median spectra with flux normalized to unity at Å. Considering that the continuum shape is not flat, but that there is however little dispersion in continuum shape across the median spectra, it is W(H) I(H)/1.1, and W(Feii4570)I(Feii4570)/1.25 Å.
-
b
FWHM of lines in the blend in units of km s-1 computed by specfit as for the individual sources. Uncertainty is at confidence level. See text for details.
-
c
Intensity ratio of the H to total H line emission i.e., H and H.
-
d
FWHM of the H component i.e., after removing H.
-
e
Logarithm of , in solar masses, and of . Values have been computed following Paper II, using the FWHM(H) reported in Col. (6), and assuming the average bin luminsosity. Values are therefore only indicative. No or has been computed for median in spectral types since they are normalized median spectra made regardless of their luminosity.
-
e
Feiiopt too faint for FWHM to be meaningfully constrained.
| Source | FWZIa | FWHMa | A.I.c | Kurt.d | ||||
|---|---|---|---|---|---|---|---|---|
| (1) | (2) | (3) | (4) | (5) | (6) | (7) | (8) | (9) |
| A1 | 35000 | 14000 | 3500 | 300 | 0.01 | 0.10 | 0.33 | 0.06 |
| A2 | 41100 | 16000 | 4100 | 300 | 0.05 | 0.10 | 0.33 | 0.06 |
| B1 | 34700 | 6000 | 5900 | 600 | 0.37 | 0.10 | 0.25 | 0.04 |
| B2 | 29200 | 5000 | 5700 | 500 | 0.26 | 0.09 | 0.29 | 0.05 |
| A | 37100 | 15000 | 3700 | 300 | 0.02 | 0.10 | 0.33 | 0.06 |
| M | 43700 | 17000 | 4400 | 300 | 0.01 | 0.10 | 0.33 | 0.06 |
| BM | 34400 | 6000 | 6300 | 700 | 0.35 | 0.09 | 0.25 | 0.04 |
| 43A | 19800 | 8000 | 2000 | 100 | -0.05 | 0.11 | 0.33 | 0.07 |
| 44A | 20700 | 8000 | 2100 | 100 | -0.07 | 0.11 | 0.33 | 0.07 |
| 45A | 27300 | 11000 | 2700 | 200 | -0.01 | 0.10 | 0.33 | 0.06 |
| 46A | 31000 | 12000 | 3100 | 200 | -0.04 | 0.10 | 0.33 | 0.06 |
| 47A | 40000 | 16000 | 4000 | 300 | 0.01 | 0.10 | 0.33 | 0.06 |
| 48A | 40900 | 16000 | 4100 | 300 | 0.05 | 0.10 | 0.33 | 0.06 |
| 43B | 27900 | 6400 | 5200 | 300 | 0.06 | 0.09 | 0.41 | 0.05 |
| 44B | 31600 | 6600 | 5700 | 300 | 0.07 | 0.11 | 0.39 | 0.06 |
| 45B | 34800 | 6400 | 6000 | 400 | 0.20 | 0.13 | 0.30 | 0.06 |
| 46B | 32900 | 5900 | 6500 | 500 | 0.22 | 0.10 | 0.31 | 0.05 |
| 47B | 36900 | 6400 | 5900 | 500 | 0.29 | 0.11 | 0.25 | 0.05 |
| 48B | 29400 | 4600 | 9300 | 900 | 0.44 | 0.06 | 0.29 | 0.03 |
-
a
In units of km s-1.
-
b
2 confidence level uncertainty.
-
c
Asymmetry index defined as in Marziani et al. (1996).
-
d
Kurtosis parameter as in Marziani et al. (1996).
| Source | c(0/4)a | c(1/4)a | c(1/2)a | c(3/4)a | c(0.9)a | |||||
|---|---|---|---|---|---|---|---|---|---|---|
| (1) | (2) | (3) | (4) | (5) | (6) | (7) | (8) | (9) | (10) | (11) |
| A1 | 0 | 6900 | 0 | 300 | -30 | 130 | -30 | 100 | -30 | 60 |
| A2 | -100 | 8200 | -200 | 300 | -170 | 150 | -170 | 110 | -170 | 70 |
| B1 | 2400 | 3000 | 2100 | 700 | 130 | 280 | -130 | 150 | -170 | 100 |
| B2 | 2200 | 2600 | 1700 | 600 | 380 | 230 | 170 | 150 | 130 | 100 |
| A | -100 | 7400 | -100 | 300 | -70 | 130 | -70 | 100 | -70 | 60 |
| M | 0 | 8700 | 0 | 400 | -40 | 160 | -40 | 120 | -40 | 70 |
| BM | 2400 | 2900 | 2200 | 700 | 270 | 330 | -60 | 160 | -120 | 100 |
| 43A | 100 | 3900 | 100 | 200 | 90 | 70 | 90 | 50 | 90 | 30 |
| 44A | 200 | 4100 | 100 | 200 | 130 | 70 | 130 | 60 | 130 | 40 |
| 45A | 0 | 5400 | 0 | 200 | 30 | 100 | 30 | 80 | 30 | 50 |
| 46A | 100 | 6200 | 100 | 300 | 120 | 110 | 120 | 90 | 110 | 50 |
| 47A | 0 | 7900 | 0 | 300 | -20 | 140 | -20 | 110 | -20 | 70 |
| 48A | -100 | 8100 | -200 | 300 | -170 | 150 | -170 | 110 | -170 | 70 |
| 43B | 2100 | 3200 | 200 | 300 | 40 | 150 | 0 | 140 | -10 | 100 |
| 44B | 1200 | 3300 | 200 | 500 | 10 | 170 | -30 | 150 | -40 | 100 |
| 45B | 1700 | 3200 | 1200 | 800 | 140 | 210 | 40 | 160 | 20 | 100 |
| 46B | 2400 | 3000 | 1600 | 700 | 370 | 230 | 190 | 170 | 150 | 110 |
| 47B | 2100 | 3200 | 2000 | 800 | 220 | 260 | 30 | 160 | 0 | 100 |
| 48B | 3100 | 2300 | 2700 | 400 | 1550 | 440 | -20 | 240 | -230 | 120 |
-
a
In units of km s-1.
-
b
2 confidence level uncertainty.