Phase and frequency noise metrology
web page http://rubiola.org
![[Uncaptioned image]](/html/0812.0180/assets/x1.png)
FEMTO-ST Institute
CNRS and Université de Franche Comté, Besançon, France
Abstract
As a consequence of a general trend in the physics of oscillators and clocks towards optics, phase and frequency metrology is rapidly moving to optics too. Yet, optics is not replacing the traditional radio-frequency (RF) and microwave domains. Instead, it adds tough challenges.
Precision frequency-stability measurements are chiefly based on the measurement of phase noise, which is the main focus of this article. Major progress has been achieved in two main areas. The first is the extreme low-noise measurements, based on the bridge (interferometric) method [ITW98, RGG99] in real time or with sophisticated correlation and averaging techniques [RG00, RG02]. The second is the emerging field of microwave photonics, which combines optics and RF/microwaves. This includes the femtosecond laser, the two-way fiber links [FHH+07], the noise measurement systems based on the fiber [VCT+08] and the photonic oscillator [YM96, YDM00]. Besides, the phenomenology of flicker () noise is better understood, though the ultimate reasons are still elusive.
1 A quick look to high-sensitivity measuements
clean-spectrum
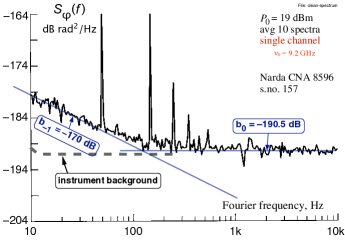
Before getting through the basic principles, let us look at the phase noise spectrum of Figure 1, approximated with the power-law . The device under test is a microwave circulator with the output taken at the isolation port. Isolation results from the destructive interference between two counter-propagating modes in the ferrite bulk. This configuration is the same used in the well known Pound oscillator [Pou46]. The experimentalist familiar with phase noise should notice the following unusual facts.
-
1.
The low noise of the DUT, , measured without need of correlation.
-
2.
The low background noise, .
-
3.
The low level of the residual of the mains, 50 Hz and odd multiples. The even-order harmonics are so small that they are not visible.
-
4.
The smoothness of the plot, achieved with a small number of averaged samples ().
The background noise deserves more attention. The conversion between spectrum and Allan variance, which is a simple mathematical process, can be done with to any physical quantity. The formula applies to flicker .
mechanical-stability
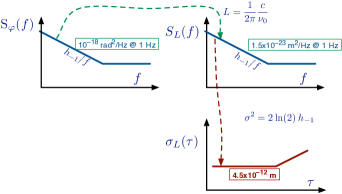
Therefore, after converting the phase spectrum into a length-fluctuation spectrum , the Allan deviation is m (Fig. 2). This high stability requires to re-think the mechanical design of electronics. That said, a resolution of parts in m is common in the field of tunnel and atomic-force microscopy [Sar94]. Also the femtosecond laser owes its success to the unexpected mechanical stability of the optical assembly.
2 Bridge measurements
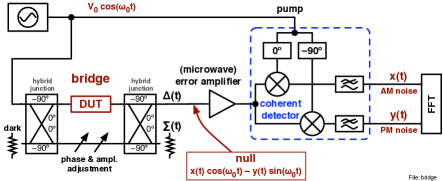
The instrument, shown in Fig. 3, is based on the carrier suppression by sum of an equal and opposite signal. The null contains only the noise sidebands of the DUT, which are amplified and down-converted to dc by coherent detection [Vit66]. The in-phase signal is proportional to the normalized-amplitude noise (AM noise) , the quadrature signal to the PM noise
bridge
The following ideas makes this scheme a fortunate choice.
-
1.
The noise of the passive components the bridge is made of is dramatically reduced by separating coarse and fine the adjustment of the null. The coarse adjustment relies on by-step and fixed-value components. The fine adjustment, though more noisy because of the contact fluctuations, has low weight.
-
2.
Close-in flicker results from up-conversion of the near-dc noise pumped by the carrier (cf. Sec. 5). Here the error amplifier sees only the fluctuation of the null. Power is too low for the up-conversion process.
-
3.
The noise floor is improved significantly by microwave amplification of the noise sidebands before the mixer loss.
-
4.
Microwave amplification of the noise sidebands before detecting reduces the residuals of the mains because the dc electronics is highly sensitive to these fields, the microwave section is not.
-
5.
The in-phase/quadrature detection is a fully-linear Cartesian process. The dc component of and can be used to control the null in closed loop. This is recommended when the experiment lasts more than some half an hour.
The bridge has been used successfully to measure the flicker of ferrites [RG02, RGG04, WIT98] ( , either HF/VHF and microwave carrier) and photodetectors [RSYM06] ( , 10 GHz modulation). These measurements are out of reach for other methods, the first because of the extremely low noise, the second because of the low microwave power (order of 10 W).
The photodetector noise is relevant in OEOs (Sect. 6) and in optical-fiber links [FHH+07]. In the link, the detector noise can not be removed with the two-way method. The value at 10 GHz sets the stability limit to s (Allan deviation). In the same condition the fractional-frequency stability of frequency transfer is , not far from the performance of short-range links. This is seen using and converting into Allan deviation.
3 Correlation measurements
Two equal instruments measure the same DUT, as shown in Fig. 4. This figure also introduce the main symbols. Notice that and are not the same thing as in Sec. 2.
correlation-scheme
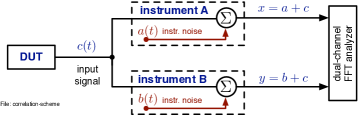
We denote the Fourier transform with the uppercase of the time-domain function, the complex conjugate with , and the average of samples with . Thanks to the Wiener-Kinchine theorem, the cross-spectrum is . Hence
| (1) | ||||
| (2) |
Thus, converges to the spectrum of the DUT, with a residual random term of the order of .
In the laboratory practice, it is often convenient to display because it is the minimally-biased always-positive estimator, assuming that is real. With white noise we use the ergodicity principle to access the ensemble (a part of) by sweeping the frequency. Thus we have access to the average and to the standard deviation of . With small , the single-channel noise is still not rejected. This means that the term is larger than the DUT noise. In this condition, the deviation of is almost equal to the average. In logarithmic scale, the spectrum looks as a band of constant thickness that moves downwards on the analyzer display. Increasing , the term becomes lower than the DUT noise. Thus, the deviation becomes smaller than the average. The track attains a constant value and shrinks.
correlation-m-law
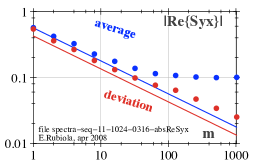
This is shown in Fig. 5, where for the deviation of becomes significantly lower than the average.
Interestingly, the fact that the deviation/average ratio that decreases for larger than a threshold validates the measurement mathematically, without need of checking on the instrument background.
sphi-spectra
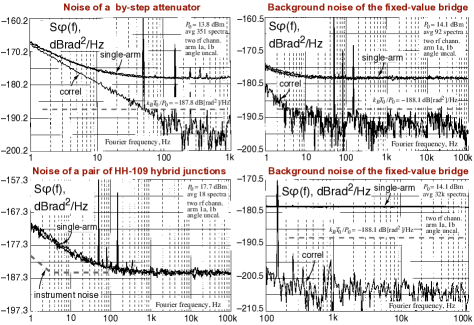
Correlation is an old idea [HJD52, VMV64, WSGG76], which could be used routinely in phase noise measurements only with the FFT analyzer [Wal92]. The use of correlation on a bridge instrument enables the measurement of some devices that could not be measured before [RG02]. Figure 6 shows some examples.
4 Measurement of AM noise and RIN spectra
rin
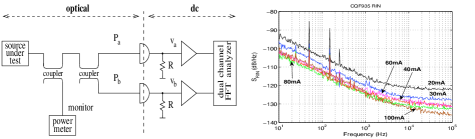
In the case of PM noise, the single-channel background is usually measured by removing the DUT and by replacing it with a short cable, which is virtually noise free. In the case of AM noise and RIN, the DUT can not be removed because the DUT is the only source of signal. Thus, the validation of the instrument requires a reference of suitably low amplitude noise, which is not available in general. Correlation solves the problem because the convergence of the spectrum to the DUT noise can be assessed mathematically through the deviation/average ratio, as explained in Sec. 3. Figure 7 shows an example of laser RIN measurement.
5 Flicker in electronic and optical devices
Though the ultimate reasons for the noise are still elusive, the mechanism of the close-to-the-carrier flicker in RF/microwave devices is simple. Understanding it starts from the simple observation that
-
•
near-dc flicker exists per se, though often made in accessible by an output filter.
-
•
the output spectrum is white in the microwave band,
-
•
close-in noise appears only in the presence of a carrier.
noise-upconversion
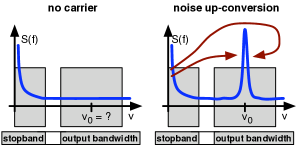
The reason is that close-in noise is brought from dc to the vicinity of the carrier by parametric modulation, which at first approximation is linear (Fig. 8). This simple model accounts for the following experimental facts about the noise spectra[Rub08, Chap. 2].
-
•
The noise is about independent of the carrier power.
-
•
The noise of cascaded devices is the sum of the individual spectra, regardless of the order in which the devices are chained.
-
•
When equal devices are connected in parallel, the noise is that of one device divided by the number of devices.
The typical value of the flicker parameter in amplifiers is of for bipolar RF units, of for SiGe microwave units, and of for HBT microwave units; and of for high-speed photodetectors.
6 Noise in OEOs
The opto-electronic oscillator (OEO) is an appealing alternative for high spectral purity microwave oscillators [YM96, YDM00].
oeo-scheme
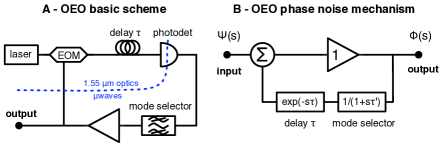
Figure 9 shows the basic scheme of an optical-fiber OEO and its phase noise model[Rub08, Chap. 5]. Microwave oscillation can take place at any frequency multiple of . A bandpass filter is necessary to select a single frequency. In Fig. 9 B all the signals are the Laplace transform of the phase fluctuation of the microwave signal or modulation. Non-linearity necessary in real oscillator for the power not to decay or diverge. Using amplitude and phase as the base representation, all the non-linearity goes in the amplitude, the phase is linear. The underlying physical fact is that time can not be stretched111This may not be true in the presence of strong non-linearity.. As a relevant consequence, phase noise is additive. This eliminates the difficulty inherent in the parametric nature of some noise processes, like flicker. The input is the phase noise of all the oscillator components. The output is the phase noise at the oscillator output. The amplifier gain is exactly equal to one because the amplifier repeats the phase of the input. Elementary feedback theory yields to the phase-noise transfer function , where represents the delay and the low-pass equivalent of the mode selector. The function is an extension of the Leeson model [Lee66].
oeo-spectra
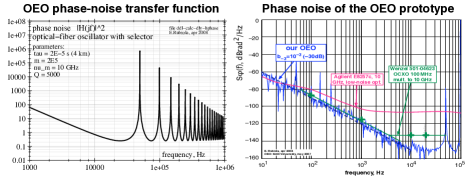
Figure 10 shows an example of transfer function and of phase noise spectrum with 4 km optical fiber, i.e., with a delay of 20 s. The peaks of at (50 kHz, 100 kHz, etc.) are due to the contiguous microwaves modes kept below the oscillation threshold by the mode selector. The spectrum is measured with two delay lines used as the frequency discriminator, taking the average cross-spectrum to enhance the sensitivity [VCT+08]. The noise is no more than 2 dB higher than the theoretical value, evaluated by putting the noise of the electronics in the Leeson formula. The phase noise (frequency flicker) is equivalent to the Allan deviation .
References
- [FHH+07] Seth M. Foreman, Kevin W. Holman, Darren D. Hudson, David J. Jones, and Jun Ye, Remote transfer of ultrastable frequency references via ?ber networks, Rev. Sci. Instrum. 78 (2007), no. 2, 021101 1–25, Invited article.
- [HJD52] R. Hanbury Brown, R. C. Jennison, and M. K. Das Gupta, Apparent angular sizes of discrete radio sources, Nature 170 (1952), no. 4338, 1061–1063.
- [ITW98] Eugene N. Ivanov, Michael E. Tobar, and Richard A. Woode, Microwave interferometry: Application to precision measurements and noise reduction techniques, IEEE Trans. Ultras. Ferroelec. and Freq. Contr. 45 (1998), no. 11, 1526–1535.
- [Lee66] David B. Leeson, A simple model of feed back oscillator noise spectrum, Proc. IEEE 54 (1966), 329–330.
- [Pou46] Robert V. Pound, Electronic frequency stabilization of microwave oscillators, Rev. Sci. Instrum. 17 (1946), no. 11, 490–505.
- [RG00] Enrico Rubiola and Vincent Giordano, Correlation-based phase noise measurements, Rev. Sci. Instrum. 71 (2000), no. 8, 3085–3091.
- [RG02] , Advanced interferometric phase and amplitude noise measurements, Rev. Sci. Instrum. 73 (2002), no. 6, 2445–2457, Also on the web site arxiv.org, document arXiv:physics/0503015v1.
- [RGG99] Enrico Rubiola, Vincent Giordano, and Jacques Groslambert, Very high frequency and microwave interferometric PM and AM noise measurements, Rev. Sci. Instrum. 70 (1999), no. 1, 220–225.
- [RGG04] Enrico Rubiola, Yannick Gruson, and Vincent Giordano, On the flicker noise of circulators for ultra-stable oscillators, IEEE Trans. Ultras. Ferroelec. and Freq. Contr. 51 (2004), no. 8, 957–963.
- [RSYM06] Enrico Rubiola, Ertan Salik, Nan Yu, and Lute Maleki, Flicker noise in high-speed p-i-n photodiodes, IEEE Trans. Microw. Theory Tech. 54 (2006), no. 2, 816–820, Preprint available on arxiv.org, document arXiv:physics/0503022v1, March 2005.
- [Rub08] Enrico Rubiola, Phase noise and frequency stability in oscillators, Cambridge University Press, Cambridge, UK, November 2008.
- [Sar94] Dror Sarid, Scanning force microscopy, Oxford, 1994.
- [VCT+08] Kirill Volyanskiy, Johann Cussey, Hervé Tavernier, Patrice Salzenstein, Gérard Sauvage, Laurent Larger, and Enrico Rubiola, Applications of the optical fiber to the generation and to the measurement of low-phase-noise microwave signals, J. Opt. Soc. Am. B - Opt. Phys. 25 (2008), 2140–2150, Also arXiv:0807.3494v1 [physics.optics].
- [Vit66] Andrew J. Viterbi, Principles of coherent communication, McGraw Hill, New York, 1966.
- [VMV64] R. F. C. Vessot, R. F. Mueller, and J. Vanier, A cross-correlation technique for measuring the short-term properties of stable oscillators, Proc. IEEE-NASA Symposium on Short Term Frequency Stability (Greenbelt, MD, USA), November 23-24 1964, pp. 111–118.
- [Wal92] W. F. Walls, Cross-correlation phase noise measurements, Proc. Freq. Control Symp. (Hershey, PA), IEEE, New York, 1992, May 27-29 1992, pp. 257–261.
- [WIT98] Richard A. Woode, Eugene N. Ivanov, and Michael E. Tobar, Application of the interferometric noise measurement technique for the study of intrinsic fluctuations in microwave isolators, Meas. Sci. Technol. 9 (1998), no. 9, 1593–1599.
- [WSGG76] F. L. Walls, S. R. Stain, J. E. Gray, and D. J. Glaze, Design considerations in state-of-the-art signal processing and phase noise measurement systems, Proc. Freq. Control Symp. (Atlantic City, NJ, USA), June 2-4 1976, pp. 269–274.
- [YDM00] X. Steve Yao, L. Davis, and Lute Maleki, Coupled optoelectronic oscillators for generating both RF signal and optical pulses, J. Ligtwave Technol. 18 (2000), no. 1, 73–78.
- [YM96] X. Steve Yao and Lute Maleki, Optoelectronic microwave oscillator, J. Opt. Soc. Am. B - Opt. Phys. 13 (1996), no. 8, 1725–1735.