Detection of Vibrationally Excited CO in IRC10216
Abstract
Using the Submillimeter Array we have detected the and rotational transitions from within the first vibrationally excited state of CO toward the extreme carbon star IRC+10216 (CW Leo). The emission remains spatially unresolved with an angular resolution of and, given that the lines originate from energy levels that are K above the ground state, almost certainly originates from a much smaller ( cm) sized region close to the stellar photosphere. Thermal excitation of the lines requires a gas density of cm-3, about an order of magnitude higher than the expected gas density based previous infrared observations and models of the inner dust shell of IRC+10216.
Subject headings:
stars: individual (IRC10216 (catalog )) — stars: late-type — circumstellar matter — submillimeter — masers — radio lines: stars1. Introduction
Emission from a rotational line from within a vibrationally excited state of a molecule was first accidentally discovered by Snyder and Buhl (1974), who discovered very strong maser emission from vibrationally excited SiO toward the Orion Kleinmann-Low star-forming region. Over the three past decades, SiO maser emission in the rotational line from the v = 1 and 2 states (and the v = 1, line) was found to be a ubiquitous attribute of oxygen-rich mass-losing long period variable stars (e.g., Messineo et al. 2002 and Deguchi 2007).
Following the first detections of vibrationally excited SiO maser emission, it was immediately conjectured that similar emission—perhaps even more intense—might be observable from the far more abundant, spectroscopically similar CO molecule. Fairly soon, Scoville and Solomon (1978) detected a line in the carbon-rich, very high mass-los AGB object IRC+10216 at exactly the frequency of the CO J = 1–0 transition in the first excited v = 1 vibrational state. This quite plausible assignment however fell through when it was shown that the line in question was produced not by CO, but by the C4H radical, one of the more abundant molecules in IRC+10216 (Cummins et al. 1980; Guélin et al. 1978). In the intervening 30 years, no credible claim of vibrationally excited CO in the radio spectrum of this evolved carbon star has appeared. This apparent difference between SiO and CO has yet to be explained.
The recent discovery with the Submillimeter Array111The Submillimeter Array is a joint project between the Smithsonian Astrophysical Observatory and the Academia Sinica Institute of Astronomy and Astrophysics, and is funded by the Smithsonian Institution and the Academia Sinica. (SMA, Ho et al. 2004) in IRC+10216 of vibrationally excited rotational lines from several molecules (Patel et al. 2008) has reopened the question of vibrationally excited radio lines and led — we show here — to the discovery of vibrationally excited CO in two rotational transitions. The new data are summarized in Figures 1 and 2 and Table 1. There can be little doubt that the assignment is correct, because the probability of a chance coincidence of unrelated lines is significantly less than . A confirming transition, at 685.18 GHz is accessible to the SMA, but requires low atmospheric opacity to observe.
2. Observations and Data reduction
IRC10216 was observed with the SMA as part of a spectral-line survey in the 300–350 GHz (m) band (Patel et al. 2008). The CO v=1, J=3–2 line was detected from observations carried out on 2007 Feb 12, with a center frequency of 344.4 GHz in the upper sideband. The array was in the so-called subcompact configuration, with baselines from 9.5 m to 69.1 m. The zenith optical depth at the radiometer monitoring frequency of 225 GHz () was about 0.05 and the double sideband system temperature () varied from 130 to 260 K. Follow up observations to confirm the identification by detecting the J=2–1 vibrationally excited line, were done on 2008 June 5, with the SMA in the ‘extended’ configuration, at baselines from 16.4 to 139.2 m. Tsys varied from 70 to 250 K. These observations were done during the day with varying from 0.1 to 0.2. Pointing offsets were measured three times during the observations by observing Mars and 3C273. The receivers were tuned to 228.4 GHz in the upper sideband. The phase center was for all the observations. Complex gain calibration was done using the quasars 0851+202 and 1055+018; the total observing time was about 8 hours. The spectral band-pass calibration was determined from observations of Mars and Jupiter for the 2007 Feb 12 observations, and 3C279 for those on 2008 June 5. Absolute flux calibration was obtained from observations of Callisto. The quasars 0851+202 and 1055+018 were observed every 20 minutes for complex gain calibration. The frequency resolution was 0.81 MHz and 0.4 MHz for the 2007 Feb 12 and 2008 June 5 observations, respectively. The spectra shown here are smoothed to an effective velocity resolution of 1 km s-1.
The visibility data were calibrated using a standard package (Miriad) for reduction of interferometric observations (Sault, Teuben & Wright 1995). The synthesized beam was on 2007 Feb 12 and on 2007 June 5. Visibilities were corrected for the position offset of ( from the phase center position, determined from the peak of continuum emission (Patel et al. 2008). All the spectra here were produced by spatially integrating the continuum-subtracted line intensity in a rectangle centered on the peak continuum emission.
3. Results
Figure 1 shows the CO v = 1, and spectra toward IRC+10216. The dashed line indicates the systemic velocity of km s-1(Olofsson et al. 1982). Both lines are slightly blue-shifted by 1–2 km s-1relative to the star. The spectra were produced by integrating the continuum-subtracted line intensity in a rectangle centered on the continuum peak. An unrelated line at 11 km s-1which appears in the the top panel of Fig. 1 is probably CC34S 8(7)–5(6) at a rest frequency of 342629.24 MHz. That identification for this line is a plausible choice, since (much stronger) emission in multiple lines of the main isotopologue CCS have been identified in IRC+10216 previously (Cernicharo et al. 1987). The frequency of the CO v = 1, transition is very close to that of the line of the C4H radical (Cummins et al. 1980), making it difficult to pick out the vibrationally excited CO line in the 3 mm band with a single-dish telescope. The CO v = 1 line on the other hand, appears free from this confusion, although it may be blended with CH3C3N less than a MHz away (at km s-1 in the spectrum shown in Fig. 1) — a molecule however, not yet detected in IRC+10216 (Agundez et al. 2008).
Crucial confirmation of the present identification is provided by detection of the vibrationally excited J=2–1 line, which is free from confusion with other lines over a frequency interval of 2 MHz.

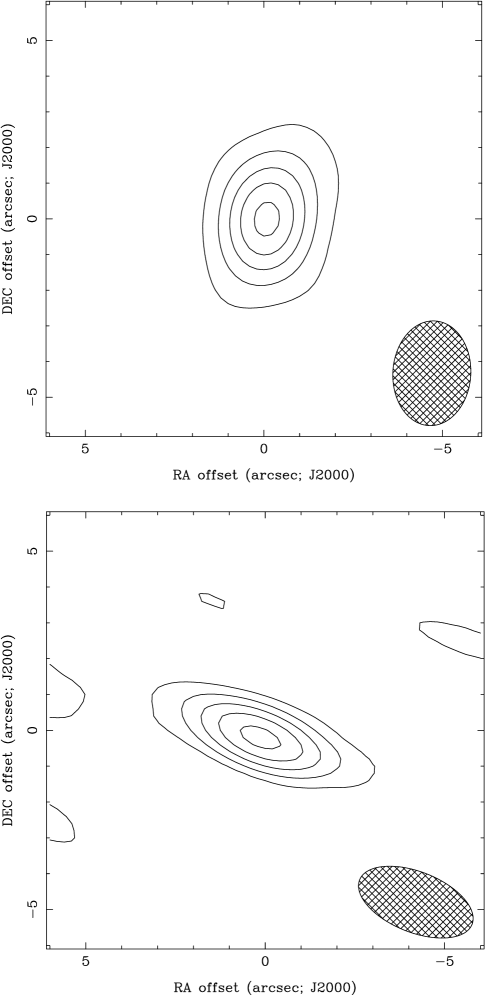
Maps of the integrated intensity of the CO v = 1, and emission are shown in Figure 2. The position offsets are with respect to the peak of the continuum emission quoted above. The centroid of the 3–2 and 2–1 line emission distribution is coincident with that of the continuum emission. Gaussian fitting and deconvolution with the IMFIT task of the Miriad package yields a size of with a P.A of for the emission and a point source for the emission. Visibilities plotted vs. distance for both lines do not show a tapering for large distance values, suggesting that both the lines are spatially unresolved. The apparent “resolution” of the emission distribution is thus almost certainly caused by broadening due to residual phase calibration errors.
4. Discussion
Consistent with the fitting results, maps of the v = 1 and CO emission (Figure 2) show very compact spatial distribution. The vibrationally excited CO emission is expected to occur very close to the star since the relevant energy levels are 3100 K above the ground state. The vibrationally excited CO lines have narrow line-widths implying V km s-1. Several such narrow lines have been detected from our on-going spectral-line survey of IRC+10216 (Patel et al. 2008) and some of these lines have been re-observed with the SMA at higher angular resolution of . For example, CS v=2 J=7–6 emission is spatially unresolved with a deconvolved source size . We assume in the present analysis that both the lines arise from the same region of radius , which corresponds to cm (for a distance of 150 pc). We note that this is comparable to the size of the inner radius of the dust shell in IRC+10216 deduced from interferometric IR observations by Danchi et al. (1994).
For a Gaussian source size of FWHM, from the observed flux density of the 342.6 and 228.4 GHz CO lines, we obtain a brightness temperature of 210 and 412 K, respectively. Assuming Local Thermodynamic Equilibrium (LTE), this would imply optical depth of 0.24 and 0.53, respectively, for the two lines. Danchi et al. (1994) measure the kinetic temperature of the dust shell to be 1356 K at this radius. Previous work by Sahai and Wannier (1985) uses a value of 600 K for the inner dust shell’s temperature (see also Toombs et al. 1972). We assume the temperature of the dust to be the same as that of gas, which we take to be 1000 K, also suggested by an extrapolation of the temperature vs. radius plot derived by Crosas and Menten (1997) from the analysis of multiple transitions of CO in the outer parts of the shell. With this temperature and with the further assumption of uniform optical depth in the line, using the Gaussian fitted line-widths and Einstein A coefficients for the and transitions in v = 1 state (from SLAIM), we derive the column densities in the v = 1 J=2 (J=1) levels to be () cm-2, where we have adapted the standard relation for column density, excitation temperature and optical depth for CO (see Eqn. 14.43 of Rohlfs and Wilson 2000). The total CO column density (CO) is obtained from above using the full partition function including vibrational and rotational levels (Townes and Schalow 1975), and an abundance value of [CO]/[H2]= (e.g., Sahai & Wannier 1985), we derive the H2 column density to be cm-2.
Taking the diameter of the emission region, , as cm we derive the gas density, (H(H), of cm-3. This is about an order of magnitude greater than the gas density obtained by Danchi et al. (1994) for IRC+10216’s inner dust shell.
These rough estimates suggest that collisional excitation under the LTE assumption is unlikely to explain our observations. To check whether the v = 1 levels may be excited via radiation, we use the condition: (Carrol and Goldsmith 1981; Menten et al. 2006a). We have s-1 (for the transition), s-1, Hz for 4.6 m and T=1000 K, we find the ratio of the A coefficients to be while the l. h. s. of the above expression has a value of 0.27, hence the v=1 levels are most likely radiatively excited. However, to attain such a high radiation temperature, the emission must arise from a region even smaller than .
Since the observations of the and lines were carried out at different phases of pulsation of IRC+10216 the relative intensities of these two lines may complicate their interpretation. We calculated the phase, , for the two epochs of our observations, , given by , using 664 d as the period, . For this we have calculated the time of the last maximum considering the IR minimum date of 1989 Dec 5 given by Danchi et al. (1994). We find for the 346 (228) GHz observations. These values of are in good agreement with values obtained using the date of maximum IR flux (at 3.76 m; Le Bertre 1992) on 1992 May 30 from cm- and IR-monitoring reported by Menten et al. (2006b). Thus it is plausible that the emission is brighter due to its being observed closer to the IR maximum, compared to our observations. Future observations at different epochs may help checking the radiative pumping hypothesis while near-simultaneous observations of different transitions in v = 1 state will be helpful for detailed radiative transfer modeling of these lines. While our present observations have inadequate angular resolution to definitively rule out maser action to explain the vibrationally excited CO lines, we note that even for a Gaussian source, the brightness temperature would be 1451 (738) K for the 228.4 (342.6) GHz emission, consistent with thermal emission. This would imply a gas density cm-3. We note that a strict lower limit to the size of the CO emission is given by recent observations by Menten et al. (2008) who derive a (uniform disk) diameter of 84 milli arcseconds (mas) for IRC+10216 radio photosphere from their Very Large Array measurements of the object’s 7 mm wavelength continuum emission.
Scoville and Solomon (1978) proposed that the rotational lines in v = 2 state are pumped by stellar IR photons at 2.3 m, followed by rapid spontaneous decay to the v = 1 state. Analogous to the Kwan and Scoville (1974) mechanism for the SiO maser emission in v = 1 state, the low rotational state populations of v = 1 state become inverted in the circumstellar region where the v = 12 optical depth is low and v=0 1 optical depth is high. There are differences for CO, however, owing to its high abundance with respect to SiO and low dipole moment. Deguchi and Iguchi (1976) proposed another mechanism for SiO maser pumping that may also apply to CO masers. According to their model, radiatively pumped v = 1 levels alone will invert the rotational populations if there is acceleration in the region producing large velocity gradients. Both these mechanisms require -independent trapping of the v v transitions and require the IR optical depth to be of the order of unity (Turner 1987). The slightly blue-shifted emission seen in both the lines is reminiscent of the observations by Turner (1987) of vibrationally excited SiS lines. He interpreted the latter as examples of weak masers amplifying the stellar radiation from the gas in the innermost expanded shell. While a systematic outflow will not have commenced inside the dust formation zone, the blueshifts might nevertheless reflect outward motions of gas levitated away from the star.
CO is so widespread in Galactic molecular gas, it would be surprising if more sources of vibrationally excited emission could not be detected. Oxygen containing molecules are not especially abundant in IRC+10216, except for CO, which ties up almost all of the oxygen. Therefore, oxygen-rich sources like the red supergiant VY CMa may turn out to be the best places to look. Toward this source very many vibrationally exited lines from SiO have been found from up to the 7000 K high v=4 state (Cernicharo et al. 1993) and from H2O from the bending mode (Menten & Young 1995, Menten et al. 2006a). Interesting in the context of our discussion is that the latter authors found one of the H2O lines they detected consistent with thermal excitation, while weak maser emission is suggested for the other. Interferometric studies of such objects are now clearly desirable. We have begun such a study with the SMA and have observed R Cas and Mira. The CO v=1 J=2–1 was not detected in either of these sources with an rms noise level of 0.1 Jy/beam.
5. Conclusions and Outlook
We have reported the first unambiguous detection of (sub)millimeter wavelength vibrationally excited CO lines in the and rotational transitions from v = 1 state toward IRC+10216. Thermal excitation of these levels requires extremely high gas densities and temperature, but the lines could be radiatively excited. Population inversion in the levels cannot be ruled out, but there is little evidence for it.
Observations of IRC+10216 with the eSMA222SMA combined with the James Clerk Maxwell Telescope and the Caltech Submillimeter Observatory in the near future will provide an improvement in angular resolution by nearly a factor of 10 over that here and will probe vibrationally excited emission with resolution. In the future, the Atacama Large Millimeter Array (ALMA) will have much higher angular resolution, up to 15 mas at 1 mm wavelength in its longest (15 km) baseline configuration. Enabled by the excellent brightness sensitivity afforded by it large collecting area, ALMA will be able to image the hot gas traced by vibrationally excited lines. It will thus allow detailed studies of the complex dynamics of the gas close to the stellar surface in which the circumstellar outflow has hardly started, and on whose molecular content now only line-of-sight averaged information from IR absorption spectroscopy can be obtained (see Sahai & Wannier 1985).
References
- Agundez et al. (2008) Agundez, M., Cernicharo, J., Pardo, J. et al. (2008) A&A, 479, 493
- Carroll and Goldsmith (1981) Carroll, T.J., & Goldsmith, P.F., 1981, ApJ, 245, 891
- Cernicharo et al. (1987) Cernicharo, J., Kahane, C., Guelin, M., & Hein, H. 1987, A&A, 181, L9
- Cernicharo et al. (1993) Cernicharo, J., Bujarrabal, V., & Santaren, J. L. 1993, ApJ, 407, L33
- Cernicharo et al. (2000) Cernicharo, J., Guelin, M. & Kahane, C. 2000, A&AS, 142, 181
- Crosas & Menten (1997) Crosas, M. & Menten, K.M., 1997, ApJ, 483, 913
- Cummins et al. (1980) Cummins, S.E., Morris, M., & Thaddeus, P., 1980, ApJ, 235, 886
- Danchi et al. (1994) Danchi, W. C., Bester, M., Degiacomi, C. G., Greenhill, L., Townes, C. H., 1994, AJ, 107, 1469
- Deguchi (2007) Deguchi, S. 2007, IAU Symposium, 242, 200
- Deguchi and Iguchi (1976) Deguchi, S., & Iguchi, T., 1976, PASJ, 28, 307
- Guélin et al. (1978) Guélin, M., Green, S., Thaddeus, P., 1978, ApJ, 224, L27
- Ho et al. (2004) Ho, P.T.P., Moran, J.M., Lo, K. Y., 2004, ApJ, 616, L1
- Habing (1996) Habing, H. J. 1996, A&A Rev., 7, 97
- Kwan and Scoville (1974) Kwan, J., & Scoville, N., 1974, ApJ, 194, L97
- Le Bertre (1992) Le Bertre, T., 1992, A&AS, 94, 377
- (16) Menten, K.M., Philipp, S.D., G’́usten, et al., 2006a, A&A, 454, 107
- Menten et al. (2006b) Menten, K.M., Reid, M.J., Krügel, E., Claussen, M.J. & Sahai, R., 2006b, A&A, 453, 301
- Menten et al. (2008) Menten, K.M., et al., 2008, in preperation
- Menten & Young (1995) Menten, K. M., & Young, K. 1995, ApJ, 450, L67
- Messineo et al. (2002) Messineo, M., Habing, H. J., Sjouwerman, L. O., Omont, A., & Menten, K. M. 2002, A&A, 393, 115
- Olofsson et al. (1982) Olofsson, H., Johansson, L.E.B., Hjalmarson, A., Rieu, N.-Q., 1982, A&A, 107,128
- Patel et al. (2008) Patel, N.A., Young, K.H., Bruenken, S., et al., 2008, ApJ, submitted
- Remijan et al. (2007) Remijan, A., Markwick-Kemper, A., ALMA Working Group on Spectral Line Frequencies, 2007, BAAS, 39, 963
- Rohlfs & Wilson (2000) Rohlfs, K., and Wilson, T.L., 2000, Tools of Radio Astronomy, Springer-Verlag, Berlin
- Sahai and Wannier (1985) Sahai, R., & Wannier, P.G., 1985, ApJ, 299, 424
- Sault, Teuben & Wright (1995) Sault, R.J, Teuben, P.& Wright, M.C.H., 1995, A Retrospective View of Miriad, in: Astronomical Data Analysis Software and Systems IV, ed. R. A. Shaw, et al.. PASP Conf. Series 77,433
- Scoville and Salomon (1978) Scoville, N. Z., & Solomon, P.M., 1978, ApJ, 220, L103
- Snyder and Buhl (1974) Snyder, L.E, and Buhl, D., 1974, ApJ, 189, L31
- Toombs et al., (1972) Toombs, R., Becklin, E., Frogel, J., et al., 1972, ApJ, 183, L71
- Townes & Schawlow (1975) Townes, C. H., & Schawlow, A. L., 1975, Microwave Spectroscopy, Dover Publications, New York
- Turner (1987) Turner, B.E., 1987, A&A, 183, L23
| Transition | Rest frequency11From the Spectral Line Atlas of Interstellar Molecules (c.f., Remijan et al. 2008). | Eu/k | Peak22These are 1 formal uncertainties from Gaussian fits. The actual uncertainty in absolute flux calibration is 15%. | Integrated | Velocity33Systemic velocity of the source km s-1. | Vexp44Half-width at half-maximum from Gaussian fits. |
|---|---|---|---|---|---|---|
| (MHz) | (K) | flux density | flux density | (km s-1) | (km s-1) | |
| (Jy) | (Jy km s-1) | |||||
| v = 1 | 342647.660.01 | 3116.6 | 0.710.05 | 3.760.19 | -27.030.26 | 3.790.06 |
| v = 1 | 228439.110.07 | 3100.1 | 0.620.04 | 2.230.23 | -27.860.21 | 3.580.67 |