Local spin and charge properties of -Ag0.33V2O5 studied by 51V-NMR
Abstract
Local spin and charge properties were studied on -Ag0.33V2O5, a pressure-induced superconductor, at ambient pressure using 51V-NMR and zero-field-resonance (ZFR) techniques. Three inequivalent Vi sites (i=1, 2, and 3) were identified from 51V-NMR spectra and the principal axes of the electric-field-gradient (EFG) tensor were determined in a metallic phase and the following charge-ordering phase. We found from the EFG analysis that the V1 sites are in a similar local environment to the V3 sites. This was also observed in ZFR spectra as pairs of signals closely located with each other. These results are well explained by a charge-sharing model where a 3d1 electron is shared within a rung in both V1-V3 and V2-V2 two-leg ladders.
pacs:
76.60.-k; 74.70.-bI INTRODUCTION
A family of -vanadium bronze, -A0.33V2O5 (A=Li,Na,Ag), has offered an attractive stage in strongly correlated electron systems because it exhibits various phases on pressure-temperature (P-T) phase diagram; a metallic phase at high temperatures, an charge-ordering (CO) phase followed by an antiferromagnetic (AF) phase at low temperatures,1-4 and pressure-induced superconductivity at pressures above 7GPa.5-8 The superconducting (SC) phase is adjacent to the CO phase at lower pressure region. The system is the first to exhibits superconductivity as a low dimensional vanadate. Superconductivity exhibits a bell-shaped dependence with an optimum of about 7K at 8GPa on the P-T phase diagram. The cations (A=Li,Na,Ag) occupy one of the two nearest-neighboring sites. The cation disorder-order transition occurs in the metallic phase.1,9,10 The cation-, charge-, and spin-ordering temperatures, , , and , respectively, are listed in Table I. As for -Ag0.33V2O5, , , and are 200, 90, and 27K, respectively.
| compound | V4+/V5+ | A | CO (K) | AF |
|---|---|---|---|---|
| -Li0.33V2O5 | 1/5 | - | 180 | 7 |
| -Na0.33V2O5 | 1/5 | 260 | 136 | 24 |
| -Ag0.33V2O5 | 1/5 | 200 | 90 | 27 |
| -Sr0.33V2O5 | 2/4 | RT | 170 | - |
Since the discovery of superconductivity, no further experiments have been performed other than P dependence of because of experimental difficulties under high pressures. There still remain two major problems; one is the pairing symmetry and the other is behaviors near the phase boundary. The detailed boundary has not still been fixed; one possibility is phase separation between the CO and SC phases, and the other is crossover between them. In relation to this problem, a novel mechanism such as a charge-fluctuation mediated mechanism has been proposed as the superconducting mechanism.13
Besides superconductivity, the insulating phase including the CO and AF phases, caused by metal-insulator transition (MIT) at low pressures below 7GPa, also exhibits unique features. The successive charge and magnetic orderings are realized although the electron density is very low; a 3d1 electron exists among six V sites as is formally expressed as -A0.33(V4++5V5+)0.33O5, where V4+ is a magnetic ion with spin S=1/2 and V5+ is a nonmagnetic ion. Several charge-distribution models have been proposed so far since the discovery of superconductivity. Appearance of various models comes from the complicated crystal structure; there exist three crystalographically inequivalent Vi sites, V1, V2, and V3. Each of them forms quasi-one-dimensional coupling along b axis.
-Na0.33V2O5, a prototype of the series, has been investigated so far using several experimental techniques. Yamaura et. al. observed the lattice modulation along the b direction with twofold (2b) and sixfold (6b) periodicity below and , respectively, and proposed a rectangle-type charge-ordering model below from the X-ray analysis, where V4+ ions are located on every three V2 sites in the b axis.10,14 Nagai et. al. also observed from the neutron diffraction the same lattice modulations along the b direction.15 Moreover, they suggested the charge disproportionation with 3b periodicity from the analysis of magnetic Bragg reflections, and attributed the 6b lattice modulation below to the 2b lattice modulation multiplied by the 3b charge distribution. They proposed a charge model which includes a nonmagnetic V site in every three Vi sites along the b axis. Relative charge density for the Vi sites was estimated as 3:2:3, respectively. Meanwhile electron spin resonance (ESR) suggested another model; the electrons are primarily located on the V1 zigzag chains and the charges occupy six consecutive V1 sites within the V1 zigzag chain below . 16 51V- and 23Na-NMR measurements on -Na0.33V2O5 were investigated based on the charge-distribution model proposed by the neutron diffraction measurement and relative charge density for the Vi sites was estimated as 3:1:1.17,18 The NMR results suggest that V1 site possesses the most charge, whereas charge distribution is rather uniform according to the neutron diffraction. They also reported the changes of nuclear spin-lattice relaxation rate at every transition temperatures. 19
-Ag0.33V2O5, an isomorphic compound of -Na0.33V2O5, has an advantage over -Na0.33V2O5 because crystallographically stable single phase is available for -Ag0.33V2O5 whereas -Na0.33V2O5 is very sensitive to Na concentration; -Na0.32V2O5 hardly exhibits metallic behavior in the whole T range, although -Na0.33V2O5 is metallic at room temperature.8 In -Ag0.33V2O5 we proposed a much simple model in the previous NMR and ZFR works; a 3d1 electron is located on a rung of V1-V3 and V2-V2 ladders like a proton molecular orbital. The electric quadrupole frequency and internal field which correspond to a half of a 3d1 electron were observed in the CO and AF phases, respectively. These results give an evidence of the charge sharing. 20
-Sr0.33V2O5, which possesses more charge than -Na0.33V2O5 or -Ag0.33V2O5, exhibits a similar charge ordering, although ground state properties are different. 6,10,21-23 The 51V-NMR measurements were performed in the metallic phase and remarkable charge disproportion was reported in the V2-V2 ladders; development of ferromagnetic correlation at low temperatures was suggested from the analysis of Knight shift and . 24
At present a variety of phenomena were observed so far for -vanadium bronzes. It is not clear whether the variety is systematically explained from theoretical aspects. Nuclear magnetic resonance (NMR) measurement is one of the most powerful methods for the systematical understanding because the method is site selective, namely can specify microscopic information of 3d1 electrons on each Vi site independently. In the previous work, we proposed a model of the CO phase in -Ag0.33V2O5. In this paper, we extended the previous NMR work in detail focusing on the electric field gradient (EFG) and spin ordering.
II CRYSTAL STRUCTURE
The series of compound consists of three kinds of inequivalent Vi sites. As shown in Fig. 1 a complicated crystal structure was often used in the studies of an early stage; the edge-shared zigzag chains of V1O6 octahedra, the corner-shared two-leg ladders of V2O6 octahedra, and the edge-shared zigzag chains of V3O5 pyramids. 10,21,25
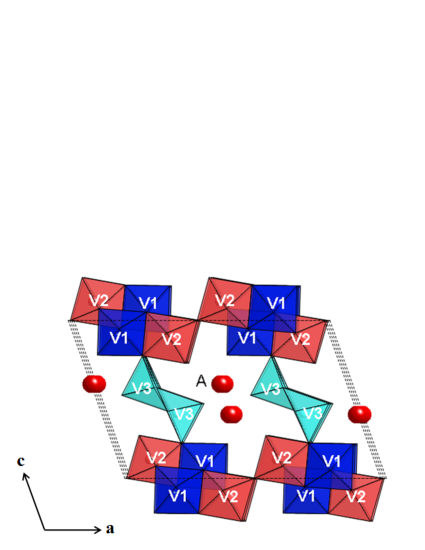
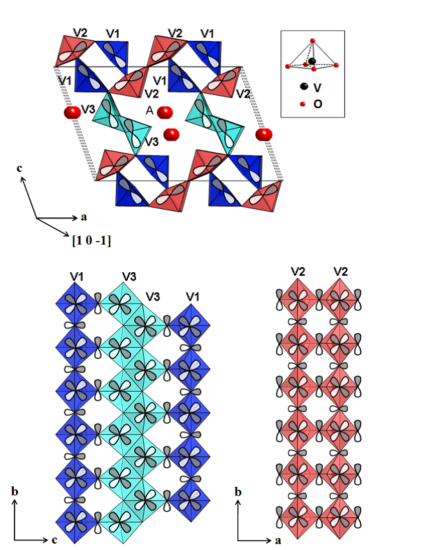
However, a much simpler theoretical model has been presented recently by Doublet and Lepetit.26 Fig. 2 shows weakly interacting two-leg ladder model based on extended Hückel tight-binding calculations; the V1O5 and V3O5 pyramids form corner-shared two-leg ladders, and the two V2O5 pyramids also form another ones independently. Cations are located in the tunnels of the framework and occupy one of two nearest-neighboring sites as shown in both Figs. 1 and 2.
The crystalographical symmetry of the uniform metallic phase above is C2/m. Because of the zigzag ordering of the cations, this symmetry changes to and the b cell parameter becomes twice as large as that above . Although it retains the same space group below , the b cell parameter becomes six times as large as that above . 10,14,21 Thus, the sixfold superstructure is deeply concerned with the charge ordering.
III EXPERIMENTAL CONDITIONS
51V-NMR measurements were performed using a needlelike -Ag0.33V2O5 single crystal prepared by a self-flux method with a CZ furnace. The crystal grew up in the direction of the b axis, the chain or leg direction. The volume of the crystal was 0.540.5 mm3. We used a conventional pulsed-NMR spectrometer. NMR spectra were measured at a frequency of 59.00MHz for the field (H ) parallel () or perpendicular () to the b axis. We attached a hand-made rotation apparatus to the NMR probe to rotate sample for the measurement with Hb. Hereafter we express the direction of the H as an angle from the [1 0 -1] direction as shown in Fig. 2. The error margin was within 5 degrees caused in an initial setting. A powder pellet sample of 8-mm diameter and 6-mm length was used in Zero Field Resonance (ZFR) measurement. ZFR spectra were measured up to 170 MHz with a separation of 0.25 MHz / point at 4.2K.
IV EXPERIMENTAL RESULTS
IV.1 51V-NMR for Hb
We measured 51V-NMR spectra for Hb in the range, 4.2K300K. The pattern of 51V(I=7/2)-NMR spectra changed at 200, 90, and 27K corresponding to the transition temperatures , ,and , respectively. The typical H-swept spectra in the metallic, CO, and AF phases are presented in Fig. 3. The spectra in the metallic phase were measured at both and . There appear seven peaks with a constant separation for a V site owning to the nuclear quadrupole interaction. We observed three sets of signals originating from three crystallographically inequivalent V sites above . The sites were directly assigned from the data for Hb. Information of the peak separations appearing in Fig. 3 is reflected in the fitting curves of Figs. 6(b)-8(b) in Section IV B via asymmetric factors of the EFG. The site assignment in Fig. 3 were derived from the analysis.
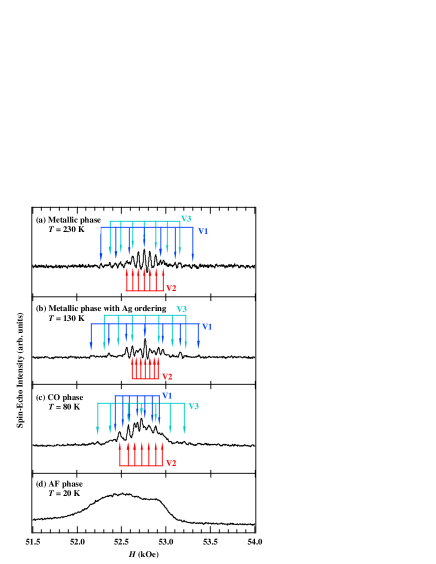
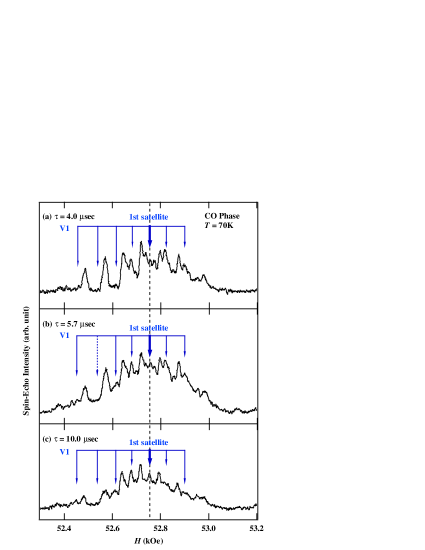
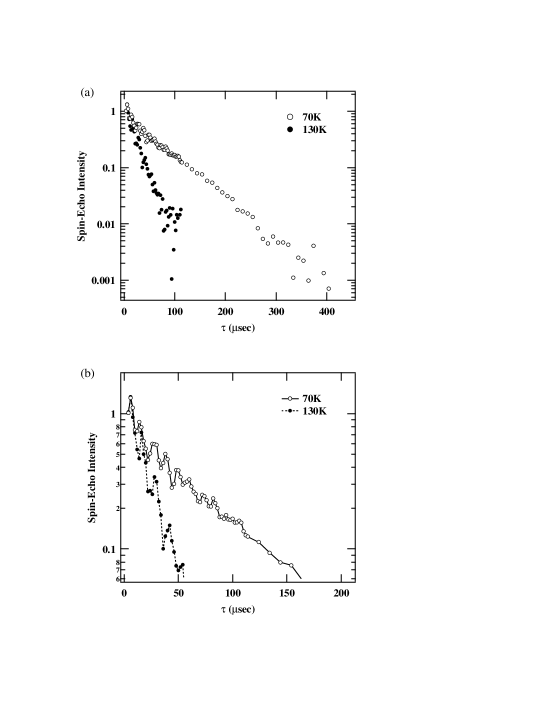
In the CO phase, there appeared broad basal signals in addition to the sharp peaks. The sharp peaks come from magnetic V4+ like sites, while the broad signals from nonmagnetic V5+ sites. As shown in Fig.4, the relative intensity of the sharp peaks becomes small compared to the broad signals with increasing , separation of two rf pulses. This implies that the spin-spin relaxation time of the sharp peaks is shorter than that of the broad signals. In general, nonmagnetic site possesses much larger than that of the magnetic site. Therefore, the basal signals are attributed to nonmagnetic sites. In fact, we measured dependence of the spin echo for the first satellite. The position for the V1 sites is shown in Fig. 4 as bold-type arrows on a dashed line. The dependence is shown in Figs. 5(a) and 5(b). Fig. 5(b) is an expansion of Fig. 5(a). The spin-echo modulation due to the nuclear-quadrupole interaction was clearly seen at short region in the decay curves. We also plotted the dependence in the metallic phase for comparison. The decay curve in the CO phase consists of two components with shorter and longer characteristic time constants. The decay curve with a shorter time constant is similar to that in the metallic state. Therefore the shorter component is attributed to the magnetic sites. The results of NMR spectra and the dependence of the spin echo are consistent.
In the AF phase, the sharp signals arising from magnetic sites are wiped out and only broad signals were observed. It is because the signals of magnetic sites were shifted into higher frequencies owning to the large internal field caused by the AF magnetic ordering.
IV.2 51V NMR for Hb and Site Assignment
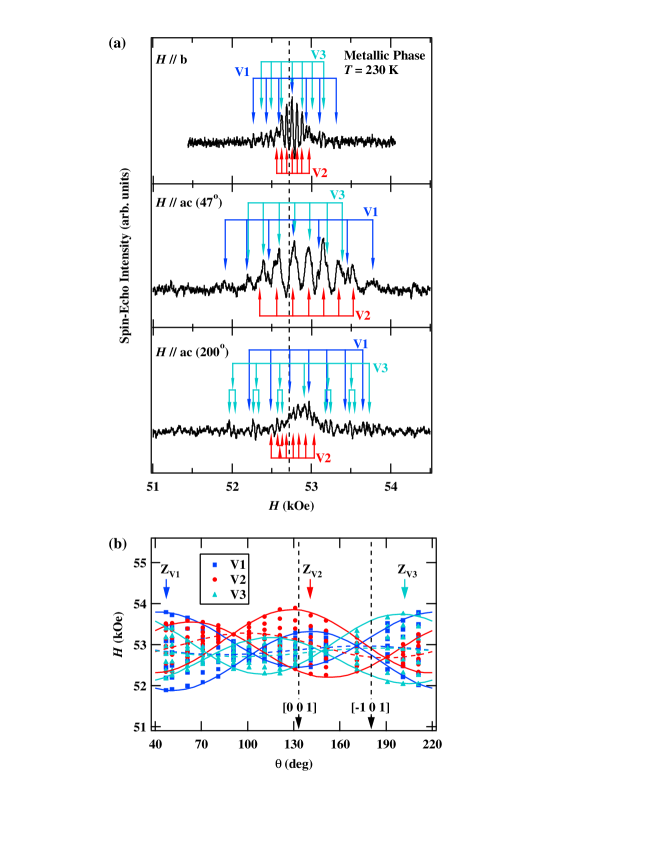
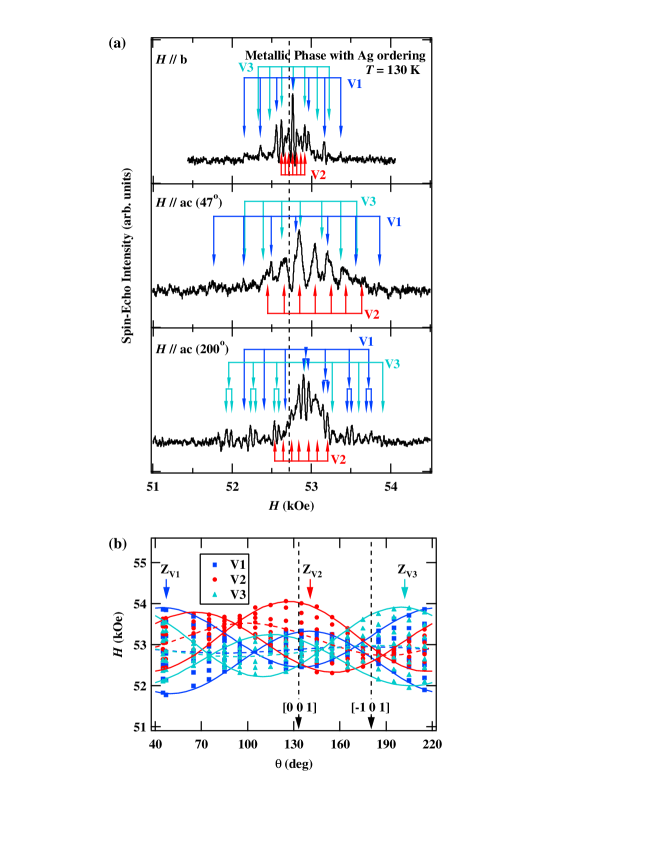
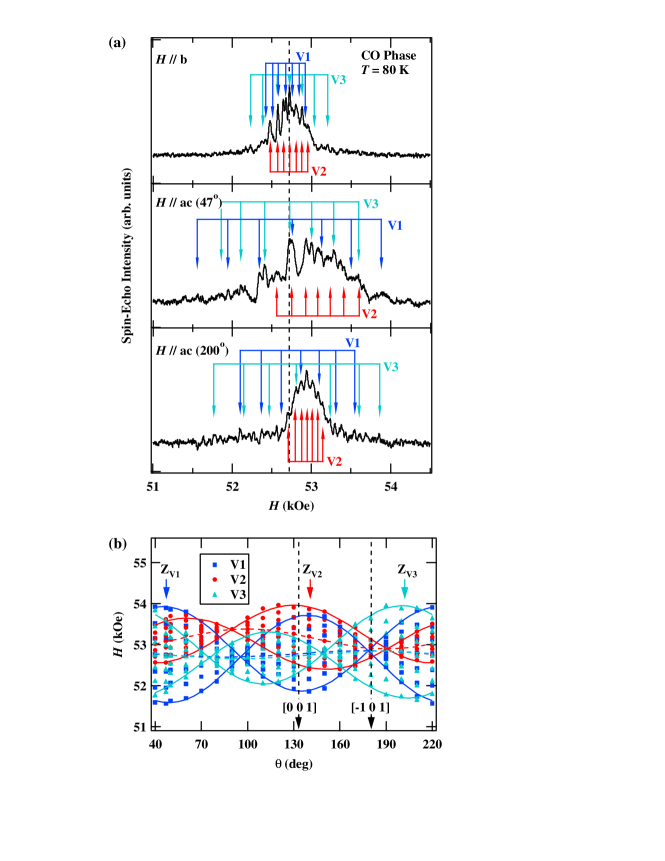
We measured 51V-NMR spectra for the H direction of =47∘ or 200∘ in the range, . The typical spectra at 230, 130, and 80K are shown in Figs. 6(a), 7(a),and 8(a),respectively, as well as those for Hb. These angles correspond to directions of the principle axes of EFG tensor for three Vi sites; the direction of =47∘ corresponds to the first and second principle axes of the V1 and V2 sites, respectively, whereas that of =200∘ corresponds to the first principle axis of the V3 sites. The directions of the principle axes of the EFG tensor are determined from the following analysis in section V. As seen in Fig. 8(a), there appeared the broad basal signals for Hb, the same as that for Hb.
Some peaks at =200∘ seem to split into two in the metallic phase for the first look. These splittings were also seen in the CO phase. Because these splittings are seen in the uniform metallic phase, it comes not from the splitting due to the cation ordering or charge ordering but from a large free induction decay (FID) overlapped with the spin echo. In such a case we estimated the resonance field taking mean values of the two positions.
We also measured dependence of the 51V-NMR peaks at 230, 130, and 80K, as shown in Figs. 6(b), 7(b), and 8(b), respectively. The dotted and two solid lines in these figures indicate fitting curves for Knight shifts and the third satellite peaks, respectively (See Eq. (1) and (2) in section V). The V1, V2, and V3 sites were assigned using the directions of the first principal axes of EFG tensor. According to the theoretical investigation, hybridization of V orbitals forms weakly interacting two-leg ladders as mentioned in Section II. The ground state of V orbital is expected to be dxy, therefore the first principal axis should turn to the apical directions of each VO5 pyramid. In other words, the splitting due to EFG should become the maximum when the H is applied to the apical direction. Our experimental results are consistent with the theoretical model, namely the directions of the first principal axes agree with the apical directions within the angles of 23, 7, and 24 degrees for the V1, V2, and V3 sites, respectively. Three sets of the seven peaks were identified at almost all angles, however, some peaks could not be assigned because of the overlap of large FID signals.
The principle axes of the Knight shift, a direction where the central peak becomes the maximum, were estimated to be 175, 100, and 5∘ for the V1, V2, and V3 sites, respectively. In the case of dxy symmetry, the principle axes of the Knight shift should be the same with those of the EFG. However, the directions of the principle axes do not agree with each other. In other words, the first principle axes of the Knight shift do not coincide with the apical directions of the pyramids. The discrepancy would arise from distortion of the local VO5 pyramids. Thus the Knight shift offers less information than the EFG for the site assignment.
IV.3 Zero Field Resonance in AF Phase
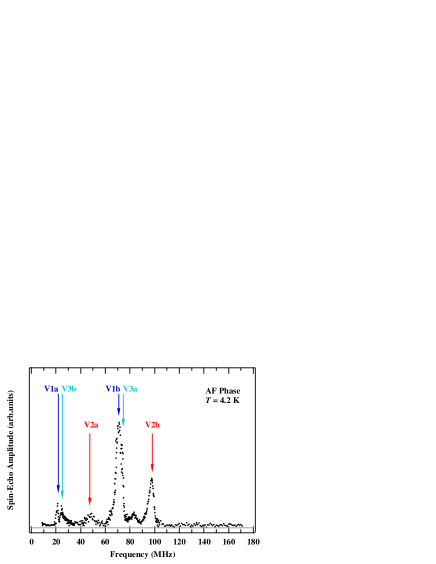
The signals originating from the magnetic V sites are not detected from NMR measurements in the AF phase. They were shifted into high frequency because of the large internal field caused by the magnetic ordering. We preformed the Zero-field resonance (ZFR) at 4.2K to investigate the spin alignment in the AF phase. Figure 9 shows the ZFR spectra observed up to 170MHz. Three coils were used to cover whole frequency region, and the intensity were adjusted to overlap smoothly at the boundary of frequency span which one coil can cover. Three sets of pairs with frequency separation of 50MHz were observed except for the peaks at 83.5MHz. The relative intensity differs between two peaks in each pair; The intensity observed at higher frequencies is larger than that at lower frequencies. The difference does not reflect the number of magnetic V sites contributing to the peaks because the resonance condition is not the same throughout the frequency region. Detail of the site assignment was mentioned in the following section. The peaks at 21.50MHz and 71.25MHz were assigned as peaks originating from the V1 sites, 48.00MHz and 98.75MHz from the V2 sites, and 24.75MHz and 73.00MHz from the V3 sites. At present, the origin of 83.50MHz is not certain.
V ANALYSIS
V.1 Analysis of NMR results
V.1.1 Fitting formula
Seven peaks with an equal frequency separation originate from the interaction of nuclear quadrupole moment Q with the EFG experienced by the nucleus. When -0 is denoted as an angle between the first principle axis and the H, and -0 as an angle between the third principal axis and the H, the frequency separation for an arbitrary direction is expressed as
| (1) |
where is the electric quadrupole frequency and is the EFG for the first principle axis. The asymmetric parameter is defined as using diagonal elements of the EFG tensor. In the case that the H directs the first principle axis, the frequency span between the two first satellites is given as 2. The intensities of seven peaks are proportional to the transition ratio , therefore the ratio should be 7:12:15:16:15:12:7 with increasing .
The 51V Knight Shift K is defined as where represents the field of the central peaks for the V1, V2, and V3 sites. The reference field is calculated as 52.71 kOe from the frequency of 59.00 MHz and the gyromagnetic ratio = 1.1193 MHz/kOe of 51V. The angle dependence of the Knight shift is caused by the asymmetry of hyperfine field:
| (2) |
where and are the symmetric and asymmetric terms, respectively. - represents the angle between the symmetry axis and the H. The parameters , , , and at 230, 130, and 80K are estimated from the 51V-NMR results with the H parallel to the ac plane (Figs. 6(b)-8(b)). The dependence of the peak positions is analyzed based on Eqs. (1) and (2). We used the definition of the EFG tensor, and in the analysis. The value of , , , are listed in the Tables II, III and IV.
| 230K | Site | (MHz) | (%) | (%) | |
|---|---|---|---|---|---|
| V1 | 0.35 | 0.10 | -0.22 | -0.13 | |
| V2 | 0.28 | 0.46 | -0.32 | -0.37 | |
| V3 | 0.31 | 0.06 | -0.13 | -0.13 |
| 130K | Site | (MHz) | (%) | (%) | |
|---|---|---|---|---|---|
| V1 | 0.39 | 0.17 | -0.26 | -0.09 | |
| V2 | 0.28 | 0.63 | -0.54 | -0.48 | |
| V3 | 0.36 | 0.07 | -0.17 | -0.17 |
| 80K | Site | (MHz) | (%) | (%) | |
|---|---|---|---|---|---|
| V1 | 0.44 | 0.57 | -0.07 | -0.09 | |
| V2 | 0.27 | 0.36 | -0.66 | -0.30 | |
| V3 | 0.42 | 0.13 | -0.02 | -0.11 |
The values of for the V1 sites is close to that for the V3 sites at each temperature; they are about 0.3MHz at 230K, and become larger at 80K, namely 0.44 and 0.42MHz for the V1 and V3 sites, respectively. On the other hand, for the V2 sites seems almost temperature independent and the value is about 0.28MHz. As for , the value for the V1 sites is rather close to that for the V3 sites at 230K, however, there appears discrepancy between them at low temperature; for the V1 sites is more than four times as large as that for the V3 sites at 80K. The values of for the V2 sites is more than three times as large as that for the V1 and V3 sites in the metallic phase, but it decreases to less than that for V1 sites at 80K.
The symmetric term of the Knight shift is negative for all Vi sites. The absolute values for the V1 and V3 sites in the metallic phase are larger than those in the CO phase. On the other hand, the absolute value for the V2 sites gradually increases with decreasing temperature, and is several times as large as those for the V1 and V3 sites. The value of for the V1 sites is almost the same with that for the V3 sites at 230K. They hardly change even in the CO phase. On the other hand, the value for the V2 sites is three times as large as those for the V1 and V3 sites at 230K.
These results show that the V1 sites are in a similar local environment to the V3 sites, suggesting covalent bonds between the V1 and V3 sites. On the other hand, the V2 sites seem independent of the V1 and V3 sites. This analysis is consistent with the model of Doublet and Lepetit. Moreover, we mention the charge distribution in the CO phase. is determined by the charge density of the on-site V because contribution from the surrounding oxygen sites is small. The fact is easily seen by comparing for magnetic V4+O5 pyramids and nonmagnetic V5+O5 pyramids: observed in CaV2O5 and V2O5, are 0.97 and 0.06 MHz, respectively.27 In -Ag0.33V2O5 the values of for the three V sites have the intermediate values (0.27 to 0.44 MHz) in the CO phase, suggesting that each magnetic site possesses low charge density of 1/2 to 1/4. The ratio of the weight is estimated as 5:3:5 for the V1, V2 and V3 sites, respectively. The facts suggest that the charge distribution is roughly equal for the three V sites, respectively. To maintain the electrical neutrality, a 3d1 electron exists per six V sites, therefore the present results implies that a 3d1 electron is shared with 2 to 4 sites and the other sites should be nonmagnetic.
V.1.2 dependence of the EFG tensor
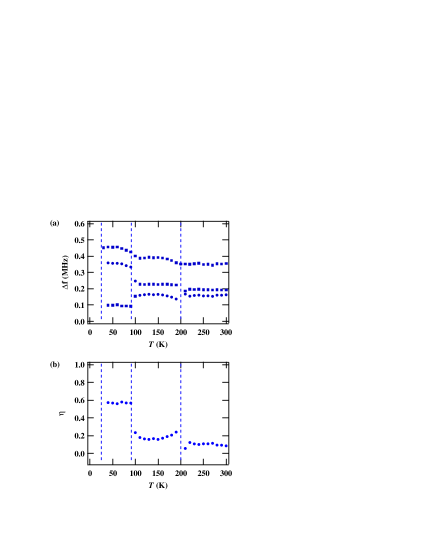
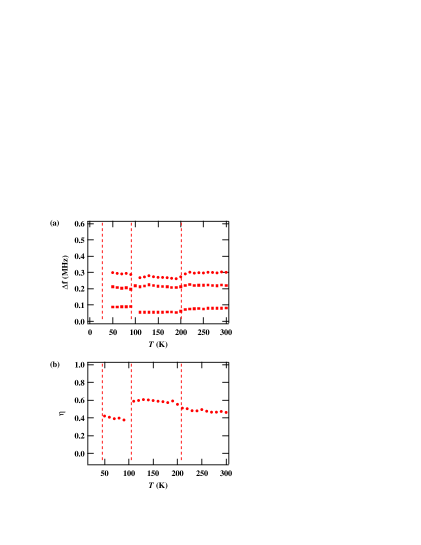
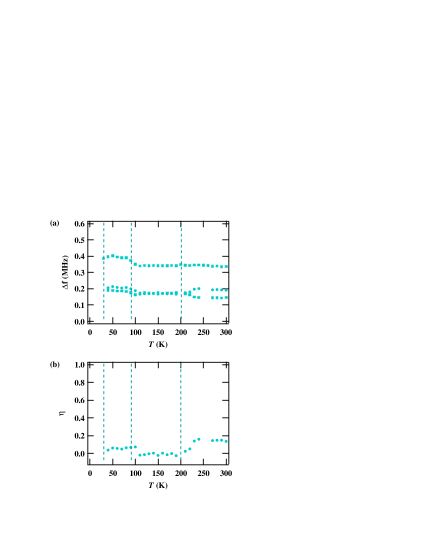
In the previous section, we have discussed the parameters in each phase. Here we present the dependence of the peak separations for three principal axes and for each Vi site. The maximum peak separation in Figs. 10(a)-12(a) at 230, 130, and 80K, corresponds to in the Tables II, III and IV, respectively. Closed squares in Figs. 10(a)-12(a), respectively, represent the peak separation measured for two principal axes of each Vi site, namely two of , , and . As mentioned above, the direction of the first principal axis of the V1 sites and that of the second principal axis of the V2 sites correspond to =47∘, and that of the first principle axis of the V3 sites corresponds to =200∘. Another principal axis of each Vi site corresponds to the b axis. Closed circles represent calculated values for the other principal axis using the equation . Figs. 10(b), 11(b), and 12(b) show the T dependence of for V1, V2 and V3 sites, respectively. The EFG tensor exhibits some features for each Vi site.
(i) The EFG tensor of the V1 sites shows unique behavior; The b axis, the third principal axis in the metallic phase, turns into the second principal axis in the CO phase (Fig. 10(a)). Simultaneously, the value of also enhances below (Fig. 10(b)), reflecting that the distortion of the lattice is caused in the CO phase.
(ii) The EFG tensor of the V2 sites shows only slight change throughout the T range between 30K and 300K (Fig. 11).
(iii) The EFG tensor of the V3 sites is the most isotropic, namely, is the smallest among the three V sites (Fig. 12(b)). The value of for the V3 sites is almost constant in the metallic phase and becomes a little bit larger below for all principle axes.(Fig. 12(a))
Comparing the three Vi sites, for the V1 and V3 sites show the similar T dependence, but that for V2 sites is almost independent of T. On the other hand, and the symmetry of the EFG tensor show the different feature for each Vi site.
V.2 Analysis of ZFR spectrum
Based on the analysis above mentioned, the V1 and V3 sites seem to be in a similar local environment. This behavior is also seen in the ZFR spectrum in the AF phase; the peaks at 21.50 and 24.75 MHz are located on very close positions as well as 71.25 and 73.00 MHz, suggesting that they originate from the magnetic V1-V3 rungs. We assigned the peaks at 21.50 and 71.25 MHz to the magnetic V1 sites and those at 24.75 MHz and 73.00 MHz to the magnetic V3 sites. The other signals at 48.00 and 98.75 MHz are attributed to the two V2s sites.
We discuss the local spin alignment in the AF phase using the ZFR frequencies. ZFR frequency is proportional to the internal field at each V site, i.e. . The internal field is composed of Fermi-contact field and dipole field : , where we neglected the hyperfine field due to the spin-orbit interaction by considering the g value for the isomorphic -Na0.33V2O5 observed in the ESR measurements.16 is expressed using expectation value of spin at a V site , and hyperfine coupling defined as a magnetic field arising from one Bore magnetron. When we denote hyperfine coupling of as , and dipole coupling as and for spin parallel and perpendicular to the EFG maximum, is written as
| (3) |
where , is a reduction factor due to the covalent effect with oxygen, and is the angle between spin and the EFG maximum. and for the dxy orbital are expressed as
| (4) |
and
| (5) |
We used =0.8 and =-100 kOe as typical values. The values of and are calculated to be -130 and 65 kOe, respectively, using the reference value = 3.684 atomic units.28
Three Vi sites possess almost the same charge density from the analysis of , therefore should be expressed as
| (6) |
X-ray diffraction shows the sixfold periodicity in the leg direction below , implying that possible choice of is an integer from one to six.

Fig. 13 shows the dependence of the resonance frequency calculated with Eqs. (3)-(6) for integers n=1 to 6. The signals below 24.75 MHz are out of the fitting curve for , while the signals above 71.25 MHz are out of the fitting curve for . Thus the value of n is uniquely determined as 2. This result is consistent with the 51V-NMR analysis. As a result, a 3d1 electron is shared within two V sites. Two values of are calculated to be =, and for the V1, V2 and V3 sites, respectively.
VI DISCUSSION
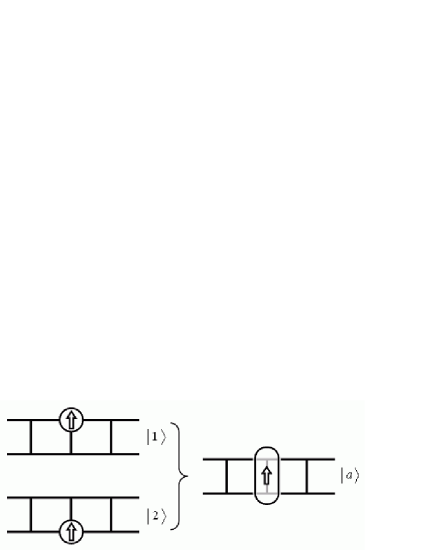
The fact that a 3d1 electron is shared within two V sites originates from relationship between hopping and Coulomb repulsions between neighboring sites. Formation of the CDW may be pointed out as another possibility. However, the insulating phase of -Sr0.33V2O5 is hardly explained by the nesting of Fermi surface; several pressure-induced insulating phases accompanied with superstructures were observed without the changes of crystal structure and carrier number. It is unlikely that all of the phases arise from the nesting of Fermi surface because the crystal structure is unchanged. There are two possibilities for a 3d1 electron shared within two V sites; one is sharing within a rung, and the other is sharing within a leg. In the latter model, the charge would be distributed to only one side of the V1 or V3 sites according to the crystal symmetry. The latter model conflicts with the analysis of 51V-NMR and ZFR measurements, in which charge density is almost the same for the V1 and V3 sites. Therefore, our experimental results suggest charge sharing within a rung. When (, and ) represents the CO state where a 3d1 electron with up spin () is located on a site as shown in Fig. 14, a 3d1 electron shared within a rung is expressed as
| (7) |
where is an arbitrary number, but the energy depends on its value, as do the charge densities; an appreciable energy difference can be expected between the bonding state ()and the anti-bonding state (). The occupation of the bonding state would have more charge in-between the two V sites and lead to a strong coupling to phonons. This would locally favor a shortening of the rung.
The expectation values of are derived from and as follows,
| (8) | |||||
| (9) |
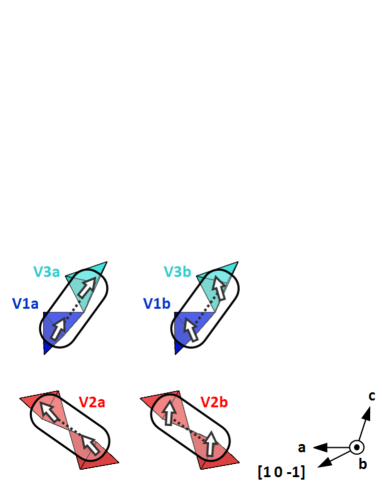
Note that the magnitude and direction of should be the same for the two sites. The spin directions from [1, 0, -1] are indicated by the sum of , the angle between the first principle axis of EFG and [1, 0, -1], and , the angle between the first principle axis of EFG and spin direction : . The angles are estimated as 94 and 101 degrees for one rungs, and 145 and 156 degrees for the other rungs, respectively, making the difference less than about 10 degrees. The directions are shown in Fig. 15. One of the spin moment turns to the bottom plane of the VO5 pyramid, and the other the direction of about 30 degrees from the apical direction of the pyramid. Similar situation holds for the V2 sites as shown in Fig. 15; The two directions are estimated to be 76 and 121 degrees. One may point out that possible directions of could be out of the ac plane. Such a situation is hardly expected if charge sharing within a rung is realized and the directions of are the same within a rung; Experimentally, the directions obtained independently for the V1 and V3 sites agree with each other only when they align in the ac plane.
The spin moments with the opposite direction also satisfies Eq. (3), which makes the antiferromagnetic alignment possible in the AF phase. The existence of two kinds of spin moments for each Vi site is attributed to the crystallographical peculiarity in the CO phase : X-ray diffraction revealed the sixfold lattice modulation along the b axis making locally inequivalent pyramid structure on the Vi site. Therefore two V1-V3 rungs located on crystalographically inequivalent position would make two kinds of spin directions. The two V2s rungs are located on equivalent positions. Two sets of V2-V2 magnetic rungs would be induced by local arrangement of the V1-V3 magnetic rungs, although two V2-V2 rungs are located on equivalent positions.
To maintain electrical neutrality, the ratio of magnetic rung and nonmagnetic rung should be 1 to 2. The magnetic rungs are expected to align with threefold lattice periodicity to avoid Coulomb repulsion. This threefold charge periodicity has also been reported for -Na0.33V2O5. However, the charge-distribution pattern is different; -Na0.33V2O5 consists of two magnetic rungs and a nonmagnetic rung. The reason why the charge-distribution pattern differs depending on materials is not certain at present. The charge distribution may be sensitive to the relationship between hopping and repulsion and as a result depends on detailed environments of the materials.
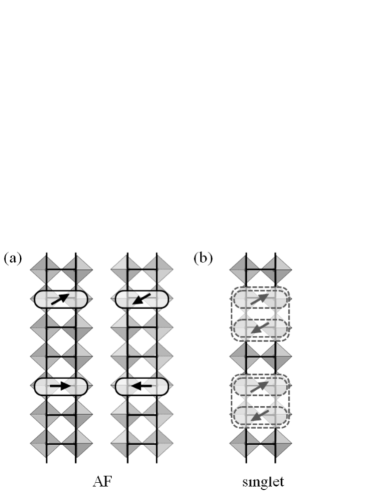
The idea of charge sharing within a rung like hydrogen molecule is rather promising to understand why the ground state of -Ag0.33V2O5 is an AF ordering state, whereas that of -Sr0.33V2O5 is a singlet state. The former includes a magnetic rung with S=1/2 aligned in every three rungs along the leg direction (Fig. 16(a)), then coupling of two rungs seems difficult because such rungs would be located on isolated positions to avoid Coulomb interaction. On the other hand, the latter includes one nonmagnetic rungs in every three rungs along the leg direction. As a results two rungs with S=1/2 are located on the nearest neighboring positions (Fig. 16(b)), therefore singlet formation accompanied with lattice distortion would decrease the total energy. In real material, situation may be much complicated, however, essential property may be explained by the charge sharing.
VII SUMMARY
We measured 51V NMR and ZFR on -Ag0.33V2O5 to investigate local properties of spin and charge for three inequivalent Vi sites (i=1, 2, and 3). The principal axes of the EFG tensor were identified for the three phases, namely the metallic phase at T above and below cation ordering temperature, the charge-ordering phase, and antiferromagnetic odering phase. We found that the EFG for the V1 sites shows similar behavior to that for the V3 sites. The similarity was also observed as pairs of signals closely located in ZFR spectra. These results were explained by charge sharing model where a 3d1 electron is shared within a rung in both V1-V3 and V2-V2 two-leg ladders.
Acknowledgements.
We would like to thank Y. Uwatoko, M. Hedo, N. Takeshita, T. Nakanishi, S. Yamamoto, M. Itoh, S. Fujimoto and H. Ikeda for valuable discussions. We also thank J. Yamaura for X-ray analysis of the crystal axes. This work was supported by the Japan Society for the Promotion of Science (201187). This work was partially supported by a Grant-in-Aid (KAKENHI 17340107) from the Ministry of Education, Science and Culture, Japan.References
- (1)
- (2) [1] H. Yamada and Y. Ueda, J. Phys. Soc. Jpn. 68, 2735 (1999).
- (3) [2] Y. Ueda, J. Phys. Soc. Jpn. Suppl. B 69, 149 (2000).
- (4) [3] M. Itoh, N. Akimoto, H. Yamada, M. Isobe, and Y. Ueda, J. Phys. Soc. Jpn. Suppl. B 69, 155 (2000).
- (5) [4] Y. Ueda, H. Yamada, M. Isobe, and T. Yamauchi, J. Alloys Compd. 317-318, 109 (2001).
- (6)
- (7) [5] T. Yamauchi, Y. Ueda, and N. Môri, Phys. Rev. Lett. 89, 057002 (2002).
- (8) [6] Y. Ueda, M. Isobe, and T. Yamauchi, J. Phys. Chem. Solids 63, 951 (2002).
- (9) [7] T. Yamauchi, M. Isobe, and Y. Ueda, Solid State Sci. 7, 874 (2005).
- (10) [8] T. Yamauchi and Y. Ueda, Phys. Rev. B 77, 104529 (2008).
- (11)
- (12) [9] Y. Nakai, S. Kagoshima, and H. Nagasawa, J. Phys. Soc. Jpn. 51, 697 (1982).
- (13) [10]J. Yamaura, M. Isobe, H. Yamada, T. Yamauchi, and Y. Ueda, J. Phys. Chem. Solids 63, 957 (2002).
- (14)
- (15) [11] A. Hisada, N. Fujiwara, T. Yamauchi, Y. Ueda, M. Hedo, and Y. Uwatoko, J. Magn. Magn. Mater. 310, 893 (2007).
- (16) [12] T. Yamauchi, H. Ueda, and Y. Ueda, Physica C 460-462, 66 (2007).
- (17)
- (18) [13] J. Merino and R. H. McKenzie, Phys. Rev. Lett. 87, 237002 (2001).
- (19)
- (20) [14] J. Yamaura, T. Yamauchi, E. Ninomiya, H. Sawa, M. Isobe, H. Yamada, and Y. Ueda, J. Magn. Magn. Mater. 272-276, 438 (2004).
- (21)
- (22) [15] S. Nagai, M. Nishi, K. Kakurai, Y. Oohara, H. Yoshizawa, H. Kimura, Y. Noda, B. Grenier, T. Yamauchi, J. Yamaura, M. Isobe, Y. Ueda, and K. Hirota, J. Phys. Soc. Jpn. 74, 1297 (2005).
- (23)
- (24) [16] M. Heinrich, H.-A. Krug von Nidda, R. M. Eremina, A. Loidl, Ch. Helbig, G. Obermeier, and S. Horn, Phys. Rev. Lett. 93, 116402 (2004).
- (25)
- (26) [17] T. Suzuki, I. Yamauchi, M. Itoh, T. Yamauchi, and Y. Ueda, Phys. Rev. B 73, 224421 (2006).
- (27) [18] M. Itoh, I. Yamauchi, T. Kozuka, and T. Suzuki, Phys. Rev. B 74, 054434 (2006).
- (28) [19] I. Yamauchi, M. Itoh, T. Yamauchi, and Y. Ueda, Phys. Rev. B 74, 104410 (2006).
- (29)
- (30) [20] A. Hisada, N. Fujiwara, T. Yamauchi, Y. Ueda, M. Hedo, and Y. Uwatoko, Phys. Rev. B 78, 012402 (2008).
- (31)
- (32) [21] C. Sellier, F. Boucher, and E. Janod, Solid State Sci. 5, 591 (2003).
- (33) [22] V. Ta Phuoc, C. Sellier, and E. Janod, Phys. Rev. B 72, 035120 (2005).
- (34) [23] T. Yamauchi, H. Ueda, J. Yamaura, and Y. Ueda, Phys. Rev. B 75, 014437 (2007).
- (35)
- (36) [24] T. Waki, M. Takigawa, T. Yamauchi, J. Yamaura, H. Ueda, and Y. Ueda, J. Phys. Chem. Solids 68, 2143 (2007).
- (37)
- (38) [25] E. Deramond, J.-M. Savariault, and J. Galy, Acta Crystallogr. C50, 164 (1994).
- (39)
- (40) [26] M. L. Doublet and M. B. Lepetit, Phys. Rev. B 71, 075119 (2005).
- (41)
- (42) [27] H. Iwase, M. Isobe, Y. Ueda, and H. Yasuoka, J. Phys. Soc. Jpn. 65, 2397 (1996).
- (43)
- (44) [28] A. Abragam and B. Bleaney, Electron Paramagnetic Resonance of Transition Ions (Clarendon Press, Oxford, 1970).
- (45)