CI and CO in nearby galaxy centers
Abstract
Aims. We study the physical properties and amount of molecular gas in the central regions of galaxies with active nuclei.
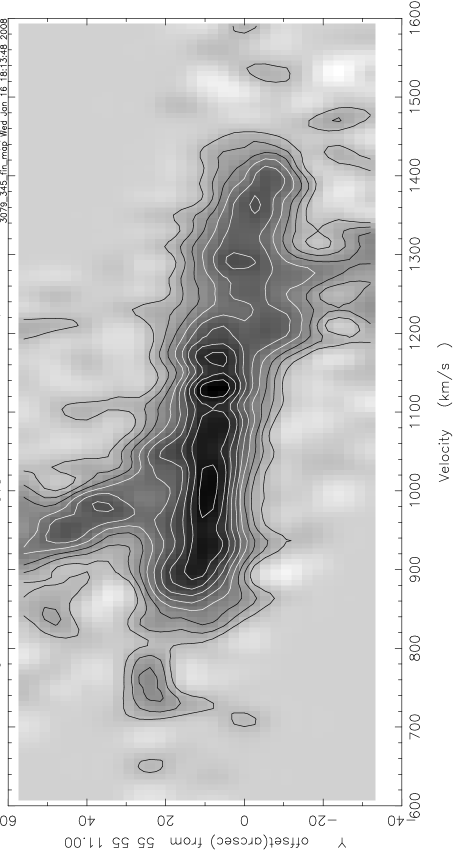
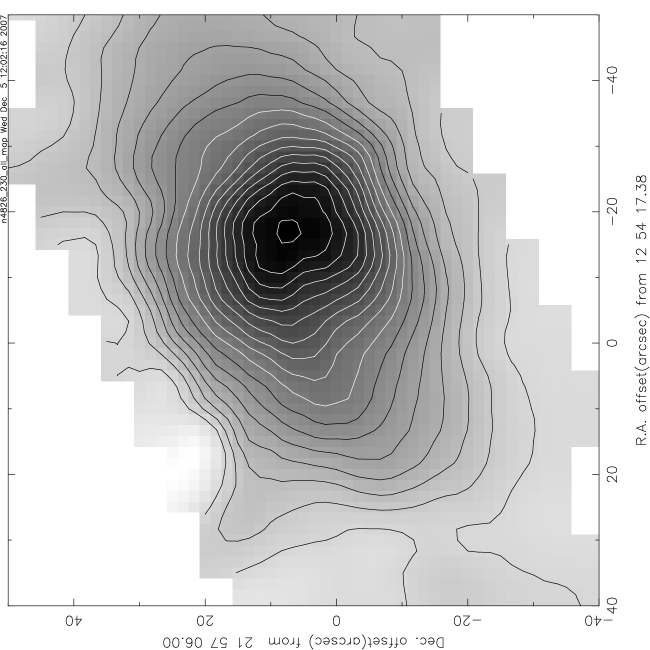
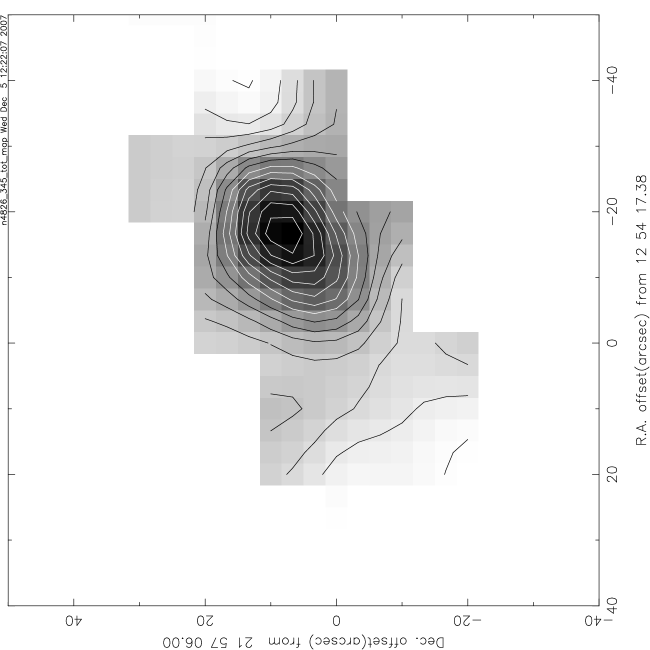
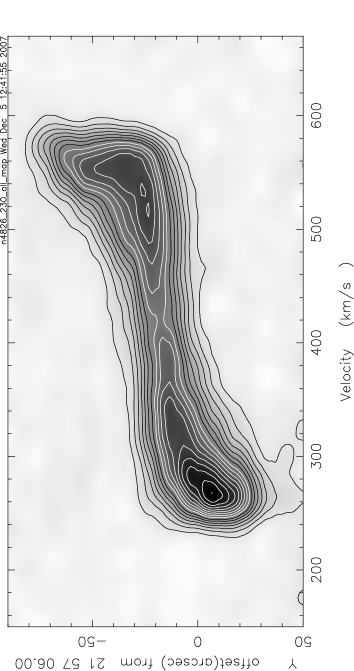
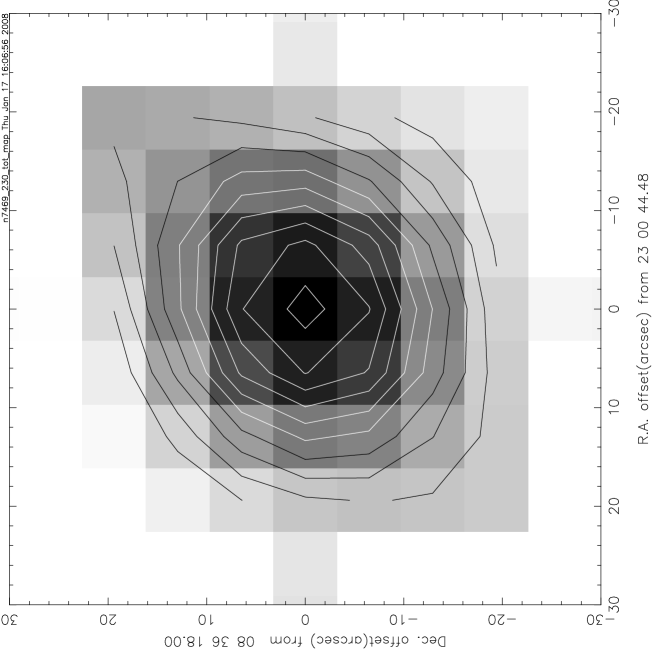
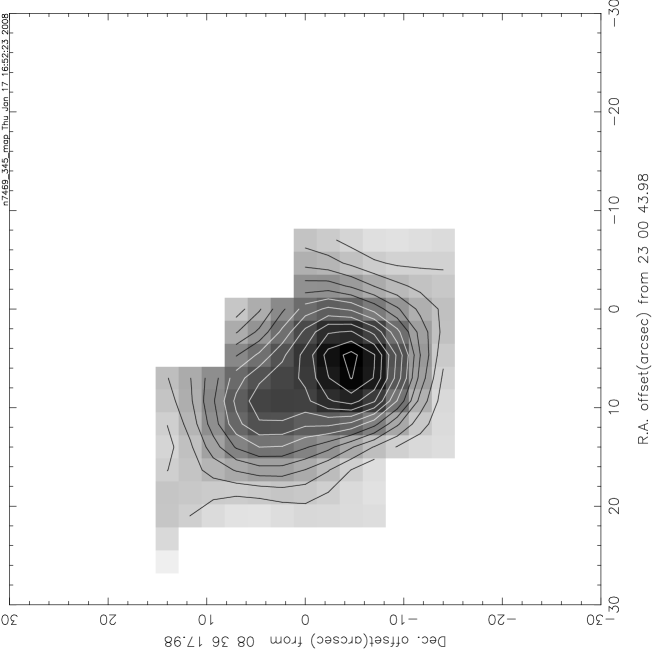
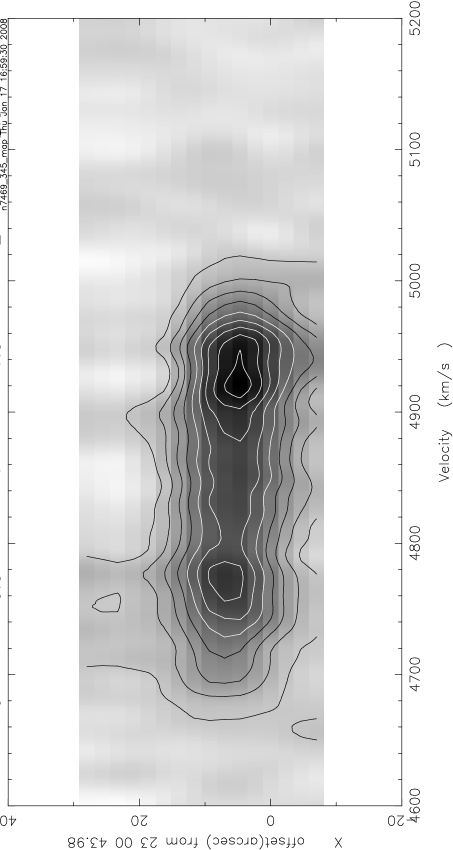
Methods. Maps and measurements of the =1–0, =2–1, =3–2, =4–3 , the =1–0, =2–1, and =3–2 lines in the central arcminute squared of NGC 1068, NGC 2146, NGC 3079, NGC 4826, and NGC 7469, as well as 492 GHz CI maps in three of these are used to model the molecular gas clouds in these galaxies.
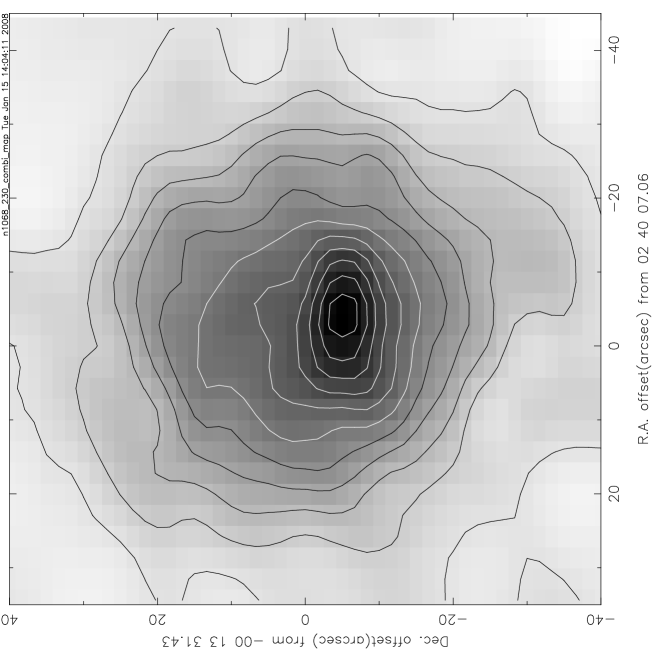
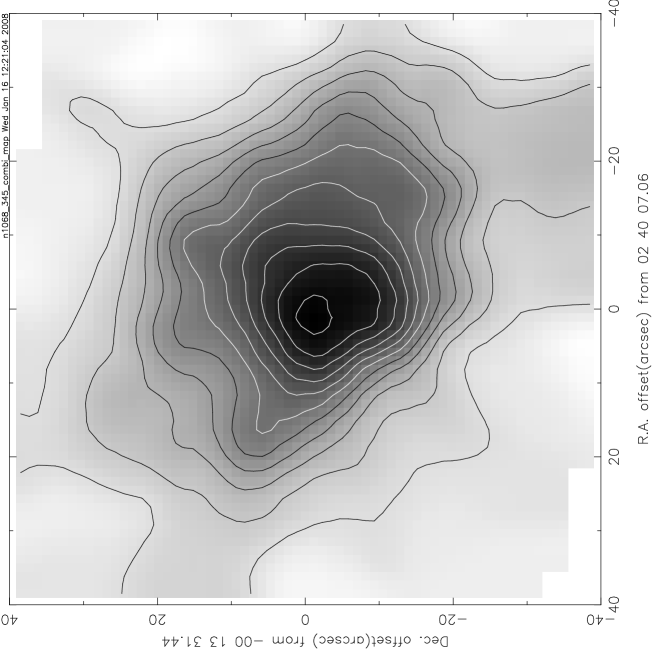
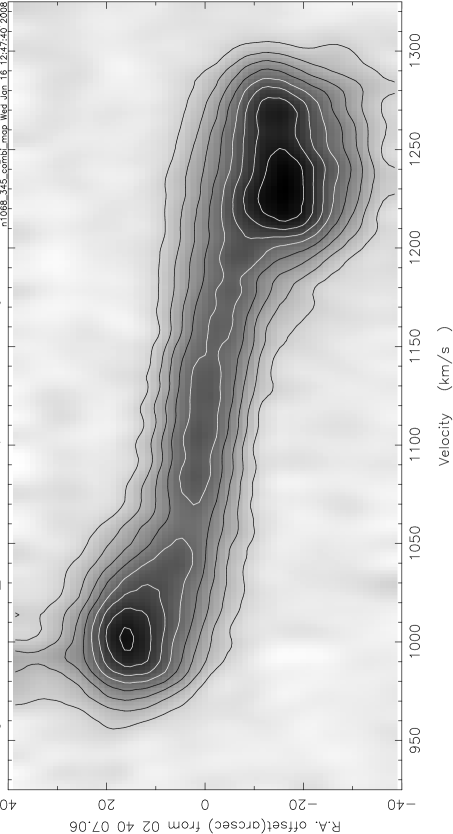
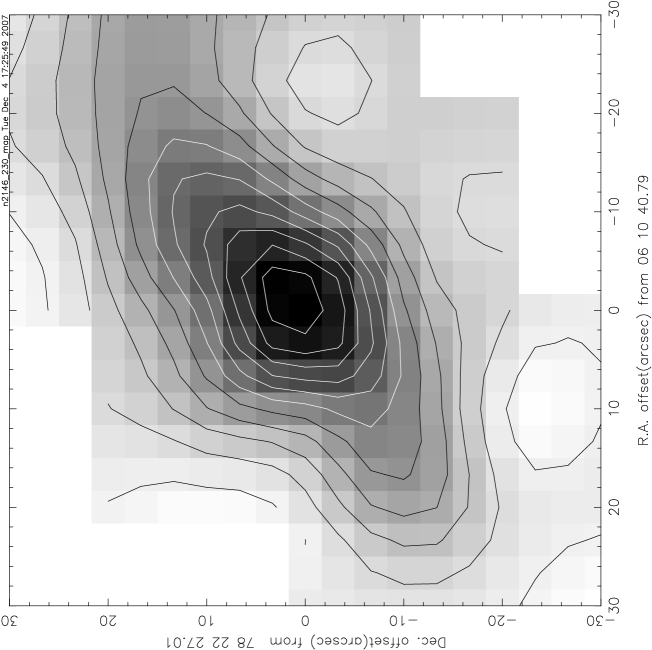
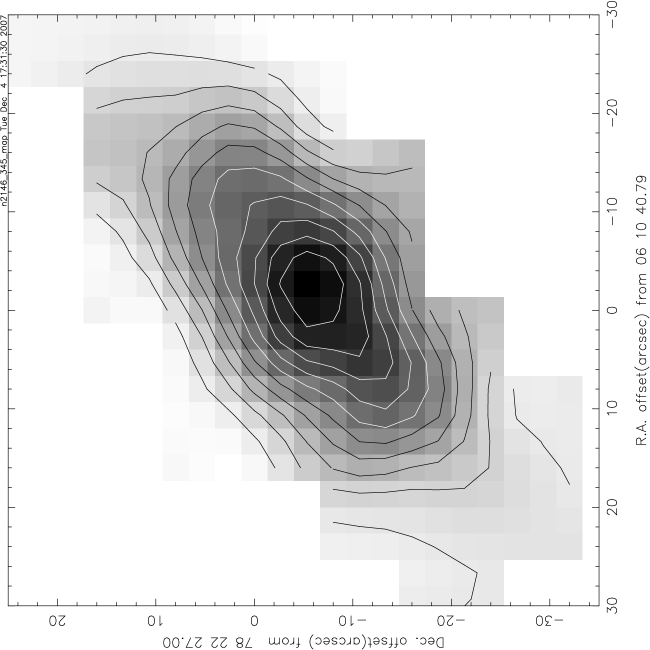
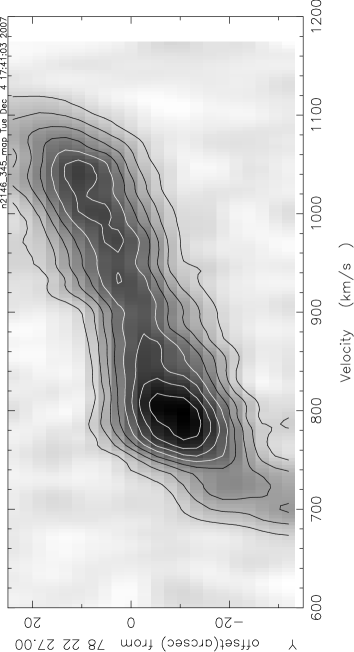
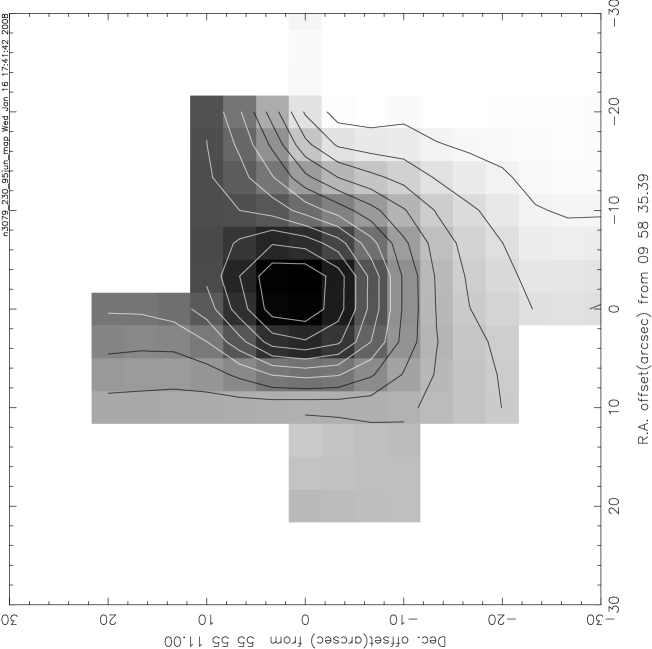
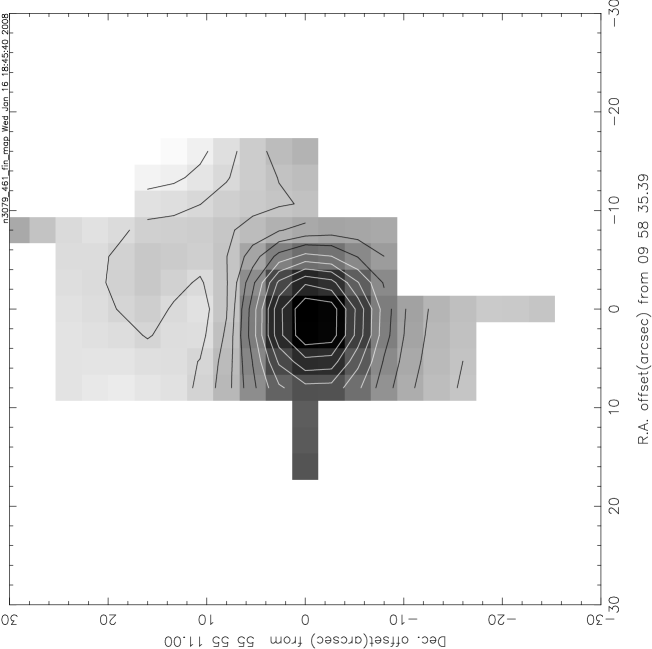
Results. Bright CO concentrations were detected and mapped in all five objects. In all cases, the observed lines could be fitted with two distinct gas components. The physical condition of the molecular gas is found to differ from galaxy to galaxy. Rather high kinetic temperatures of 125-150 K occur in NGC 2146 and NGC 3079. Very high densities of occur in NGC 2146, NGC 3079, and NGC 7469. The CO to conversion factor is typically an order of magnitude less than the ‘standard’ value in the Solar Neighborhood. The molecular gas is constrained within radii between 0.9 and 1.5 kpc from the nuclei. Within these radii, masses are typically M. The exception is the (relatively nearby) merger NGC 4826 with =0.3 kpc, and M. The mass is typically about one per cent of the dynamical mass in the same region.
Key Words.:
Galaxies – individual: NGC 1068, NGC 3079, NGC 7469 – ISM – centers; Radio lines – galaxies; ISM – molecules, CO, C,1 Introduction
Molecular gas is a major constituent of the interstellar medium in galaxies. This is particularly true for star-forming complexes in the spiral arms, but strong concentrations of molecular gas are also frequently found in the inner few kiloparsec of spiral galaxies. These concentrations of gas play an important role in the evolution of galaxy centers. They provide the material for inner galaxy starbursts and the accretion of massive black holes. It is thus important to determine the characteristics of this molecular hydrogen gas (density, temperature, excitation) and especially its amount. It cannot be observed directly, and its properties can only be inferred from observations of tracer elements, of which CO is one of the most abundant and easiest observable. However, the CO emitting gas is not in LTE, and the most commonly observed lines are optically thick. We have to observe CO in various transitions to obtain reliable physical results and to break the temperature-density degeneracy that plagues intensities, also in an optically thin isotope (e.g. also in ). The observed molecular and atomic line intensities then provide the essential input for further modeling.
We have therefore observed a sample of nearby spiral galaxy centers in various CO transitions and in the 492 GHz P–P [CI] transition. These galaxies were selected to be bright at infrared wavelengths, and more specifically to have IRAS flux densities f Jy. The results for seven galaxies from this sample have already been published. These are NGC 253 (Israel et al. 1995), NGC 7331 (Israel Baas 1999), NGC 6946, and M 83 = NGC 5236 (Israel Baas 2001 – Paper I), IC 342 and Maffei 2 (Israel Baas 2003 – Paper II), M 51 = NGC 5194 (Israel et al. 2006 – Paper III). In this paper, we present results obtained for an additional five bright and well-studied galaxies. In Table 1 we have summarized the characteristics of their appearance.


| NGC 1068 | NGC 2146 | NGC 3079 | NGC 4826 | NGC 7469 | |
|---|---|---|---|---|---|
| Type | (R)SA(rs)b; Sy1 | SB(s)abp; HII | SB(s)c; Lin; Sy2 | (R)SA(rs)ab; HII/Lin | (R)SAB(rs)a; Sy1.2 |
| R.A. (B1950) | 024007.1 | 061040.2 | 095835 | 125416.3 | 230044.4 |
| Decl.(B1950) | -001332 | +782229 | +555516 | +215710.4 | +083616 |
| R.A. (J2000) | 024240.7 | 061837.7 | 100158 | 125643.7 | 230315.6 |
| Decl.(J2000) | -000048 | +782125 | +554047 | +214058 | +085226 |
| +1023 | +879 | +1116 | +408 | +4889 | |
| Inclination | 37 | 51 | 74 | 60 | 46 |
| Position angle | 82 | 128 | 165 | 112 | 128 |
| Distance | 16.5 Mpc | 17.9 Mpc | 19.4 Mpc | 4.1 Mpc | 29.5 Mpc |
| Scale | 80 pc/ | 87 pc/ | 94 pc/ | 20 pc/ | 143 pc/ |
Notes to Table 1: NED Kaneko et al. (1989); Tarchi et al. (2004); Young et al. (1988b); Irwin & Seaquist (1991); García-Burillo et al. (2003); Beswick, Pedlar & McDonald (2002); Meixner et al. (1990); Davies, Tacconi & Genzel (2004). see Moustakas et al. (2006)
| Galaxy | Date | Beam | t(int) | Map Parameters | |||||
| Size | No. | Size | Spacing | P.A. | |||||
| (K) | () | (sec) | pnts | () | () | () | |||
| =1-0 (115 GHz) | |||||||||
| NGC 1068 | 07Jan | 280 | 22 | 0.74 | 750 | 1 | – | – | – |
| NGC 2146 | 05Feb | 315 | 1200 | 1 | – | – | – | ||
| NGC 3079 | 05Oct | 264 | 1680 | 1 | – | – | – | ||
| NGC 4826 | 06Jul | 222 | 840 | 1 | – | – | – | ||
| NGC 7469 | 05Jan | 157 | 960 | 1 | – | – | – | ||
| =2-1 (230 GHz) | |||||||||
| NGC 1068 | 07Jan | 474 | 12 | 0.53 | 750 | 1 | – | – | – |
| 94Jan | 350 | 21 | 0.69 | 120 | 71 | 8090 | 7 | 11 | |
| 96Jan | 850 | 21 | 0.69 | 120 | 54 | 5090 | 10 | 46 | |
| NGC 2146 | 05Feb | 290 | 12 | 0.53 | 480 | 1 | – | – | – |
| 91Apr/93Apr | 1420/372 | 21 | 0.69 | 320/300 | 39 | 5080 | 10 | 123 | |
| NGC 3079 | 05Oct | 352 | 12 | 0.53 | 1200 | 1 | – | – | – |
| 95Jun | 585 | 21 | 0.69 | 240 | 14 | 3030 | 10 | 165 | |
| NGC 4826 | 06Jul | 331 | 12 | 0.53 | 780 | 1 | – | – | – |
| 93May/94Jan | 570/468 | 21 | 0.69 | 200/300 | 136 | 10080 | 7 | 110 | |
| NGC 7469 | 05Jan | 224 | 12 | 0.53 | 960 | 1 | – | – | – |
| 91Sep/00Oct | 194/308 | 21 | 0.69 | 400/900 | 9 | 3030 | 10 | 35 | |
| =3-2 (345 GHz) | |||||||||
| NGC 1068 | 94jan | 1180 | 14 | 0.58 | 600 | 71 | 7080 | 7 | 45 |
| 96Jan | 1980 | 0.58 | 120 | 63 | 3063 | 6 | 45 | ||
| NGC 2146 | 96Jan | 1139 | 0.59 | 180 | 28 | 2472 | 8 | 123 | |
| NGC 3079 | 93Dec | 1293 | 0.56 | 400 | 12 | 1496 | 8 | 165 | |
| NGC 4826 | 93May/94Jan | 517/939 | 0.53 | 200/480 | 20 | 6030 | 10 | 114 | |
| NGC 7469 | 96Jul/01Jun | 1358/715 | 0.61 | 480/600 | 32 | 3528 | 7 | 0 | |
| =4-3 (461 GHz) | |||||||||
| NGC 1068 | 96Jul | 3365 | 11 | 0.50 | 600 | 23 | 2424 | 6 | 45 |
| NGC 2146 | 01Nov | 4743 | 0.50 | 1440 | 4 | 1818 | 6 | 123 | |
| NGC 3079 | 93Dec/94Mar | 3360/5510 | 0.50 | 600 | 13 | 2456 | 8 | 165 | |
| NGC 4826 | 93Dec/94Mar | 2045/4630 | 0.50 | 320/600 | 16 | 3060 | 10 | 114 | |
| NGC 7469 | 99Jul | 2008 | 0.52 | 1200 | 9 | 1818 | 6 | 0 | |
| Galaxy | Date | Beam | t(int) | ||
| Size | |||||
| (K) | () | (sec) | |||
| =1-0 (110 GHz) | |||||
| NGC 1068 | 07Jan | 160 | 23 | 0.75 | 1325 |
| NGC 2146 | 05Feb | 153 | 1200 | ||
| NGC 3079 | 05Oct | 149 | 1680 | ||
| NGC 4826 | 06Jul | 160 | 1620 | ||
| NGC 7469 | 05Jan | 121 | 5760 | ||
| =2-1 (220 GHz) | |||||
| NGC 1068 | 96Jan | 456 | 22 | 0.69 | 3600 |
| 07Jan | 212 | 13 | 0.55 | 1320 | |
| NGC 2146 | 91Sep | 1304 | 22 | 0.69 | 3560 |
| 05Feb | 374 | 13 | 0.55 | 960 | |
| NGC 3079 | 94Mar | 370 | 22 | 0.69 | 5220 |
| 05Oct | 374 | 13 | 0.55 | 1200 | |
| NGC 4826 | 93Dec | 534 | 22 | 0.69 | 4000 |
| 06Jul | 203 | 13 | 0.55 | 780 | |
| NGC 7469 | 95Jun | 302 | 22 | 0.69 | 4200 |
| 05Jan | 203 | 13 | 0.55 | 1920 | |
| =3-2 (330 GHz) | |||||
| NGC 1068 | 97Nov | 427 | 14 | 0.59 | 2400 |
| NGC 2146 | 01Jan | 914 | 0.59 | 3600 | |
| NGC 3079 | 95Apr | 2637 | 0.58 | 1860 | |
| NGC 4826 | 94Apr | 1422 | 0.53 | 6360 | |
| NGC 7469 | 93Apr | 882 | 0.55 | 6000 | |
| [CI] (492 GHz) | |||||
| NGC 1068 | 96Jul | 3048 | 11 | 0.50 | 800 |
| NGC 3079 | 94Mar | 6239 | 0.50 | 1200 | |
| NGC 4826 | 94Dec | 2904 | 0.51 | 2400 | |
| 97Mar | 3042 | 0.51 | 1200 | ||
Notes: Map of 27 points covering with spacing in PA = 70. Strip map in declination, 7 points covering with spacing in PA = 165. Small 5-point map covering with spacing in PA = 114.