Resolved 24.5 micron emission from massive young stellar objects††thanks: Based on data collected at the Subaru telescope, which is operated by the National Astronomical Observatory of Japan.
Abstract
Context. Massive young stellar objects (MYSO) are surrounded by massive dusty envelopes, whose physical structure and geometry are determined by the star formation process.
Aims. Our principal aim is to establish the density structure of MYSO envelopes on scales of 1000 AU. This constitutes an increase of a factor 10 in angular resolution compared to similar studies performed in the (sub)mm.
Methods. We have obtained diffraction-limited (0.6″) 24.5 m images (field of view of ) of 14 well-known massive star formation regions with the COMICS instrument mounted on the 8.2 meter Subaru telescope. We construct azimuthally averaged intensity profiles of the resolved MYSO envelopes and build spectral energy distributions (SEDs) from archival data and the COMICS 24.5 m flux density. The SEDs range from near-infrared to millimeter wavelengths. Self-consistent 1-D radiative transfer models described by a density dependence of the form are used to simultaneously compare the intensity profiles and SEDs to model predictions.
Results. The images reveal the presence of discrete MYSO sources which are resolved on arcsecond scales, and, to first-order, the observed emission is circular on the sky. For many sources, the spherical models are capable of satisfactorily reproducing the 24.5 m intensity profile, the 24.5 m flux density, the 9.7 m silicate absorption feature, and the submm emission. They are described by density distributions with . Such distributions are shallower than those found on larger scales probed with single-dish (sub)mm studies. Other sources have density laws that are shallower/steeper than and there is evidence that these are viewed near edge-on or near face-on respectively. In these cases spherical models fail to provide good fits to the data. The images also reveal a diffuse component tracing somewhat larger scale structures, particularly visible in the regions S 140, AFGL 2136, IRAS 20126+4104, Mon R2, and Cep A.
Conclusions. We find a flattening of the MYSO density law going from scales probed with single-dish submm observations down to scales of 1000 AU probed with the observations presented here. We propose that this may be evidence of rotational support of the envelope. This finding will be explored further in a future paper using 2-D axisymmetric radiative transfer models.
Key Words.:
stars: formation - stars: imaging - stars: early type - infrared: stars - ISM: clouds1 Introduction
The early stages in the lives of massive stars are identified with highly luminous yet very cool objects deeply embedded in molecular clouds. Their emission is characterised by a steeply rising spectral energy distribution (SED) peaking around 100 m, which features strong silicate absorption. These properties are indicative of radiation reprocessed by a dusty circumstellar envelope. Measured bolometric luminosities are such that if a single main sequence star resides at the heart of the dusty envelope, it should have the ability to ionise its surroundings, yet only little (if any) recombination radiation is observed. This radio-quiet appearance of massive young stellar objects (MYSO) is unlike that of ultra-compact (UC) H ii regions (e.g. Hoare et al. 2007), and the latter can therefore be considered as a successor phase. The reason may be that the MYSO is actively accreting material from its surrounding environment quenching the development of an H ii region. The ongoing accretion would also give rise to bipolar outflow activity ubiquitously observed in massive star forming regions. It is clear that MYSOs are prime observational targets for addressing outstanding issues in our current understanding of massive star formation.
In this paper we address the radial structure of the MYSO dust envelope. It is determined by the forces that operate during the onset and the subsequent evolution of the initial molecular core. The radial density profile is predicted to be a powerlaw with a value for the power index that depends on the dominant physics. The exact power index can be extracted from the observables by the use of radiative transfer models. Spherical envelope models may be assumed for the dust that dominates the emission at wavelengths larger than m. At these wavelengths the SED of MYSOs (but also UCH iis) are observed to be remarkably similar, arguing for little deviation from spherical symmetry (Chini et al 1986; Churchwell, Wolfire & Wood 1990; Henning et al 1990; Hoare et al. 1991; Gürtler et al. 1991; Wolfire & Churchwell 1994; Faison et al. 1998; Hatchell et al. 2000; Van der Tak et al. 2000; Mueller et al. 2002; Beuther et al. 2002). At shorter wavelengths (m) the geometry of the envelope becomes important (Yorke & Sonnhalter 2002; Whitney et al. 2003). For example, under favourable inclinations, mid-IR radiation can be observed to originate directly from the surface of cavity walls that are sculpted by the polar outflows. In this case, the mid-IR photons are emitted by warm dust particles that have a clear line-of-sight to the star (e.g. De Buizer 2007). At even shorter wavelengths, near-IR photons from the (generally monopolar) reflection nebulae (e.g. Alvarez et al. 2004, 2005) may originate either from the stellar surface, an inner dust truncation structure or from an accretion disk. They can scatter and escape through existing inhomogeneities in the spherical envelope (e.g. Gürtler et al. 1991; Henning et al. 2000) and still suffer extinction from any foreground molecular cloud material (e.g. De Buizer, Osorio & Calvet 2005).
Here, we aim to constrain the radial density distribution on scales of 1000 AU using resolved 24.5 m emission. This constitutes an increase of a factor 10 in angular resolution compared to similar studies performed in the (sub)mm. We present diffraction-limited images at 24.5 m, the longest mid-IR wavelength amenable to high resolution imaging from the ground with large telescopes. This long mid-IR wavelength maximises the possibility of resolving the envelope emission because, due to the nature of the temperature gradients in the optically thick emitting region, the size of the emission region gets larger with increasing wavelength to the power of about 1.5, whilst the diffraction limit of the telescope only increases linearly with wavelength. We have selected a set of 14 well-known MYSO and imaged these at 24.5 m with the 8m Subaru telescope. The images have an angular resolution set by the telescope’s diffraction limit of 0.6″, corresponding to linear scales of 1000 AU for the average distance of 1.5 kpc to our target MYSOs. Most previous 10 m and 20 m imaging of MYSOs have been carried out on 4 m class telescopes where the (radio-quiet) objects are invariably unresolved (e.g. Mottram et al. 2007; De Buizer et al. 2000, 2005). Some work on 8-10 m class telescopes at 8-22 m has begun to resolve a few sources such as BN and source n in Orion (Shuping et al. 2004; Greenhill et al. 2004), but no detailed modelling of these data has been carried out.
We analyse the resolved emission in conjunction with the SED in terms of spherical dust radiative transfer models as calculated by DUSTY, and using background literature information for each individual case. We present simultaneous model fits to the 24.5 m intensity profile and the SED, that stretches from the near-IR to the mm wavelengths. It includes the silicate 9.7 m absorption profile thanks to ISO-SWS spectra for nearly the whole sample. The approach of simultaneously analysing the intensity profiles and SEDs follows van der Tak et al. (2000), Hatchell et al. (2000), Beuther et al. (2002), Mueller et al. (2002), Hatchell & van der Tak (2003), Williams et al. (2005). Most of the quoted work is exclusively aimed at (sub)mm wavelengths, and thus probing linear scales about a factor 10 larger than in the mid-IR. Constraints on the density distributions from (sub)mm and mid-IR are therefore highly complementary as they give insight into the evolution of the density distribution as function of radius.
This paper is organized as follows. Our observational data were taken with the Japanese 8.2 meter Subaru telescope on Hawaii in conjunction with the COMICS instrument. We give an overview of the instrument and detail the observations in Sect. 2. We present and discuss the morphology seen on the COMICS images in the subsections to Sect. 3.3 and Sect. 3.4, alongside the simultaneous modelling of the intensity profile and SED. We summarise the modelling part highlighting certain trends in Sect. 4. We discuss our findings and their consequences in Sect. 5 and conclude in Sect. 6.
| Date | Object | Integration | S/N | |
|---|---|---|---|---|
| (UT) | (sec) | |||
| 2002/12/15 | Asteroid #511 (P) | 502 | 1.8 | 900 |
| 2002/12/15 | Asteroid #51 (P) | 402 | 2.0 | 160 |
| 2003/06/17 | Cep (SL) | 402 | 1.3 | 1800 |
| 2003/06/20 | Cep (SL) | 402 | 1.3 | 1000 |
| 2003/07/14 | Cep (SL) | 101 | 1.5 | 180 |
| 2003/11/12 | Tau (SL) | 1204 | 1.2 | 800 |
| 2004/01/08 | Tau (SL) | 402 | 1.0 | 830 |
| 2004/05/05 | Cep (SL) | 201 | 1.4 | 790 |
| 2004/06/08 | Her (SL) | 100 | 1.2 | 630 |
| 2004/06/08 | Cep (SL) | 602 | 1.3 | 3000 |
| 2004/06/08 | Sco (SL) | 201 | 1.9 | 1200 |
| 2004/07/14 | Cep (SL) | 401 | 1.3 | 1500 |
| 2005/07/27 | Her (SL) | 201 | 2.6 | 160 |
| 2005/07/27 | Aql (SC) | 201 | 1.3 | 30 |
| 2005/12/13 | Tau (SL) | 401 | 1.3 | 430 |
| 2005/12/21 | Tau (SL) | 1203 | 1.4 | 620 |
| Region | Date | Integration | S/N | R.A. | Dec. | Ref. | offset | Source | Flux density | |
|---|---|---|---|---|---|---|---|---|---|---|
| (UT) | (s) | (h,m,s) | () | (″) | ID | (Jy) | ||||
| (1) | (2) | (3) | (4) | (5) | (6) | (7) | (8) | (9) | (10) | (11) |
| S140 | 2004/06/08 | 602 | 1.4 | 2000 | 22:19:18.3 | +63:18:49.3 | 1 | (0,0) | IRS1 | 1170 |
| (2,14) | IRS2S | 5 | ||||||||
| (0,18) | IRS2N: | 170 | ||||||||
| (10,3) | IRS3 | 180 | ||||||||
| M8E | 2004/06/08 | 802 | 1.4 | 1100 | 18:04:53.3 | 24:26:42.3 | 2 | (0,0) | IR | 210 |
| (-6,5) | HII | 30 | ||||||||
| (-6.5,0.5) | MIRS1 | 5 | ||||||||
| AFGL 2136 | 2005/07/27 | 201 | 2.5 | 170 | 18:22:26.5 | 13:30:12.0 | 3 | (0,0) | IR | 140 |
| AFGL 2591 | 2004/05/05 | 603 | 1.1 | 2000 | 20:29:24.9 | +40:11:20.3 | 4 | (0,0) | IR | 870 |
| (-5,-3) | HII | 170 | ||||||||
| (-7,9) | MIRS1 | 20 | ||||||||
| NGC 2264 | 2002/12/15 | 1306 | 1.9 | 1100 | 06:41:10.1 | +09:29:34.0 | 5 | (0,0) | IRS1 | 330 |
| S255 | 2003/11/12 | 1404 | 1.0 | 1000 | 06:12:54.1 | +17:59:25.1 | 6 | (0,0) | IRS3 | 170 |
| (-2.5,0.5) | IRS1 | 20 | ||||||||
| AFGL 5180 | 2005/12/20 | 1003 | 1.2 | 100 | 06:08:53.3 | +21:38:30.5 | 4 | (0,0) | IRS1 | 490 |
| (12,-4) | HII | 210 | ||||||||
| (2,2) | MIRS3 | 35 | ||||||||
| IRAS 20126 | 2005/07/27 | 401 | 1.3 | 60 | 20:14:26.1 | +41:13:32.5 | 7 | (0,0) | IR | 60 |
| Mon R2 | 2005/12/13 | 100 | 1.2 | 06:07:47.8 | 06:22:54.7 | 1 | (0,0) | IRS3 | 1150 | |
| (-31,3) | IRS2 | 40 | ||||||||
| (-33,17) | IRS5 | 70 | ||||||||
| AFGL 437 | 2005/12/21 | 401 | 1.3 | 80 | 03:07:24.6 | +58:30:44.4 | 8 | (0,0) | S | 30 |
| (0,10) | N | 30 | ||||||||
| (-6,6) | W | 200 | ||||||||
| AFGL 4029 | 2005/12/21 | 1203 | 1.3 | 80 | 03:01:31.3 | +60:29:12.9 | 9 | (0,0) | IRS1 | 70 |
| (24,1) | IRS2 | 70 | ||||||||
| AFGL 961 | 2003/11/12 | 1204 | 1.0 | 620 | 06:34:37.7 | +04:12:44.4 | 10 | (0,0) | E | 250 |
| (-5,-2) | W | 60 | ||||||||
| W3 | 2005/12/21 | 501, 100 | 1.4 | 02:25:41.4 | +62:06:21.8 | 11 | (0,0) | IRS5 | 1300 | |
| (3,-7) | IRS6 | 70 | ||||||||
| (-1,-12) | IRS7 | 160 | ||||||||
| (-2,11) | MIRS1 | 15 | ||||||||
| Cep A | 2004/07/13 | 602 | 1.4 | 70 | 22:56:18.0 | +62:01:49.5 | 12 | (0,0) | 440 |
(1) Hackwell et al. (1982); (2) Simon et al. (1984); (3) Kastner et al. (1992); (4) Tamura et al. (1991); (5) Thompson et al. (1998);
(6) Longmore et al. (2006); (7) Sridharan et al. (2005); (8) Wynn-Williams et al. (1981); (9) Zapata et al. (2001); (10) Castelaz et al. (1985);
(11) van der Tak (2005); (12) comparison with Spitzer images, see Fig. 29
2 Observations and data reduction
2.1 Observations with the COMICS instrument
Tables 1 and 2 summarise the 24.5 m observations of the 14 target MYSOs and the standard stars. All measurements were made using the mid-infrared imaging spectrometer COMICS (Kataza et al. 2000) at the Cassegrain focus of the 8.2 meter Subaru Telescope on Mauna Kea, Hawaii. Imaging mode of COMICS utilises a Raytheon 320240 Si:As IBC array, which is cooled by a Sumitomo 4-K Gifford-McMahon type cryo-cooler but usually operates at around 78 K because of the self-heating. The camera provides over-sampled diffraction-limited images at 24.5 m with a pixel size of 0.130.13 arcsec2 and a field of view of approximately 4030 arcsec2.
We used two different 24.5 m filters which are both manufactured by Infrared Multilayer Laboratory, University of Reading. The characteristics of these filters are summarised in Table 3, and the transmission curves, along with an atmospheric transmission model above Mauna Kea, are shown in Figure 1. As can be clearly seen in the plot, the new filter (Q24.5-NEW) is a much better fit to the small atmospheric window at 24.5 m. As a result, the whole array can be read out with the new filter, whilst only a part of the array is read out with the old one since radiation from the sky quickly saturates the well.
Chop-subtracted frames were stacked using the imalign task (with cubic-spline interpolation) in the iraf111iraf is distributed by the National Optical Astronomy Observatories, which are operated by the Association of Universities for Research in Astronomy, Inc., under cooperative agreement with the National Science Foundation. data reduction package. Flux calibration was achieved against either Cohen (Cohen et al. 1995; 1999) or Sloan (Sloan et al. 2003) standards. We selected stars at similar airmasses to the target MYSOs whenever possible; however, in some cases when this was not feasible, we scaled the standard flux to the airmass of the relevant object by the atmospheric extinction relationships measured on 2002/12/15 UT (0.57 mag per airmass) and on 2003/11/12 UT (0.56) for the Q24.5-OLD filter. Note that these extinction values would probably only apply to this specific filter, along particular lines of sight, and at the times of observations. In some other instances (e.g. 2005/12/20 UT), even this airmass correction was not possible due to lack of appropriate data, and we reluctantly accepted the airmass mismatch as additional uncertainty. We estimate the overall uncertainty in flux calibration to be of the order of 10%. The largest contribution usually comes from the absolute calibration uncertainty in the standard flux templates. Details of the target observations and extracted fluxes are given in Table 2. Images are not astrometrically calibrated. Positional offsets of the various sources in our images are with respect to the brightest 24.5 m source, generally identifiable with the brightest MYSO in each region presented in this paper.


| ID | Peak transmission | ||
|---|---|---|---|
| (m) | (m) | (%) | |
| Q24.5-OLD | 24.47 | 1.91 | 64 |
| Q24.5-NEW | 24.56 | 0.75 | 64 |
2.2 Point spread function reference stars
We spend a few words on the point spread function (PSF) reference objects, as they are crucial in our analysis of comparing model images to the resolved MYSO emission (see Sect. 3.3). All standard star observations are given in Table 1. To test the validity of both the PSF standards and the flux standards as a model for the instrumental PSF, we investigate their azimuthally averaged intensity profiles in Fig. 2. The figure makes clear that three of the flux standard stars are actually extended, and therefore do not qualify as a PSF standard. They are the following objects:
Cep is one of the largest stars in our Galactic
neighbourhood. The star was observed a total of six times with COMICS.
Detailed analysis shows this star to be extended in
such degree and complexity, that we report on this star in a separate
publication (de Wit et al. 2008).
Sco is a supergiant star undergoing mass-loss. Mid-IR
images at 12.5 m and at 20.8 m clearly show an extended distribution of
circumstellar dust (Marsh et al. 2001).
Her is an irregular variable M star. Although the star mimics a PSF
in the inner part of the profile (Fig. 2), its extent becomes apparent at radii . Interestingly, interferometric
observations of the star have been interpreted as showing a mass loss event
in the period 1989-1992. The material has an expansion speed of approximately
170 mas (Tatebe et al. 2007), and it
should have reached a distance of 2.5″ from the star at the time of the observations. This distance is comparable
to the distance where the excess emission becomes apparent.
As a consequence of the above discoveries, most observations do not have a concomitant PSF reference observation. In addition, the instrumental PSF shows a non-symmetric pattern due to the mirror support structure that rotates on the sky, making the interpretation of non-symmetric structure in the partially resolved sources taken at different times difficult. A comparison of the azimuthally averaged intensity profile of the six Cep observations taken over a period of more than 1 year shows however very few differences (see de Wit et al. 2008). This provides confidence in the stability of the (azimuthally averaged) COMICS PSF, and we therefore construct a single reference PSF from the remaining three genuine point sources ( Tau, and asteroids 51 and 511), which we use throughout the remainder of this paper.
| MYSO | Distance | ref | mod | dust | ||||||||||
|---|---|---|---|---|---|---|---|---|---|---|---|---|---|---|
| (kpc) | () | # | () | (K) | (AU) | () | () | (mas) | ||||||
| (1) | (2) | (3) | (4) | (5) | (6) | (7) | (8) | (9) | (10) | (11) | (12) | (13) | (14) | (15) |
| S140 IRS1 | 0.91 | 1, 15 | 1 | 1.0 | ISM | 1500 | 62 | 1250 | 32 | 69 | ||||
| 2 | 0.5 | ISM2 | 1000 | 18 | 750 | 63 | 138 | |||||||
| 3 | 1.5 | ISM2 | 1000 | 104 | 1000 | 90 | 199 | |||||||
| M8E-IR | 1.8 | 2 | 1 | 1.25 | ISM | 1000 | 64 | 3000 | 70 | 78 | ||||
| 2 | 1.0 | ISM | 1000 | 64 | 3000 | 81 | 90 | |||||||
| 3 | 1.5 | ISM | 1000 | 64 | 5000 | 61 | 68 | |||||||
| AFGL 2136 | 2.0 | 3, 16 | 1 | 1.0 | ISM | 1000 | 70 | 1000 | 124 | 123 | ||||
| 2 | 0.5 | ISM | 1000 | 38 | 750 | 120 | 119 | |||||||
| 3 | 1.5 | ISM | 1000 | 120 | 2000 | 139 | 139 | |||||||
| AFGL 2591 | 1.0 | 4 | 1 | 1.5 | ISM | 1000 | 170 | 5000 | 67 | 134 | ||||
| 2 | 1.0 | ISM | 1000 | 90 | 2000 | 49 | 98 | |||||||
| 3 | 1.0 | ISM | 1500 | 82 | 3000 | 33 | 66 | |||||||
| NGC 2264 IRS1 | 0.8 | 5, 17 | 1 | 1.5 | ISM | 1000 | 90 | 5000 | 31 | 77 | ||||
| 2 | 1.25 | ISM | 1000 | 100 | 2000 | 27 | 66 | |||||||
| 3 | 1.0 | ISM | 1000 | 40 | 2000 | 26 | 64 | |||||||
| S255 IRS3 | 2.5 | 6, 18 | 1 | 1.25 | ISM | 1000 | 70 | 5000 | 120 | 96 | ||||
| 2 | 1.0 | ISM | 1000 | 58 | 2000 | 127 | 102 | |||||||
| 3 | 1.5 | ISM | 1000 | 176 | 5000 | 149 | 119 | |||||||
| AFGL 5180 | 1.5 | 7 | 1 | 1.0 | ISM | 1000 | 200 | 1250 | 66 | 88 | ||||
| 2 | 0.5 | ISM | 1000 | 100 | 1250 | 59 | 79 | |||||||
| 3 | 0.0 | ISM | 1000 | 100 | 1250 | 43 | 57 | |||||||
| IRAS 20126 | 1.7 | 8, 19 | 1 | 0.0 | ISMz2 | 1000 | 116 | 1000 | 51 | 60 | ||||
| 2 | 0.5 | ISMz2 | 1000 | 130 | 1250 | 53 | 61 | |||||||
| 3 | 1.0 | ISM2 | 1000 | 184 | 1250 | 73 | 85 | |||||||
| Mon R2 IRS3 | 0.83 | 9, 20 | 1 | 1.0 | ISM | 1500 | 80 | 1000 | 31 | 74 | ||||
| 2 | 0.5 | ISM2 | 1000 | 16 | 750 | 64 | 154 | |||||||
| 3 | 1.5 | ISM2 | 1000 | 128 | 750 | 93 | 223 | |||||||
| AFGL 437S | 2.7 | 10, 21 | 1 | 0.0 | ISM | 1000 | 62 | 1000 | 42 | 31 | ||||
| 2 | 0.5 | ISM | 1000 | 82 | 750 | 60 | 44 | |||||||
| 3 | 1.0 | ISM | 1000 | 198 | 750 | 65 | 48 | |||||||
| AFGL 4029 | 2.2 | 11, 22 | 1 | 0.0 | ISMz | 1500 | 82 | 1250 | 17 | 57 | 15 | |||
| 2 | 0.5 | ISMz | 1000 | 86 | 1250 | 54 | 385 | 49 | ||||||
| 3 | 1.0 | ISMz | 1000 | 130 | 3000 | 63 | 1355 | 57 | ||||||
| AFGL 961E | 1.4 | 12, 23 | 1 | 0.5 | ISMz | 1000 | 32 | 750 | 38 | 25 | 54 | |||
| 2 | 0.0 | ISM2 | 1500 | 28 | 750 | 18 | 8 | 26 | ||||||
| 3 | 1.0 | ISMz | 1000 | 48 | 3000 | 43 | 239 | 62 | ||||||
| W3 IRS5 | 1.8 | 13, 24 | 1 | 1.0 | ISM | 1500 | 144 | 750 | 73 | 156 | 81 | |||
| 2 | 0.5 | ISM | 1500 | 106 | 750 | 78 | 359 | 87 | ||||||
| 3 | 1.5 | ISM2 | 1000 | 196 | 750 | 208 | 284 | 231 | ||||||
| Cep A | 0.7 | 14, 25 |
(1) Crampton & Fisher (1974); (2) Simon et al. (1985); (3) Kastner et al. (1992); (4) van der Tak et al. (1999); (5) Walker (1956); (6) Moffat et al (1979); (7) Snell et al. 1988; (8) Cesaroni et al. (2005); (9) Herbst & Racine (1976); (10) Alvarez et al. (2004); (11) Becker & Fenkart (1971); (12) Cohen et al. (1973); (13) Imai et al. (2000); (14) Evans et al. (1981); (15) Lester et al. (1986); (16) Kastner et al. (1994); (17) Harvey et al. 1977); (18) Jaffe et al. (1984); (19) Cesaroni et al. (1997); (20) Thronson et al. (1980); (21) Wynn-Williams (1982); (22) Beichman et al. (1979); (23) Harvey et al. (1977); (24) Ladd et al. (1993); (25) Evans et al. (1981)
3 Results
3.1 Brief description of the images
The 24.5 m images reveal that all principal MYSO sources in the fourteen targeted massive star forming regions are resolved. The sources are generally discrete and have fairly simple, circular morphologies on the sky suggesting that the emission is dominated by the circumstellar envelope. We compare the observed azimuthally averaged intensity profiles of the MYSO envelopes to 1-D dust radiative transfer calculations. For each target, we attempt to reach consistency between the spatially resolved 24.5 m emission and the emission seen at other wavelengths as represented by the SED. In addition, we describe the 24.5 m emission morphology in relation to known star formation activity in the following subsection.
3.2 Method of analysis
Model SEDs and images are calculated using DUSTY, a code that solves the scaled 1-D dust radiative transfer problem (see Ivezic & Elitzur 1997). We use a spherically symmetric dust distribution illuminated by a central, unresolved star. Numerical solutions are independent of the star’s bolometric luminosity, and the SED and images need to be scaled before making a comparison to the observations. The bolometric luminosity is the prime stellar parameter that sets the inner dust sublimation radius and thus the size scale of the envelope; an increase causes the size of the emitting region to be larger (as ). As a result the intensity profile strongly depends on the assumed for the model. In practice, we determine the model by minimising the difference between the model and observed SED. The model can differ significantly from the observed , but for each model fit our adopted procedure finds the closest match between the two. In some case this match is poor and results in a large difference in observed and model . Observed are listed for each target in Col. 3 of Table 4.
Other important model parameters are the outer radius of the envelope () and the total amount of dust. The latter is parametrised in DUSTY by the total optical depth . Higher values for these two parameters tend to increase the long wavelength flux levels. Of course, neither the total amount of dust nor the envelope’s outer radius can have any arbitrary value. We constrain the extinction by the 9.7 m silicate absorption feature that is generally found to be strongly in absorption among MYSOs. The required data were in most cases provided by mid-IR spectra taken with the short wavelength spectrometer (SWS, de Graauw et al. 1996) on board the ISO satellite (Kessler et al. 1996). The ISO data have been obtained from ESA’s ISO data archive.222Accessible at this URL http://iso.esac.esa.int/ida/
The MYSO SEDs are constructed form the measured COMICS fluxes (Table 2) and from literature data. For most targets continuum measurements in the IR and (sub)mm are taken from the catalogue compiled by Gezari et al. (1999, available through Vizier), and includes IRAS and MSX observations. These data were supplemented, where possible, with more recent observations, especially the compilation by Mueller et al. (2002). The continuum slope of the ISO-SWS spectrum longwards of the silicate absorption is used to complete the SED at mid-IR wavelengths. In three cases Spitzer MIPS data are available. We extracted the photometry applying the non-linearity correction recipe by Dale et al. (2007). Data taken with large beams () were generally avoided in the model fitting procedure. The following subsections, that are devoted to each object, highlight the used and discarded data in the fitting process. In the accompanying figures for each source open symbols are used to indicate large beam data not taken into account in the model fitting procedure, whereas filled symbols indicate the data that were actually used in the fitting procedure. Fluxes at wavelengths larger than 1.3 mm are excluded as they might be contaminated by free-free emission from ionized winds (e.g. Gibb & Hoare 2007). Overall, the constructed SEDs cover a wavelength range from about 1 m to 1 mm.
The model and observed images are compared in the fitting procedure by means of the azimuthally averaged intensity profile, normalized to its peak intensity. Model images are first scaled to model and convolved with the instrumental PSF. The intensity profiles are determined by binning and averaging the pixel counts in radial distance bins of size 0.13″. The centre of the profile is found by minimising the pixel scatter as function of radial distance. We indicate the range in pixel counts found at each radius bin by an errorbar in the presented intensity profiles.
In order to perform a systematic comparison between models and observations, we have generated a standard grid that consists of 120 000 DUSTY models. The grid probes the envelope parameter space and ranges in the following way:
-
•
Five radial density profiles. The radial density profile of the dust is described by a powerlaw of the form . The five density profiles cover power indices from to in steps of 0.5.
-
•
Four types of dust mixtures. The dust size distribution is MRN (Mathis, Rumple, & Nordsieck 1977), and remains untouched. We use DL (Draine & Lee 1984) opacities for silicates and combine this with either DL opacities for graphites or amorphous carbon (Zubko et al. 1996). Opacities are combined in a standard ISM mixture of 53% silicate and 47% graphite or a “twice ISM” mixture, i.e. 67% silicate and 33% graphite. Different mixtures may accommodate the silicate absorption profile for given total dust mass. The dust mixtures used have an opacity at 1.3 mm of between 0.3 – 0.4 gcm2, similar to the values of other types of dust in the literature, e.g. Ossenkopf & Henning (1994).
-
•
Two dust sublimation temperatures () : 1000 K and 1500 K. The value for this parameter is the only unscaled parameter in DUSTY. The value of has a large effect on the location of the dust sublimation radius but only a small effect on the normalized intensity profile. This is mainly due to a similar temperature dependence through the cloud with a very steep initial drop followed by a gradual decline. The similar temperature stratification leads to a similar normalized intensity profile. The different dust sublimation temperatures produce a different balance between short and long wavelength flux in the SED.
-
•
Three scaled sizes for the envelope. The outer radius is scaled to the inner sublimation radius. The standard model grid contains models with sizes 750, 1000 and 1250 times the inner dust sublimation radius, which correspond to typical envelope sizes of about 0.1 pc.
For each combination of these four envelope structure parameters, DUSTY calculates the resulting SEDs and images for an increasing total dust mass contained in the envelope. The grid goes from 2 to 200 in steps of 2, resulting in a grand total of 120 000 models. The envelope parameters adopted in this grid lead to typical temperatures found at the outer radius of 20 K for K for and 30 K for K with typical densities at of
The fitting procedure tries to find a model that fits the intensity profile and SED simultaneously. The SED fit includes the silicate absorption feature, slope of the ISO-SWS spectra, the far-IR SED peak and the (sub)mm continuum data. We aim to match the flux levels of the integrated (sub)mm continuum data providing additional constraints on the model parameters. The ISO spectra were rebinned logarithmically in 35 wavelength bins between 2.5 and 43 m in order to reduce its weight with respect to the continuum data. The binned spectrum probes the silicate feature at 9.7 m and the change in continuum slope longwards of it. In short, the fit procedure initially estimates the model by matching the overall shape of the scaled model SED to the observed one. DUSTY’s output images are then accordingly scaled and convolved with the instrumental PSF. A comparison of the model SED and intensity profile to the observed ones is made for all generated models. A simple tally is performed based on a goodness-of-fit criterion. We apply a least-squares criterion for the SED fit, and a weighted least-squares criterion for the intensity profile fit. The latter uses weights that are inversely proportional to the square of the range in normalized intensity at each radial distance bin. This range is represented by errorbars in the intensity profile plots for each MYSO target. The model that fits both sets of data best is the one with the highest average ranking in the two tallies. If no simultaneous satisfactory fits were obtained, we changed the emphasis of the procedure in order to get fits to intensity profile and the long wavelength range of the SED only, i.e. dropping the requirement of fitting the near-IR and mid-IR part of the SED. In some cases no satisfactory model was found within our standard grid, and we chose to explore the effects of changes in envelope size. This is discussed in more detail in the subsections dedicated to each source.
Finally, the parameters for the underlying star are the same for each model and are the following. of the MYSOs are indicative of early B-type stars, thus we adopt a of 25 000 K. There is only a negligible effect on the model dust emission for stars with slightly different effective temperatures. Distances for our sample stars were taken from the literature (see Table 4).
All final model parameters are listed in the modelling overview Table 4. For each MYSO we give the parameters for three models. Models #1 correspond to the overall best-fitting model. Models #2 and #3 constitute the best-fit for models restricted to density powerlaws with indices that bracket the powerlaw index of the best-fitting model #1, and are not the second and third best-fitting model. This is to illustrate how well the powerlaw index is constrained by the observables as this is our main priority; in some cases, models #2 and #3 do not provide acceptable fits. Therefore, the model parameters of Table 4 cannot be considered to represent the uncertainties on the model parameters. More detailed explanation can be found in the subsections dedicated to each MYSO.
3.3 24.5 m morphology and modelling
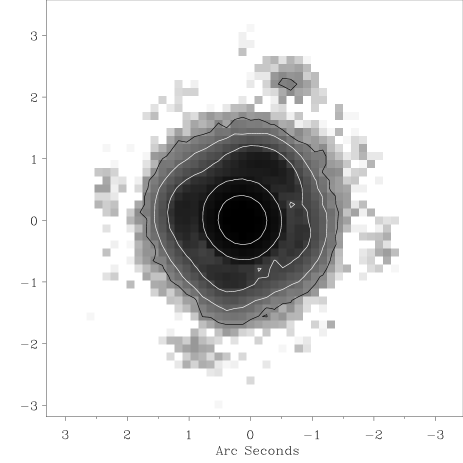
3.3.1 S140 (Figs. 3 and 4)
Description: At a distance of 910 pc, S140 is a bright-rimmed cloud that forms the
interface between an H ii region and the molecular cloud
L1204 (Crampton & Fisher 1974). S140 contains an IR cluster of at least
three sources (Beichmann et al. 1979).
The main CO outflow in the region goes SE-NW and a monopolar reflection nebula emanates from
IRS1 which is associated with the blue-shifted SE lobe (Hayashi et al. 1987; see also
Hoare & Franco 2007). The region displays spectacular
arc-like features that are seen in high angular resolution -band images
(Forrest & Shure 1986). They probably constitute
material swept-up by outflow activity in the region
(Weigelt et al. 2002). Recent cm continuum
and -band polarimetric imaging corroborate to suggest the presence
of a disk-like structure for IRS1 oriented in a NE-SW direction, perpendicular to the main outflow
(Hoare 2006; Jiang et
al. 2008).
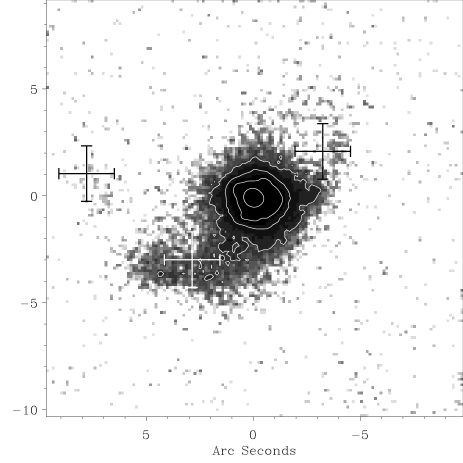
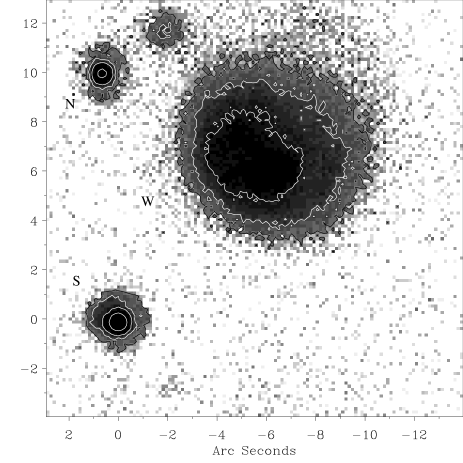
Mid-IR morphology:
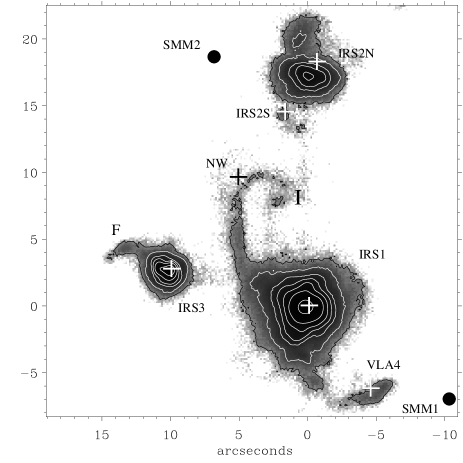
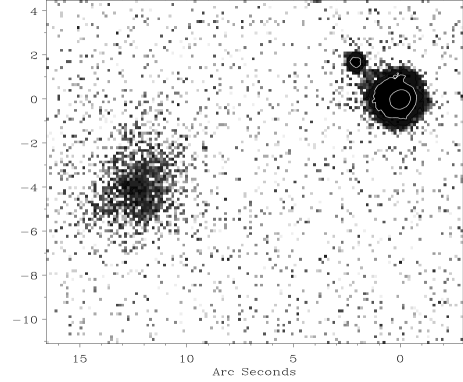
The COMICS image of the S140 region is presented in
Fig. 3. It reveals a wealth of features associated with
previously known objects, the positions of which are labelled in the
figure. Discrete peaks in mid-IR emission are found at the positions
of IRS1, IRS2, and IRS3. The bright emission within 3–4″ of IRS1 has a fairly
symmetric profile on the sky. The bright emission
region 17″ to the North of IRS1 coincides closely, but not exactly with
the position of IRS2N according to the positions given in Tofani et
al. (1995). IRS2S is identified with a point-like mid-IR
source just South of that. IRS3 is found to be a triple system (Preibisch et
al. 2003) and our image partly resolves
the secondary object (IRS3b) at a distance of 0.75″ East of the
primary source (IRS3a).
The COMICS image also shows faint structures of diffuse emission. An arc of
mid-IR emission concurs with the -band arc labelled “I” by Weigelt
et al. (2002). The curved wisp at
from IRS3 corresponds to feature “F” of Preibisch et
al. This feature is also known to have strongly polarised
emission and strong line emission, suggesting scattering
and shocked material.
Patches of diffuse emission are also found coincident with the radio
sources VLA4 and NW (see Evans et
al. 1989). This is the first time that the
two radio sources are seen in the mid-IR. Previously (Evans et
al. 1989), they were found coincident with the brightest parts of very
extended near-IR nebulosity.
Finally, we note that
the two submm emission peaks (Minchin et
al. 1995; Thompson et
al. 2006) do not have 24.5 m emission
counterparts.
Clearly the image reveals that
24.5 m emission is not restricted to compact MYSO envelope
emission. The emission has a faint diffuse character when it is associated with shocked dense material.
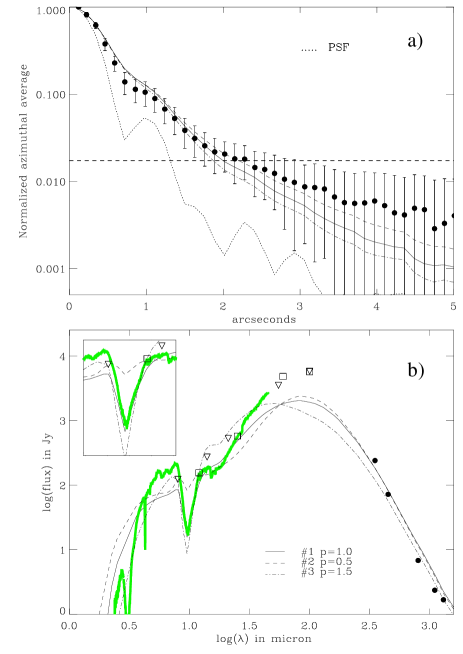
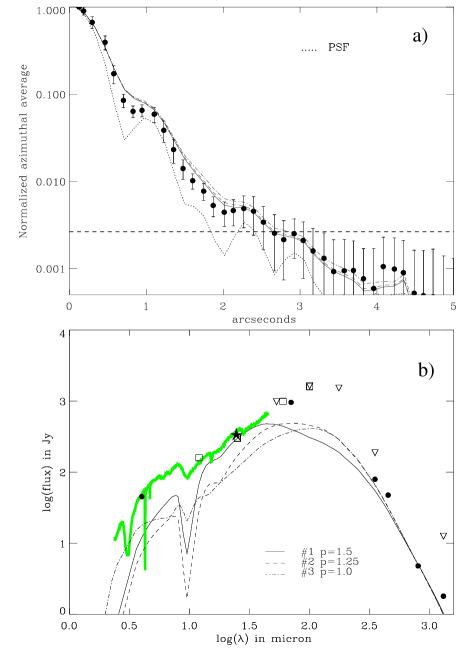
Model results:
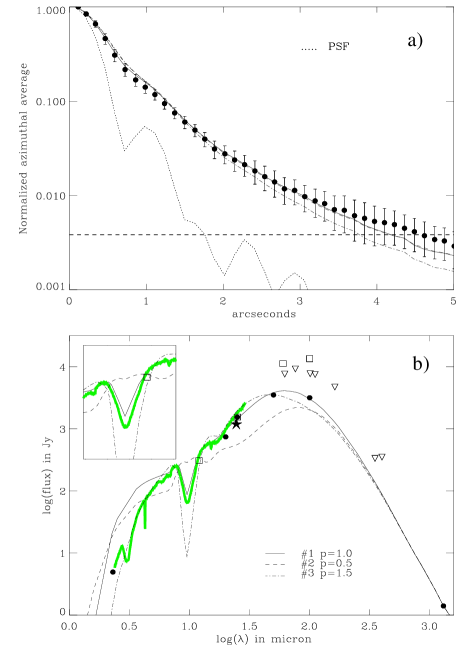
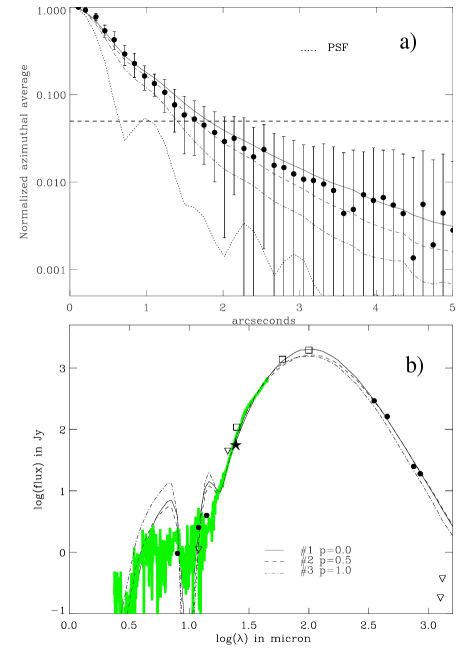
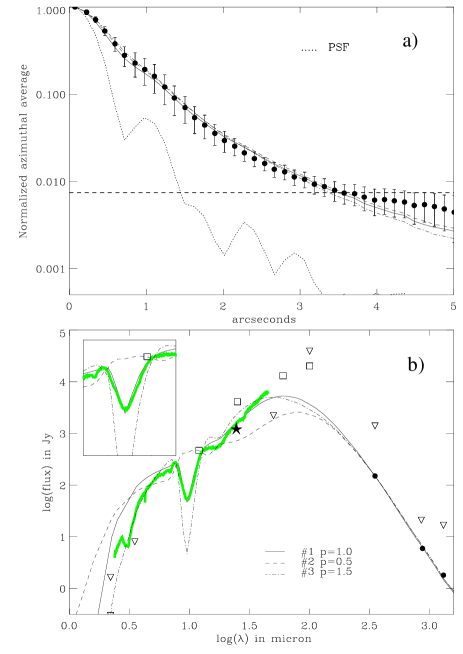
We focus the modelling on the main component in the region: bright MYSO IRS1. Its azimuthally averaged
24.5 m intensity profile is presented in panel a of Fig. 4. The errorbars cover the peak to peak range in
pixel counts measured at each radial
distance bin. Their small values indicate that IRS1 can be considered to be
symmetric to first order. We
build the IRS1 SED (Fig. 4) from literature data. Photometry obtained using image
restoration techniques applied to KAO continuum observations at 50 and
100 m by Lester et al. (1986) are preferred
over large beam data (50″) presented by Schwartz et al. (1983) and IRAS.
We adopt for IRS1 the IRAM measurement at 1.3 mm (11″ HPBW) by Gürtler et
al. (1991). Large beam far-IR and submm data
by Schwartz et al. (1983) and Gürtler et al. (1991) are
indicated by triangles in Fig. 4.
The intensity profile and the SED can be reproduced simultaneously by models with a radial density distribution. It is clear from Fig. 4 that the intensity profile can also be fit by model #2, and to a somewhat lesser extent, model #3. However, the simultaneous fit to the SED excludes shallow (model #2) and steep (model #3) models as viable alternatives. This is especially evident from their poor reproduction of the observed silicate absorption profile and the SED peak. On larger scales, modelling of the SED longwards of 100 m by Van der Tak et al. (2000) resulted in a density distribution. Mueller et al. (2002) find an overall best-fit to the SED and 350 m intensity profile for spherical models with .
3.3.2 M8E (Figs. 5 and 6)
Description: M8E consists of a bright IR source and
an optically thin radio source 8″ to its North-West (Simon et
al. 1984). The region shows evidence of a bipolar
CO outflow, but it is not clear which of the two sources powers it (Simon et al. 1984).
The IR object is resolved on scales of milli arcseconds by lunar occultation
observations at 3.8 m and 10 m. It can be interpreted as
consisting of two physically different components (Simon et al. 1985): a compact hot component and a broad cooler component.
The broad component, that has an angular size of 0.1″, does not correspond to the 30 K molecular cloud material
causing the SED to peak at 100 m, but is suggested to be a transition region
between relatively hot disk material and cold cloud material.
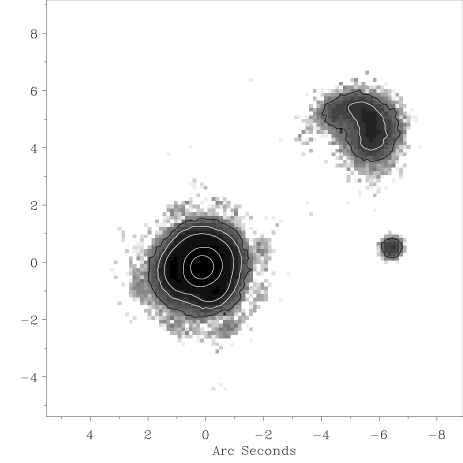
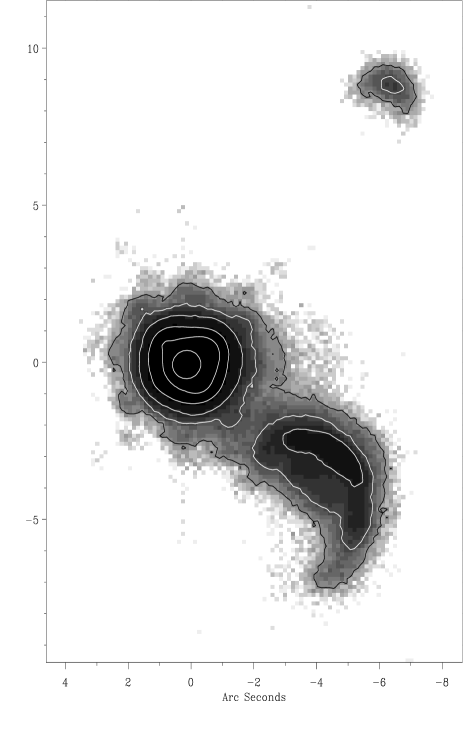
Mid-IR morphology: Fig. 5 shows the detection
of M8E-IR as a compact discrete source which is symmetric
to first order. The radio source emission is diffuse and has a cometary morphology. Its peak emission is found at a distance of
7.7″ from M8E-IR. A third source is detected 6″ West of M8E-IR.
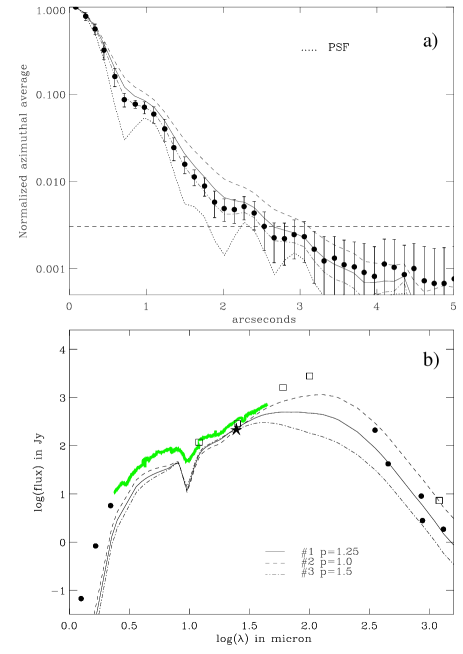
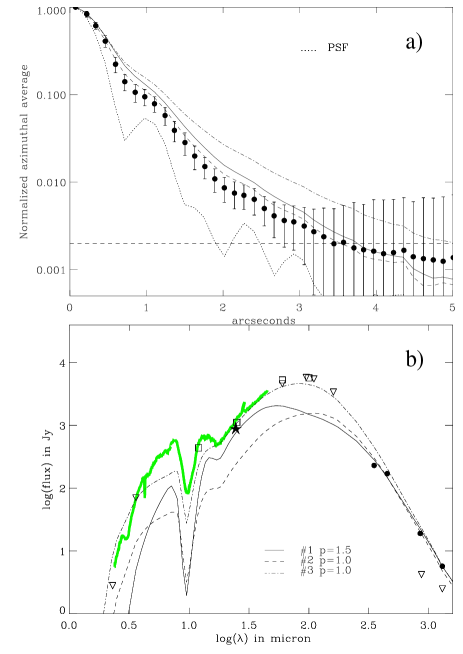
Model results: The primary source of M8E-IR continuum data is
from Mueller et al. (2002) and Gürtler et al. (1991). The six
(sub)mm continuum measurements have been done with various beamsizes between
19″ and 30″, except the 870 m one that was performed with a 9″ half-power beamwidth (Gürtler et al. 1991).
For reference, we also plot the 1.2 mm datapoint obtained by Beltrán et
al. (2006) with a half-power beamwidth of 26″ (open
square). It is clear that the intrinsic (sub)mm flux levels are uncertain, given
the spread in flux levels in this wavelength range. At the short wavelength region we use the measurements by Simon et al. (1985).
M8E-IR is compact and only marginally resolved. In fact, the intensity profile is too steep for the bolometric luminosity derived from the observed SED. Steeper radial density powerlaws (creating a more compact cloud structure) lead to steeper intensity profiles, yet this advantage is offset by a decrease in flux at the long wavelength end. A commensurate increase in bolometric luminosity is required to fit the (sub)mm, but this in turn makes the intensity profile too shallow. Choosing a smaller outer radius is marred with the same problem, as is increasing the dust sublimation temperature.
The model that fits the intensity profile best has a powerlaw. Density profiles as shallow as are incompatible with the intensity profile. In order to increase the (sub)mm flux levels (without increasing the bolometric luminosity) we make the cloud larger than the sizes assumed in our model grid. Depending on the intrinsic (sub)mm flux levels, to are preferred with an outer radius of 3000 times the dust sublimation radius, or pc. The flux levels of the ISO-SWS spectrum cannot be reproduced by any model SED. On scales of 1000–10 000 AUs, the 350 m intensity profile is best represented by models with radial density distributions (Mueller et al. 2002), i.e. too steep to reproduce the 24.5 m intensity profile.
3.3.3 AFGL 2136 (Figs. 7 and 8)
Description: A three-lobed near-IR reflection nebula littered
with some 30 faint point sources is illuminated by the dominant source IRS1.
Near-IR polarisation indicates that IRS1 is illuminating conical cavities
within a dusty envelope (Kastner, Weintraub, & Aspin
1992). IRS1 is the driving source of an arcminute-scale
bipolar CO outflow with a P.A. of 135° (Kastner et al. 1994).
Weak, optically thick radio emission originating from IRS1 is detected by Menten & van
der Tak (2004).
The radio source is somewhat elongated in the South-Easterly direction.
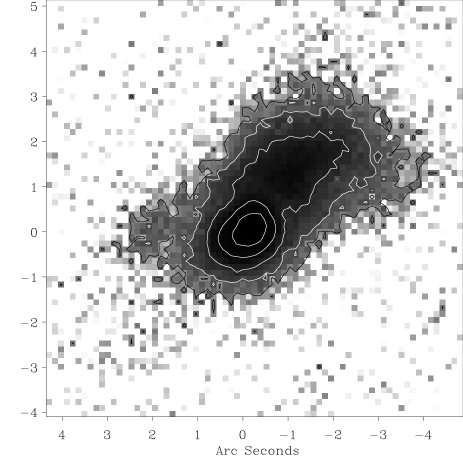
Mid-IR morphology: The COMICS image in Fig. 7 reveals one
dominant source, IRS1, that is resolved and symmetric. The image is not very deep, and the envelope can be
traced out to 3″, where noise starts to dominate. IRS1
displays an extended wing to the South-East coincident with the near-IR “South”
lobe of the nebula. A faint counter wing to the North-West would correspond to
the “West” lobe. There are also traces of a 24.5 m counterpart to the faint
“East” lobe (terminology from Kastner et al. 1992). The bright South lobe extends at roughly
the same P.A. as the outflow activity.
Model results: The SED is built using the set of (sub)mm data from
Kastner et al. (1994) obtained with the JCMT (16.8″–18.5″ HPBW), except
the datapoint at 350 m which is from Mueller et al. (2002). IRAS measurements agree closely with the Harvey et
al. (2000) data at 50 and 100 m .
The intensity profile and SED of AFGL 2136 are best fit by a model. None of the models that can reproduce the intensity profile do a particular good job in reproducing the SED’s short wavelength range, i.e. m. At larger spatial scales, Mueller et al. (2002) and van der Tak et al. (2000) prefer steeper models with and , respectively. Harvey et al. (2000) find reasonable fits to the 50 and 100 m intensity profiles and the SED, by dividing a model envelope in a high and low optical depth “hemisphere”. We also find that certain models are capable of nicely fitting the full SED longwards of 5 m (not shown in Fig. 8), but they do not reproduce the 24.5 m intensity profile. The model shown in Fig. 8 does reproduce the intensity profile, but fits the SED worse than our preferred model.
3.3.4 AFGL 2591 (Figs. 9 and 10)
Description: Various aspects of the AFGL 2591 envelope are
discussed in van der Tak et al. (1999)
using an extensive set of line and continuum observations. The authors
conclude that the mid-IR and far-IR emission originates from the envelope,
and that the line-of-sight to the source nearly coincides with the
opening cone carved by an East-West oriented bipolar CO outflow. There
is ample evidence that the circumstellar material is not distributed in a spherically
symmetric fashion and that a low-opacity pathway close to the
line of sight has important effects on the source’s appearance (Preibisch et al. 2003).
Mid-IR morphology: The COMICS image presents three
sources: bright IRS1, a cometary shaped emission feature to the
South-West, and a small emission region to the North-West. IRS1 is so bright that the
spider diffraction pattern and the detector cross-talk (the vertical
dark lane) are visible in Fig. 9. The
cometary shaped feature to its South-West closely follows the optically
thin H ii region VLA1 (Wynn-Williams et
al. 1977; Trinidad et al. 2003).
The relative position of the source at the Northern rim with respect to the other two
is consistent with 8 GHz source “n4” from Tofani et al. (1995).
Model results:
In Fig. 10, we use JCMT submm data from Jenness et
al. (1995), and CSO data from Mueller et al. (2002),
that have comparable beamsizes (18″ and 14″, respectively). At mm wavelengths we show data from
Gürtler et al. (1991) and one datapoint at 1.3 mm from Walker, Adams
& Lada (1990). The Gürtler et al. data
were taken with a beam of 10″ whereas the Walker et al. data have a 30″ beam, possibly
explaining the flux level difference between these two sets. The far-IR KAO data of
Lada et al. (1984) closely corresponds
to the IRAS 60 m and 100 m photometry.
AFGL 2591 IRS1 presents an interesting case, as no simultaneous SED and intensity profile fit can be obtained. The bolometric luminosity implied by the observed SED impedes any reasonable model fit to the intensity profile (see e.g. the dot-dashed model in Fig. 10a and b). We attempt to find a solution by simply fitting the (sub)mm SED and intensity profile. The compromise that does fit the 24.5 m flux and (nearly) the intensity profile is given by a model with a large outer radius of (1.6 pc). The discrepancy found between spherical models and AFGL 2591 is not limited to the mid and near-IR but is still severe at far-IR wavelengths. Such models require a substantial revision of the object’s bolometric luminosity. In other words, the source is more compact than predicted by spherical models. A demonstration of a more appropriate 2-D modelling applied to this source is reported in Preibisch et al. (2003). These authors using speckle interferometry probing scales of 170 AU. They are able to model a resolved structure either as the inner rim of a circumstellar disk or as the dust sublimation radius of the MYSO envelope.
3.3.5 NGC 2264 IRS1 (AFGL 989, Figs. 11 and 12)
Description: A multi-wavelength study by Schreyer et al. (2003)
suggests that NGC 2264 IRS1 is a young B-type star surrounded by
low-mass companions located in a low-density cavity of a
clumpy, shell-like, and dense cloud remnant.
NGC 2264 IRS1 shows
evidence for a CO outflow oriented along our line of sight (Schreyer
et al. 1997). Attempts to resolve sub-arcsecond structure
related to the CO outflow cavities in the near-IR with HST (Thompson
et al. 1998) and using speckle techniques (Alvarez et
al. 2004) failed. A reflection nebula on scales of arcseconds
is clearly visible in the optical (Scarrott & Warren-Smith
1989) and near-IR (Schreyer et al. 1997).
Mid-IR morphology: The COMICS image shows a single, symmetric object (IRS1).
Most of the substructure seen in the image are diffraction patterns.
Model results: The model fits to SED and intensity profile are
presented in Fig. 12. IRS1 coincides with submm source MMS5 (Ward-Thompson et
al. 2000; Peretto et al. 2006) if one takes the correct near-IR
coordinates (from 2MASS: and ) and the phase-referenced map by Nakano et al. (2003).
We emphasise that the often reported lack of (sub)mm emission of IRS1 is due to wrong coordinates for IRS1
combined with poor astrometry (Ward-Thompson et
al. 2000; Schreyer et
al. 2003; Nakano et
al. 2003; Peretto et
al. 2006). Far-IR (25 m and onwards)
observations presented in the literature are done with beams larger
than 20″ (Harvey, Campbell & Hoffmann 1977; Chini et
al. 1986; IRAS) and are considered to be upper
limits. The model fit uses the JCMT and IRAM (sub)mm data presented in Ward-Thompson et al. (2000) with
beam FWHM of 6″, 8″, 13″ and 12″ for the 350, 450, 800 and 1300 m data, respectively.
Archive Spitzer 70 m MIPS data are available for IRS1. We extracted the photometry applying the non-linearity correction recipe of Dale
et al. (2007). A 70 m flux value of 960 Jy for IRS1 is used in the model fits.
The modelling indicates that bolometric luminosities that generate reasonable model fits to the intensity profile, find a rough correspondence with the mid-IR flux levels only if the powerlaw exponent equals . The 70 m MIPS is not attained by any model. It is clear that any spherical model aimed at fitting the far-IR or (sub)mm part of the SED would need much larger luminosities, which is incompatible with the 24.5 m intensity profile.
3.3.6 S255 (Figs. 13 and 14)
Description: The region is dominated by two near-IR
sources (NIRS1 and 3)
and their bipolar IR reflection nebulae that
were initially identified as the single source IRS1 (Beichman et al. 1979; Tamura et al. 1991; Itoh et
al. 2001). High resolution near-IR speckle observations by
Alvarez & Hoare (2004) resolve the bipolar reflection nebula of
NIRS1 (the Western source), revealing it to be twisted in an “S” shape.
High resolution Subaru near-IR polarimetric data indicate a depolarisation plane
perpendicular to the near-IR bipolar nebula, suggesting the presence of a disk
(Jiang et al. 2008).
Mid-IR morphology: The COMICS image shows NIRS3 to be the dominant source at
24.5 m. Both mid-IR sources are found to be symmetric and resolved.
Model results: We focus our analysis on the bright source
NIRS3 (the Eastern source) for the SED and intensity profile fit. The spectral range of the
ISO spectrum does not include the 9.7 m silicate feature. Instead we use the spectrum
published in Willner et al. (1982), that describes the depth
of the feature, but does not constrain the slope of the continuum
longwards of it. The short wavelength range of the Willner et al. spectrum
corresponds well with photometry taken by Evans et
al. (1977). The SED uses
(sub)mm data from the combined “core-envelope” emission at
350 m with a FWHP of 30″from Metzger et al. (1988), and
measurements (FWHP of 40″) by Richardson et al. (1985).
The mm measurement is by Chini et
al. (1986a) obtained with the IRTF with a 90″ beamsize. Other sets of (sub)mm points
with higher fluxes are available in the literature and are represented
by open triangles (Richardson et al. 1985; Metzger et al. 1988; Klein
et al. 2005). The total COMICS flux level (i.e. NIRS1 and 3 taken together)
is within 5% of the MSX flux. More
emission structure is hidden in the IRAS beam (see e.g. Longmore et al. (2006)
for larger scale 18.7 m images).
S255 IRS3 constitutes a source that is mildly resolved at 24.5 m . The intensity profile for IRS3 has been obtained by excluding the region between P.A. 45°and 135°, where emission from IRS1 dominates. In Fig. 14 the observations are compared to three spherical envelope models, the parameters of which are listed in Table 4. The model with a radial density distribution with power exponent best fits both the SED and intensity profile. The model is clearly excluded as it requires high optical depths not substantiated by the silicate absorption profile. The case of S255 IRS3 is similar to the one encountered for M8E-IR. The models are required to have large envelopes which increase the long wavelength flux. This can be achieved without changing the bolometric flux, keeping the intensity profile unchanged.
3.3.7 AFGL 5180 (Figs. 15 and 16)
Description: AFGL 5180 has
a blueshifted CO flow with a P.A. of (Snell et al. 1988). Saito et
al. (2006) show that the IRAS point source breaks up into two main
(sub)mm cores (see also Minier et al. 2005). One of these
cores is centred on the near-IR source NIRS1 as identified by Tamura et
al. (1991). The region reveals an intricate collection of mm
cores mixed in with various near-IR sources (Tamura et
al. 1991; Saito et al. 2007).
Mid-IR morphology: At 24.5 m and at the resolution of Subaru,
AFGL 5180 consists of three sources: one extended source and two point-like sources. We follow
the nomenclature by Tamura et al. (1991), in which the
main discrete source can be identified as NIRS1 and the diffuse source as NIRS2.
The region was recently imaged by Longmore et al. (2006) in
the mid-IR. Their deconvolved images at 7.9 m shows that NIRS1 itself
consists of three components that have a mutual distance of about 1″.
The COMICS image shows that NIRS1 is somewhat asymmetric,
but it is not resolved in multiple sources.
Model results: We concentrate our discussion on NIRS1, the main
mid-IR source. Model comparisons to the observations
are less well constrained than in the previous cases, because NIRS1 lacks
a 10 m spectrum. An independent measure of the total optical depth is
therefore absent. We use the (sub)mm photometry from Gear et al. (1988) and
Thompson et al. (2006). The Gear et al. data have FWHM beamsizes of about an arcminute,
whereas the Thompson et al. data are taken with SCUBA with FWHM beamsizes of 8″ and 14″ for the 450 m and 850 m observations.
The far-IR datapoint is from Ghosh et
al. (2000). For the mid-IR we use the MSX photometry, that
have a good correspondence with the IRAS data points. We find
reasonable fits to the intensity profile for , and
radial density distributions (see Fig. 16),
but the MSX and IRAS points in the SED are better reproduced by the
model. Any steeper distributions may provide equally good fits, except
that they would require optical depths exceeding
and much larger outer radii then adopted in our grid, which are
typical for most sources in our sample. The model
already requires a comparatively large optical depth with respect to the other
MYSO envelopes for it to fit the MSX data.
3.3.8 IRAS 20126+4104 (Figs. 17 and 18)

Description: IRAS 20126 is one of the best examples of a relatively massive young star that
is actively fed by an accretion disk. The star is thought to have a mass of approximately
(Cesaroni et al. 2005). The system is known to show
jet/outflow phenomena at a P.A. of about (see Cesaroni et
al. 2005; Su et al.
2007), with the jet oriented
almost perpendicular to the line of sight (Cesaroni et al. 1999). At wavelengths shorter than
20 m a “dark lane” separates two emission regions (Sridharan et
al. 2005; De Buizer 2007). This morphology
could be either due to the presence of two tight clusters (in which
case the dark lane does not correspond to a physical structure) or
due to a silhouetted disk with emission emanating from the cavity walls of the outflow either side of
the disk (De Buizer 2007).
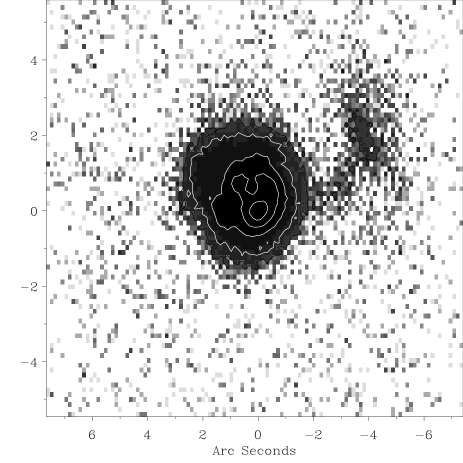
Mid-IR morphology: The COMICS image consists of two
emission regions. The morphology of the North-West source (source “5” in De Buizer 2007) corresponds to the one
presented in Shepherd et al. (2000) at 17.9 m and coincides with the
direction of the outflow. The South-Eastern peak emission overlaps the two
sources that are seen separated by a dark lane at shorter wavelengths. No
separation due to a dark lane is detected, although it is extended
perpendicular to the dark lane seen at shorter wavelengths.
The two
sources have a separation of 0.7″ in 18.3 m images by De
Buizer (2007). The somewhat lower resolution at 24.5 micron is probably partly
responsible for the failure to separate the two sources. In addition,
it seems likely that lower extinction and thermal emission from the putative dark lane
itself could be blurring the distinction between the two emission
components. It would argue in favour of the dark lane being a physical
structure rather than a clearance of emitting material as suggested in
De Buizer (2007).
Model results:
The ISO-SWS spectrum has a low SNR at wavelengths shorter than
10 m. This includes the silicate absorption profile, inhibiting a
independent measure of the envelope’s optical depth. A sharp rise of
the spectrum towards longer wavelengths indicates a very high
extinction.
In the model fits we use the photometry collected by
Hofner et al. (2007, and references therein). We fit only
the large beam data presumably corresponding to the dusty halo. The submm observations are obtained
with the JCMT by Cesaroni et al. (1999) with HPBW between 7″ and 14″. The intensity profile
is obtained from the region that excludes emission from the North-Western source.
We find good simultaneous fits to both intensity profile and SED, with a preference
for flat radial density distributions with powerlaw indices and .
Steeper density distributions are not able to fit the 24.5 m intensity profile. These values for the density distribution power index are at odds
with Hofner et al. (2007) and van der Tak et al. (2000). The former
find consistency between the observed SED and what one would expect from an
accretion disk embedded in a spherical infalling halo (on scales of 10″)
with . Van der Tak et al. (2000) find , on scales larger than
the ones probed by the 24.5 m image.
3.3.9 Mon R2 (Figs. 19 and 20)
Description:
The central region of the Mon R2 cloud consists of at least five
bright IR sources within pc (Beckwith et
al. 1976). The region shows complex submm
dust continuum emission which is well illustrated by the 850 m map by Giannakopoulou et al. (1997).
High resolution near-IR imaging (0.075″ resolution)
resolves the brightest mid-IR source (IRS3) into a triple system surrounded by strong diffuse
nebulosity (Preibisch et al. 2002).
Mid-IR morphology:
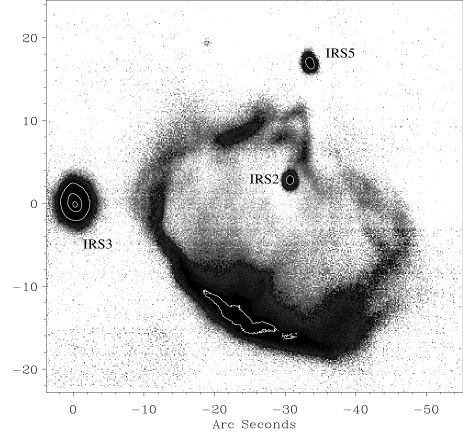
The COMICS mosaic in Fig. 19 shows IRS3 to be the dominant discrete source at 24.5 m.
The large, 30″ scale mid-IR shell structure is identifiable in near-IR
continuum emission in which case it is due to dust scattering
(Howard et al. 1994). Its morphology corresponds
roughly to the extent of the blister H ii region (Massi et
al. 1985). If we compare the mid-IR image with these maps,
we may identify the 24.5 m emission with the walls of the ionized
region. Maximum intensity
along the mid-IR ridge corresponds to the location of the source IRS1. The image
does not reveal any point source at this position. IRS2, IRS3 and IRS5 are all
observed to be extended sources. IRS3 is elongated with a P.A. along the
direction of the main binary (Preibisch et al. 2002).
Model results: Submm and mm imaging at 870 m and 1.3 mm
(HPBW of 18″ and 23″, respectively) by Henning et al. (1992)
resolve and identify the various components of the cloud with
the IR sources. We show in Fig. 20 the intensity
profile and SED fits to IRS3, the most luminous mid-IR source of the
region. Fig. 20b also shows the Mueller et al. (2002) compilation of
continuum measurements at the long wavelengths, including the 350 m CSO measurement (HPBW 14″). The flux level of the
ISO spectrum corresponds closely to the COMICS flux measurement. The
intensity profile levels out at distances which is probably
due to contribution in flux by the diffuse emission in the region.
The case of Mon R2 IRS3 is similar to S140 IRS1. Simultaneous model fit to the intensity profile and SED shows that models with a radial density profile of are preferred. Again steep radial profiles are excluded as they require high optical depths in order to provide a good fit to the intensity profile.
3.3.10 AFGL 437S (Figs. 21 and 22)

Description: AFGL 437 is a compact cluster of few dozen near-IR
sources located at a distance of 2.7 kpc (Wynn-Williams et al. 1981;
Weintraub & Kastner 1996). The cluster is
dominated by four bright sources 437N, S, E and W. The source
437W dominates the radio emission, whereas only weak radio emission is
measured towards the 437S. (Kurtz, Churchwell, & Wood
1994; Torrelles et
al. 1992). Alvarez et al. (2004) resolve a
monopolar sub-arcsecond near-IR nebula from 437S. Water masers have
been detected towards 437W and 437N (Torrelles et al. 1992).
Weintraub & Kastner (1996) find that 437N actually breaks up into two
components (see also Rayner & McClean
1987). The South-Eastern source of the two (named
WK34) is the most embedded and found to be responsible for the
region’s molecular outflow and the dominant source of the near-IR
reflection nebula (see also Meakin et
al. 2005).
Mid-IR morphology:
The COMICS image is dominated by the UCH ii region associated
with 437W. No discrete counterpart is found for 437W, only a diffuse
emission region. The 437N source is resolved into two components,
with the driving source WK34 the most luminous of the two. Of the 4
sources detected, 437S is the most luminous and marginally resolved by
our observations at 24.5 m.
Model results: We
concentrate our analysis on 437S. Submm and mm observations were
performed by Dent et al. (1998) with the JCMT at four wavelengths with
beamsizes between 16″ and 19″. The ISO-SWS spectrum of the
region is dominated by emission from the H ii region and is
discarded. Instead we use the 10m photometry of 437S taken by
Wynn-Williams et al. (1981). The model
fitting procedure discards the IRAS photometry, but takes into
account the COMICS flux measurement.
The spatial information derived from the marginally resolved source is not enough to strongly constrain the various radial density distributions. We show in Fig. 22 three models that reproduce the intensity profile and the continuum emission in the SED. We find that profiles require large optical depth in order to fit the (sub)mm and the 24.5 m data. This seems to be excluded by the silicate absorption profile. We therefore prefer rather shallow radial density distributions with or , but with considerable uncertainty.
3.4 Complex sources
MYSO sources presented in this section show evidence for multiple condensations within 1″ of the profile centre (AFGL 4029, AFGL 961, and W3 IRS5). Azimuthally averaged intensity profiles yield consequently large uncertainties, which constrain the models only little. In the case of the fourth source presented in this section, the Cep A star forming region, no discrete central source could be identified at all. We discuss the 24.5 m images alongside some literature background for each of these four objects.
3.4.1 AFGL 4029 (Figs. 23 and 24)

Description: Beichman et al. (1979) have
shown that the region consists of two sources at 10 and 20 m,
separated by about 20″. Both mid-IR sources have radio emission
(Kurtz et al. 1994). IRS1 shows evidence for outflow
activity. Zapata et al. (2001) find IRS1 to consist of a
double radio source, interpreted to be a binary object. They identify the Southern of the two sources
responsible for the outflow activity.
Mid-IR morphology:
The COMICS image reveals two emission regions. A compact emission
region identified as IRS1 which is shown in Fig. 23, and a
diffuse emission region associated with IRS2 located at 20″ from
IRS1 (not shown in Fig. 23). IRS1 shows a
discrete source with evidence for at least two condensations, the
Southern being the brightest one. In addition at least two bands of emission
are located within the inner 2″, rendering IRS 1 a rather patchy
source at 24.5 m. Finally, IRS 1 has an extended wing (4″)
to the West. Scattered light emission and thermal emission due to extended nebulosity
to the West of IRS1 is discussed in Deharveng et al. (1997) and Zavagno et al. (1999).
The 24.5 m morphology of IRS1 follows closely the
radio morphology as presented in Zapata et al. (2001). The
mid-IR wing is possibly the counterpart to the East-West extension seen
in high-resolution radio maps.
Model results:
The mid-IR part of the SED is adopted from data presented in Zavagno et al. (1999). IRAM 1.27 mm flux (beamsize 15″)
is taken from Klein et al. (2005), and submm SCUBA
fluxes (beamsizes of 8″ and 14″ for the 450 m and 850 m) are presented in Di Francesco et al. (2008) . Finally
a Spitzer MIPS flux measurement gives a flux density of 680 Jy for this source.
AFGL 4029 presents an intensity profile that is characterized by a large scatter in intensity, as represented by the errorbars in Fig. 24, due to the presence of patchy emission within . The lack of a 10m spectrum for the source also complicates the analysis. The data of Zavagno et al. (1999) cover the wings of the silicate absorption profile, providing some constraints. Although the intensity profile shows a large scatter, simultaneous model fits to SED and intensity profile are hard to find; the basic problem being the extent of the source. This translates into a very luminous object, incompatible with the SED. In Fig. 24, we show models with relatively flat density profiles ( or ), steeper profiles are incompatible with the intensity profile.
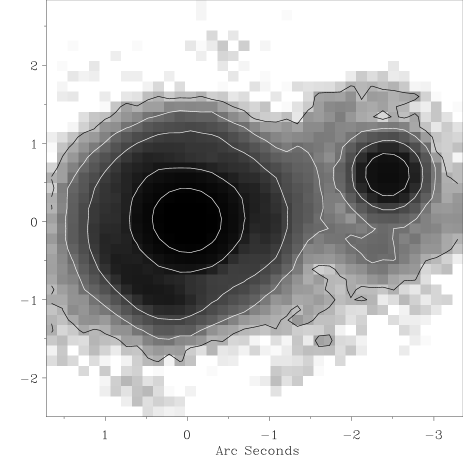
3.4.2 AFGL 961 (Figs. 25 and 26)
Description: The source is a well-known double object located in
the outskirts of the Rosette Nebula (Lenzen et al. 1984) and
surrounded by a stellar cluster (Aspin 1998). The East and
West components have a separation of about 6″and
display outflow phenomena (Lada & Gautier 1982).
Snell and Bally (1986) determined the radio spectral index, finding it to be
consistent with an ionized wind.
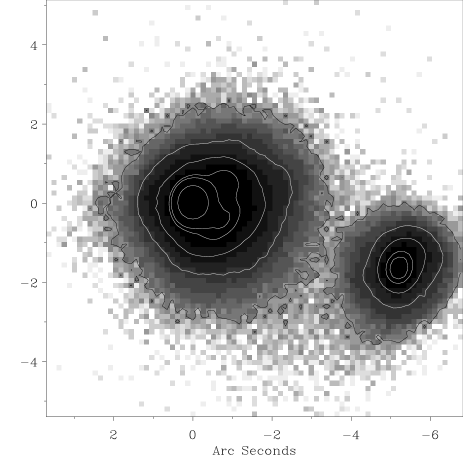
Mid-IR morphology: The dominant source in the COMICS image is
AFGL 961E. The Western source 961W is discrete and somewhat extended in
a North-Westerly direction. AFGL 961E displays two diffuse blobs to the
North-West and South-West of the peak emissions.
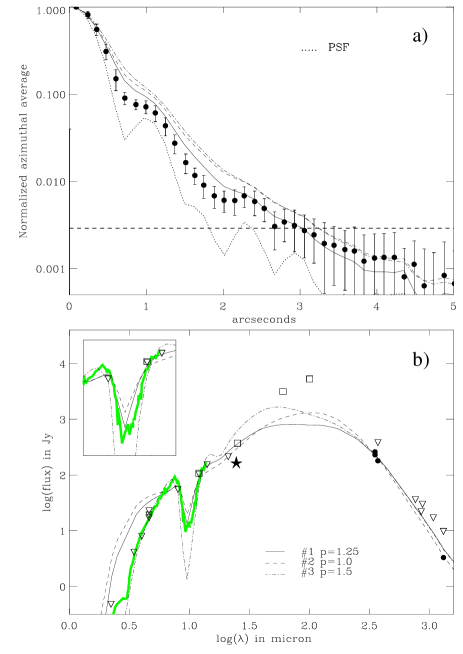
Model results:
Chini et al. (1986) model this source and find good correspondence
with a spherical model for wavelengths shorter than 100 m. An
emission excess with respect to their spherical model is found for
wavelengths longer than this. We use SCUBA measurements at
450 m and 850 m (beamsizes of 8″ and 14″), which are significantly lower. Further,
we use the spectrum taken by Willner et al. (1982), mid-IR photometry from Cohen
(1973), Simon & Dyck (1977), and the
350 m IRTF measurement (HPBW 90″) is from Gürtler et al. (1991). We measured the
70 m flux from archival Spitzer MIPS data, finding a flux of 720 Jy for the source.
The broad SED and intensity profile are well fit by density powerlaws
with a moderate optical depth. Steeper density profiles do not fit the
intensity profile, and would additionally require either a higher
optical depth or a much larger envelope outer radius in order to fit
the submm points.
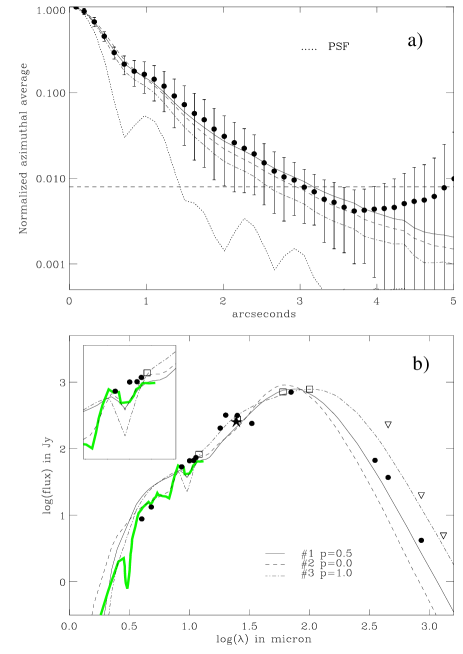
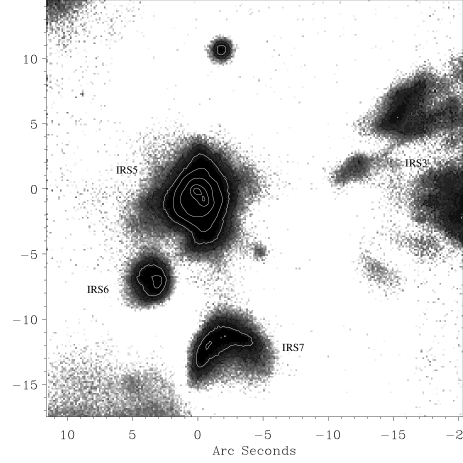
3.4.3 W3 (Fig. 27 and 28)
Description:
W3 is an important and complex region containing objects in various
stages of the formation process (Wynn-Williams et al. 1972;
Claussen et al. 1994). One prominent source in the region is
IRS5, which consists of a double source (1″ separation) at
infrared wavelengths (Howell et al. 1981; van der Tak et
al. 2005). IRS5 was discovered to
harbour at least seven very compact radio continuum sources within a
radius of 0.03 pc (Claussen et al. 1994). A number of these
are likely to be shock excited clumps in the surrounding molecular
material, driven by embedded OB stars (Wilson et
al. 2003;van der Tak et
al. 2005). Water masers in IRS5 have been
shown to trace two outflows, both in roughly a North-South direction
(Imai et al. 2000), a direction similar to the overall CO
outflow of the region.
Mid-IR morphology:
The main 24.5 m component in W3 region is the bright source IRS5. The
double source at its centre is resolved, the Northern one is the brightest
of the two sources. IRS5 shows prominent diffuse emission that
surrounds the double source. It extends in both North-South and
East-West direction. IRS6 is a resolved source with the peak
emission somewhat offset to the West of centre. IRS7 is a diffuse,
cometary shaped emission region. IRS3 is resolved in various
24.5 m patches of diffuse emission. An unidentified source is found
10″ North of IRS5.
Model results:
Data for W3 IRS5 are from van der Tak et al. (2005), the compilation made
by Campbell et al. (1995), and the 10 m spectrum
presented in Willner et al. (1982). The (sub)mm data have been obtained with beamsizes between 15″ and 19″.
Shallow radial density models provide good fits to the SED, but fail to reproduce the intensity profile. Models with powerlaw produce to much mid-IR flux requiring a high optical depth, leading to a too deep silicate absorption feature. The best fitting models require a powerlaw.
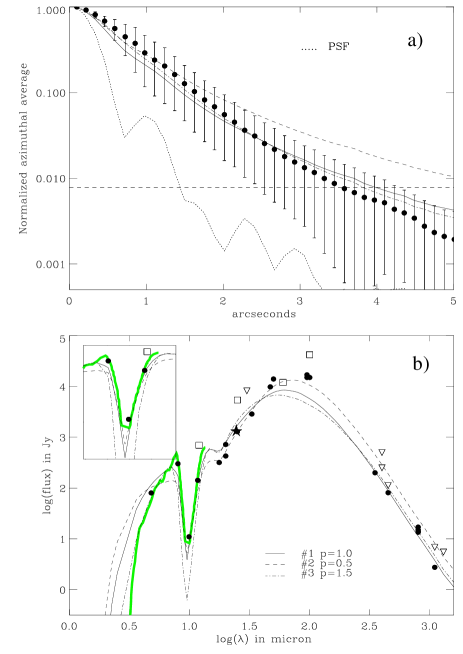
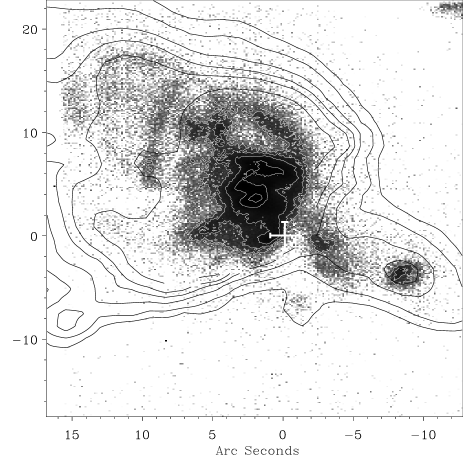
3.4.4 Cep A (Fig. 29)
Description:
Patel et al. (2005) reported a flattened HCN structure to be a circumstellar disk
near the HW2 radio jet, the brightest radio source of the region (Hughes & Wouterloot 1984).
The radio jet is known to be the driving force of a large-scale molecular outflow
in a North-East, South-West direction (Gómez et al. 1999). Jiménez-Serra
et al. (2007) showed that the HCN disk is resolved into a much smaller
disk and a hot core (Martín-Pintado et al. 2005). The centre of
their disk falls close to the centre of the ionized HW2 jet as determined in Curiel et al. (2006).
Mid-IR morphology:
The region shows a complex morphology comprising various arcs and patches.
The bright 24.5m emission corresponds to the bright near-IR reflection nebula that occupies the
blue-shifted outflow cavity (Lenzen et al. 1984). The COMICS image does not show any point source and we performed a cross matching
with a lower angular resolution, archival Spitzer 8 m image in order to determine a rough astrometric solution. The result shown in
Fig. 29 is a reasonable match between 8 and 24.5 m. Note that the 8 m emission
corresponding to the 24.5 m emission peaks is saturated. HW2 appears to be hidden by high extinction just at the bottom
tip of a dark lane.
Model results: Cep A is not modelled because direct radiation from the source is obscured at 24.5 m.
4 Summary of the model fitting
We give a summary of the best-fitting models in Table 5. Whether the best model reproduces certain important SED wavelength intervals and the 24.5 m intensity profile has been indicated by tickmarks and crosses. In some cases no such assessment could be made due to lack of data or data of insufficient quality. The table makes clear that spherical models are capable of reproducing at least part of the SED and intensity profile simultaneously. The models systematically fail to reproduce the short wavelength range, which is a well-known shortcoming of spherical geometries (e.g. Gürtler et al. 1991).
A pattern emerges from Table 5 in which the objects that are satisfactorily reproduced by spherical models (S140 IRS1, AFGL 2136, AFGL 5180, Mon R2 IRS3) are described by radial density distribution with a power index. Four objects that require steeper () density distributions, viz. AFGL 2591, NGC 2264 IRS1, M8E-IR, S255 IRS3, fail in reproducing either the silicate absorption or the intensity profile. These objects seem to show excess mid-IR flux with respect to spherical models that can only be accounted for if higher bolometric luminosities are adopted, a solution denied by the 24.5 m intensity profile. The MYSO that poses the biggest problem is AFGL 2591. Van der Tak et al. (2000) forwarded the idea that the star’s outflow activity is directed nearly along the line-of-sight, and the problems with spherical models encountered here could be a manifestation of this. Schreyer et al. (1997) have argued for NGC 2264 IRS1 that again there is outflow activity along the line-of-sight towards this source. M8E-IR shows evidence of a CO outflow with the blue and red shifted components projected on top of each other, arguing for a small inclination angle (Simon et al. 1984; see also Linz et al. 2008). If these objects were viewed down the outflow cavities, we would directly view the warm dust at the base of the cavity and perhaps from the accretion disk itself. This extinction free view of the central regions would produce artificially steep laws from spherical models that cannot account for the geometry.
The remaining objects have power indices that are shallower with power indices between and . The best-studied of these objects is IRAS 20126. As discussed in Sect. 3.3.8 this object is a case where there is clear evidence that we are viewing the object close to edge-on. A dark lane appears at wavelengths shorter than 20 m. As a result, there will still be significant optical depth at 24.5 m which suppresses the envelope emission. Instead the weaker, but more extended cavity wall emission becomes significant. This leads to an apparent need for shallower density profiles in our fits.
We therefore conclude that in those MYSO cases where we view the objects at intermediate inclinations, the emission from the envelope dominates. Spherical models are then capable of reproducing simultaneously the 24.5 m intensity profile and the SED. For these cases, radial density profiles with a power index of are preferred.
5 Discussion
We have presented resolved 24.5 m images of a sample of 14 MYSOs. In most cases, the MYSO is discrete, single (within ) and has a circularly symmetric profile on the sky. Simultaneous modelling of the spatial profile and the SED with simple spherical envelope models shows that those objects that can be adequately modelled in this way have radial density powerlaws with exponent .
A number of studies have analysed the density structure of MYSO (and UCH ii) envelopes by means of 1-D radiative transfer modelling. The approaches consist in reproducing the observed SED and the submm intensity profiles (Mueller et al. 2002; Beuther et al. 2002; Williams et al. 2005) and molecular line emission (van der Tak et al. 2000; Hatchell & van der Tak 2003). A few important differences exist between these studies and the present one. First, the COMICS observations provide information on scales about ten times smaller, i.e. 1000 AU. These scales could correspond to the transition region between the material reservoir (the envelope) and a putative accretion disk. Secondly, the above mentioned studies ease or ignore spectral constraints at wavelengths shorter than 100 m. In contrast, our approach is to be more cautious with the IRAS measurements if they cannot be reproduced by any spherical model, but keep the mid-IR and submm measurements. This assumption derives from the likelihood of source confusion and background contamination within the large IRAS beam, and our experience with Spitzer 70m fluxes which are often significantly lower than the interpolated IRAS fluxes, even after correction for detector non-linearity effects. In practice, this resulted in somewhat lower bolometric luminosities than usually adopted for our MYSO sample, primarily caused by the luminosity sensitive intensity profile.
As far as the radial density distribution is concerned, we find a preference for models, as discussed in Sect. 4. The present analysis shows that radial profiles as steep as are incompatible with the observations, and even less steep cannot always be justified. Our values are consistent with the ones found by van der Tak et al. (2000) from the submm dust continuum and molecular line emission, albeit on much larger size scales. These authors find a range of for the powerlaw index. Williams et al. (2005) draw a similar conclusion for a large sample of candidate MYSOs. They find an average value of the powerlaw index of . However, one should note that the models in the latter study require very high optical depths (generally optically thick at 100 m), which is a factor of a few to an order of magnitude larger than derived by us. It goes to show that the DUSTY models presented by Williams et al. would probably never fit the silicate feature nor the mid-IR part of the SED, and indeed they do not attempt to fit the mid-IR nor the far-IR data points. Mueller et al. (2002) claim a value for the power index “p” which is consistent with the previous two but slightly higher: . Importantly, they argue that the van der Tak (2000) results would favour higher values for the power index if they had convolved their models with the actual telescope beam instead of a Gaussian profile. Finally, Beuther et al. (2002) claim from powerlaw fits to the inner 32″ of their resolved 1.2 mm images. In summary, the far-IR and submm studies generally prefer somewhat steeper density profiles than the ones derived from 24.5 m images, recalling the caveats regarding the van der Tak et al. (2000) and Williams et al. (2005) results. This apparent inconsistency can however be brought into agreement when allowing for the different spatial scales probed.
On small angular scales, various studies in the (sub)mm find evidence for shallower density distributions or flat intensity distributions, which are suggested to be due to an unresolved core or possibly a collection of cores. For example, Hatchell et al. (2000) find better model fits to their submm intensity profiles of a number of UCH ii regions, when they include an unresolved, high optical depth, central core. Beuther et al. (2002) describe the 1.2 mm intensity profiles of a large sample of massive cores with models that require an unresolved, inner, constant intensity distribution with radii between – AU. Van der Tak et al. (1999, 2000) conclude from their interferometric mm data (probing 1000 AU scales) that the detected emission is caused by a compact structure with an estimated angular size of 0.3″, and which is different from the larger scale spherical envelope structure.
Compact substructures thus seem to be required in order to explain the (sub)mm observations. Flat intensity distributions are suggestive of an optically thick dust component, such as a dense shell or a disk (van der Tak et al. 2000), or a collection of subcores created by the ongoing fragmentation of the large-scale molecular core (Beuther et al. 2002). In the latter case, the low angular resolution single dish submm observations would find the integrated emission of the various subcores to be equivalent to a shallow or a flat density distribution. It can therefore be argued that the flattening of the radial density distribution seen in the submm close to the unresolved central source is consistent with the relatively shallow density distribution as traced by our high-resolution 24.5 m images.
The images are generally dominated by one single, resolved principal source, identified with the MYSO, which has a circular appearance on the sky. Only in a small minority of cases do we find more than one condensation on scales . This observation goes against the idea of fragmentation as the main cause of the flattening of the inner density profile. Rodón et al. (2008) present 0.35″ resolution mm images of the near-IR double source W3 IRS5, in which the dominant component does not resolve into multiple mm sources. Given that this source is the most luminous source in our sample, any fragmentation into a cluster of protostars would be expected in particular in this source, but this is not observed. Instead, it seems that the 24.5m could indicate that it is the density distribution of the ambient core material itself that actually flattens out at scales of an arcsecond. An alternative explanation why this could be so is rotation. The density structure for a rotating and infalling envelope (TSC envelopes, Terebey et al. 1984) becomes on average significantly shallower within the so-called centrifugal radius, i.e. where rotational motion dominates over infall. The evolution of the density distribution from relatively steep on large scales as seen by single-dish the (sub)mm observations to shallow on smaller scales at shorter wavelengths could be a manifestation of this effect.
| MYSO | 4-8 | 9.7 | 24.5 | 100 | mm | Intensity | |
|---|---|---|---|---|---|---|---|
| m | m | m | m | profile | |||
| S140 IRS1 | 1.0 | x | |||||
| AFGL2136 | 1.0 | x | .. | ||||
| AFGL 5180 | 1.0 | .. | .. | ||||
| Mon R2 IRS3 | 1.0 | x | .. | ||||
| W3 IRS5 | 1.0: | x | x | ||||
| M8E-IR | 1.25 | x | x | .. | |||
| S255 IRS3 | 1.25 | x | .. | x | |||
| AFGL 2591 | 1.5 | x | x | .. | x | ||
| NGC 2264 IRS1 | 1.5 | x | x | .. | |||
| IRAS 20126 | 0.0 | x | .. | ||||
| AFGL 437S | 0.0: | .. | .. | ||||
| AFGL 4029 | 0.0: | .. | .. | ||||
| AFGL 961E | 0.5: |
The inability of models with spherical and smooth density distributions to reproduce the near-IR and mid-IR part of the SED was demonstrated again in the analysis presented in this paper. The development of more sophisticated models (e.g. Yorke & Sonnhalter 2002; Whitney et al. 2003; Indebetouw et al. 2006) is driven in part to reproduce this emission. Radiative transfer models that incorporate the mentioned rotating TSC envelopes and implement a flared equatorial accretion disk and a bipolar outflow cavity are presented in Whitney et al. (2003). The geometrical features are inspired mainly by detailed observations of low-mass class I YSOs (Whitney et al. 2003; see also Tobin et al. 2008) and may therefore be considered more realistic than the simple spherical models we have adopted here.
Recent work has applied the more sophisticated envelope models to MYSO SEDs and concluded that high-mass star formation proceeds similar to low-mass star formation (e.g. De Buizer, Osorio & Calvet 2005; Fazal et al. 2007). Such work is becoming popular especially after the publication of an extensive grid of SEDs (Robitaille et al. 2006) that are based on the Whitney et al. models. The rationale behind the Robitaille et al. SED grid is that high-mass stars may form similarly to low-mass stars, or at least that the SEDs of MYSOs are determined by similar geometrical structures as found in low-mass objects. Inferring 2D (or 3D) information from SED fits only is prone to be subjective and misleading. The quoted conclusion therefore that massive SF is similar to low-SF based on SED fits to such models is a circular argument. What the Whitney et al. models in particular show is that one should be careful interpreting SEDs, without any independent additional data. Large scale spatial information of the dust emission in MYSOs can be retrieved from the single-dish (sub)mm studies previously mentioned, intermediate scales can be probed in the mid-IR as our study presented here, and with (sub)mm interferometry. Finally, scales down to 100 AU in the mid-IR can be reached with mid-IR interferometry using e.g. the VLTI (de Wit et al. 2007; Linz et al 2008). Eventually the question of how a massive star forms can only be settled with such spatially resolved information.
6 Conclusions
We have presented a study of resolved 24.5 m images of 14 massive star forming regions. The images probe linear size scales of 1000 AU. Emission at 24.5 m is dominated by the MYSOs in these regions. They are discrete sources and most have a circular profile to first order. In three cases we find multiple condensations embedded in a larger mid-IR envelope. Various regions display extended, diffuse emission. This emission is associated with UCH ii regions (e.g. Mon R2, AFGL 437, AFGL 2591) in which case the dust is heated by Ly within the ionized zone. Shock excited material (e.g. S 140) also seems to produce diffuse emission at 24.5 m.
Simple 1-D spherical model fits to the MYSO 24.5 m spatial profile and SED show that radial density powerlaws of the form with a power are preferred. When there is evidence that we are viewing the MYSO either face-on down the outflow cavity or edge-on through a torus we find steeper or shallower density laws respectively . These density laws are more likely to be due to the inadequacies of the spherical models in these cases than a true representation of a different density law, and we expect that also applies there to.
We find that the spatial profile of the dust emission on scales of 1000 AU is shallower than that from larger 10 000 AU scales probed by (sub)mm dust emission. Inner flattenings seen in the submm are consistent with our results here. This flattening is not likely to be due to fragmentation of the core, but due to the actual distribution of the emitting material. This is supported by the relatively small multiplicity of condensations seen on sub-arcsecond scales. The continuous flattening from large to small scales could be the manifestation of rotation, but this requires further study. The application of more sophisticated, multi-dimensional models in relation to the data presented here and at even higher resolution using mid-IR interferometric observations will be the subject of a future paper.
Acknowledgements.
RDO is grateful for the support from the Leverhulme Trust for awarding a Research Fellowship. The authors would like to thank I. Jiménez-Serra and E.R. Parkin for fruitful discussions, and an anonymous referee for valuable comments. The version of the ISO data presented in this paper correspond to the Highly Processed Data Product (HPDP) by W.F. Frieswijk et al., available for public use in the ISO Data Archive. This research has made use of the SIMBAD database and the VizieR catalogue access tool, operated at CDS, Strasbourg, France. This research has made use of NASA’s Astrophysics Data System. We acknowledge the use of the RMS database, that can be found at URLReferences
- Alvarez et al. (2004) Alvarez, C., Hoare, M., Glindemann, A., & Richichi, A. 2004, A&A, 427, 505
- Alvarez & Hoare (2005) Alvarez, C. & Hoare, M. G. 2005, A&A, 440, 569
- Aspin (1998) Aspin, C. 1998, A&A, 335, 1040
- Becker & Fenkart (1971) Becker, W. & Fenkart, R. 1971, A&AS, 4, 241
- Beckwith et al. (1976) Beckwith, S., Evans, II, N. J., Becklin, E. E., & Neugebauer, G. 1976, ApJ, 208, 390
- Beichman et al. (1979) Beichman, C. A., Becklin, E. E., & Wynn-Williams, C. G. 1979, ApJ, 232, L47
- Beltrán et al. (2006) Beltrán, M. T., Brand, J., Cesaroni, R., et al. 2006, A&A, 447, 221
- Beuther et al. (2002) Beuther, H., Schilke, P., Menten, K. M., et al. 2002, ApJ, 566, 945
- Campbell et al. (1995) Campbell, M. F., Butner, H. M., Harvey, P. M., et al. 1995, ApJ, 454, 831
- Castelaz et al. (1985) Castelaz, M. W., Grasdalen, G. L., Hackwell, J. A., Capps, R. W., & Thompson, D. 1985, AJ, 90, 1113
- Cesaroni et al. (1999) Cesaroni, R., Felli, M., Jenness, T., et al. 1999, A&A, 345, 949
- Cesaroni et al. (1997) Cesaroni, R., Felli, M., Testi, L., Walmsley, C. M., & Olmi, L. 1997, A&A, 325, 725
- Cesaroni et al. (2005) Cesaroni, R., Neri, R., Olmi, L., et al. 2005, A&A, 434, 1039
- Chini et al. (1986a) Chini, R., Kreysa, E., Mezger, P. G., & Gemuend, H.-P. 1986a, A&A, 154, L8
- Chini et al. (1986b) Chini, R., Kruegel, E., & Kreysa, E. 1986b, A&A, 167, 315
- Churchwell et al. (1990) Churchwell, E., Wolfire, M. G., & Wood, D. O. S. 1990, ApJ, 354, 247
- Claussen et al. (1994) Claussen, M. J., Gaume, R. A., Johnston, K. J., & Wilson, T. L. 1994, ApJ, 424, L41
- Cohen (1973) Cohen, M. 1973, ApJ, 185, L75+
- Cohen et al. (1999) Cohen, M., Walker, R. G., Carter, B., et al. 1999, AJ, 117, 1864
- Cohen et al. (1995) Cohen, M., Witteborn, F. C., Walker, R. G., Bregman, J. D., & Wooden, D. H. 1995, AJ, 110, 275
- Crampton & Fisher (1974) Crampton, D. & Fisher, W. A. 1974, Spectroscopic observations of stars in HII regions Crampton and W. A. Fisher. (Victoria : National Research Council of Canada, Radio and Electrical Engineering Division, Astrophysics Branch, 1974.), 12–+
- Curiel et al. (2006) Curiel, S., Ho, P. T. P., Patel, N. A., et al. 2006, ApJ, 638, 878
- Dale et al. (2007) Dale, D. A., Gil de Paz, A., Gordon, K. D., et al. 2007, ApJ, 655, 863
- De Buizer (2007) De Buizer, J. M. 2007, ApJ, 654, L147
- De Buizer et al. (2005a) De Buizer, J. M., Osorio, M., & Calvet, N. 2005a, ApJ, 635, 452
- De Buizer et al. (2000) De Buizer, J. M., Piña, R. K., & Telesco, C. M. 2000, ApJS, 130, 437
- De Buizer et al. (2005b) De Buizer, J. M., Radomski, J. T., Telesco, C. M., & Piña, R. K. 2005b, ApJS, 156, 179
- de Graauw et al. (1996) de Graauw, T., Haser, L. N., Beintema, D. A., et al. 1996, A&A, 315, L49
- de Wit et al. (2007) de Wit, W. J., Hoare, M. G., Oudmaijer, R. D., & Mottram, J. C. 2007, ApJ, 671, L169
- de Wit et al. (2008) de Wit, W. J., Oudmaijer, R. D., Fujiyoshi, T., et al. 2008, ApJ, 685, L75
- Deharveng et al. (1997) Deharveng, L., Zavagno, A., Cruz-Gonzalez, I., et al. 1997, A&A, 317, 459
- Dent et al. (1998) Dent, W. R. F., Matthews, H. E., & Ward-Thompson, D. 1998, MNRAS, 301, 1049
- Di Francesco et al. (2008) Di Francesco, J., Johnstone, D., Kirk, H., MacKenzie, T., & Ledwosinska, E. 2008, ApJS, 175, 277
- Draine & Lee (1984) Draine, B. T. & Lee, H. M. 1984, ApJ, 285, 89
- Evans et al. (1977) Evans, II, N. J., Beckwith, S., & Blair, G. N. 1977, ApJ, 217, 448
- Evans et al. (1989) Evans, II, N. J., Mundy, L. G., Kutner, M. L., & Depoy, D. L. 1989, ApJ, 346, 212
- Evans et al. (1981) Evans, II, N. J., Slovak, M. H., Becklin, E. E., et al. 1981, ApJ, 244, 115
- Faison et al. (1998) Faison, M., Churchwell, E., Hofner, P., et al. 1998, ApJ, 500, 280
- Fazal et al. (2007) Fazal, F. M., Sridharan, T. K., Qiu, K., et al. 2007, ArXiv e-prints
- Forrest & Shure (1986) Forrest, W. J. & Shure, M. A. 1986, ApJ, 311, L81
- Gear et al. (1988) Gear, W. K., Robson, E. I., & Griffin, M. J. 1988, MNRAS, 231, 55P
- Gezari et al. (1999) Gezari, D. Y., Pitts, P. S., & Schmitz, M. 1999, VizieR Online Data Catalog, 2225, 0
- Ghosh et al. (2000) Ghosh, S. K., Iyengar, K. V. K., Karnik, A. D., et al. 2000, Bulletin of the Astronomical Society of India, 28, 515
- Giannakopoulou et al. (1997) Giannakopoulou, J., Mitchell, G. F., Hasegawa, T. I., Matthews, H. E., & Maillard, J.-P. 1997, ApJ, 487, 346
- Gibb & Hoare (2007) Gibb, A. G. & Hoare, M. G. 2007, MNRAS, 380, 246
- Gómez et al. (1999) Gómez, J. F., Sargent, A. I., Torrelles, J. M., et al. 1999, ApJ, 514, 287
- Greenhill et al. (2004) Greenhill, L. J., Gezari, D. Y., Danchi, W. C., et al. 2004, ApJ, 605, L57
- Guertler et al. (1991) Guertler, J., Henning, T., Kruegel, E., & Chini, R. 1991, A&A, 252, 801
- Hackwell et al. (1982) Hackwell, J. A., Grasdalen, G. L., & Gehrz, R. D. 1982, ApJ, 252, 250
- Harvey et al. (2000) Harvey, P. M., Butner, H. M., Colomé, C., Di Francesco, J., & Smith, B. J. 2000, ApJ, 534, 846
- Harvey et al. (1977) Harvey, P. M., Campbell, M. F., & Hoffmann, W. F. 1977, ApJ, 215, 151
- Hatchell et al. (2000) Hatchell, J., Fuller, G. A., Millar, T. J., Thompson, M. A., & Macdonald, G. H. 2000, A&A, 357, 637
- Hatchell & van der Tak (2003) Hatchell, J. & van der Tak, F. F. S. 2003, A&A, 409, 589
- Hayashi et al. (1987) Hayashi, M., Hasegawa, T., Omodaka, T., Hayashi, S. S., & Miyawaki, R. 1987, ApJ, 312, 327
- Henning et al. (1992) Henning, T., Chini, R., & Pfau, W. 1992, A&A, 263, 285
- Henning et al. (1990) Henning, T., Pfau, W., & Altenhoff, W. J. 1990, A&A, 227, 542
- Henning et al. (2000) Henning, T., Schreyer, K., Launhardt, R., & Burkert, A. 2000, A&A, 353, 211
- Herbst & Racine (1976) Herbst, W. & Racine, R. 1976, AJ, 81, 840
- Hoare (2006) Hoare, M. G. 2006, ApJ, 649, 856
- Hoare & Franco (2007) Hoare, M. G. & Franco, J. 2007, Massive Star Formation (Diffuse Matter from Star Forming Regions to Active Galaxies), 61–+
- Hoare et al. (2007) Hoare, M. G., Kurtz, S. E., Lizano, S., Keto, E., & Hofner, P. 2007, in Protostars and Planets V, ed. B. Reipurth, D. Jewitt, & K. Keil, 181–196
- Hoare et al. (1991) Hoare, M. G., Roche, P. F., & Glencross, W. M. 1991, MNRAS, 251, 584
- Hofner et al. (2007) Hofner, P., Cesaroni, R., Olmi, L., et al. 2007, A&A, 465, 197
- Howard et al. (1994) Howard, E. M., Pipher, J. L., & Forrest, W. J. 1994, ApJ, 425, 707
- Howell et al. (1981) Howell, R. R., McCarthy, D. W., & Low, F. J. 1981, ApJ, 251, L21
- Hughes & Wouterloot (1984) Hughes, V. A. & Wouterloot, J. G. A. 1984, ApJ, 276, 204
- Imai et al. (2000) Imai, H., Kameya, O., Sasao, T., et al. 2000, ApJ, 538, 751
- Indebetouw et al. (2006) Indebetouw, R., Whitney, B. A., Johnson, K. E., & Wood, K. 2006, ApJ, 636, 362
- Itoh et al. (2001) Itoh, Y., Tamura, M., Suto, H., et al. 2001, PASJ, 53, 495
- Ivezic & Elitzur (1997) Ivezic, Z. & Elitzur, M. 1997, MNRAS, 287, 799
- Jaffe et al. (1984) Jaffe, D. T., Davidson, J. A., Dragovan, M., & Hildebrand, R. H. 1984, ApJ, 284, 637
- Jenness et al. (1995) Jenness, T., Scott, P. F., & Padman, R. 1995, MNRAS, 276, 1024
- Jiang et al. (2008) Jiang, Z., Tamura, M., Hoare, M. G., et al. 2008, ApJ, 673, L175
- Jiménez-Serra et al. (2007) Jiménez-Serra, I., Martín-Pintado, J., Rodríguez-Franco, A., et al. 2007, ApJ, 661, L187
- Kastner et al. (1992) Kastner, J. H., Weintraub, D. A., & Aspin, C. 1992, ApJ, 389, 357
- Kastner et al. (1994) Kastner, J. H., Weintraub, D. A., Snell, R. L., et al. 1994, ApJ, 425, 695
- Kataza et al. (2000) Kataza, H., Okamoto, Y., Takubo, S., et al. 2000, in Society of Photo-Optical Instrumentation Engineers (SPIE) Conference Series, Vol. 4008, Society of Photo-Optical Instrumentation Engineers (SPIE) Conference Series, ed. M. Iye & A. F. Moorwood, 1144–1152
- Kessler et al. (1996) Kessler, M. F., Steinz, J. A., Anderegg, M. E., et al. 1996, A&A, 315, L27
- Klein et al. (2005) Klein, R., Posselt, B., Schreyer, K., Forbrich, J., & Henning, T. 2005, ApJS, 161, 361
- Kurtz et al. (1994) Kurtz, S., Churchwell, E., & Wood, D. O. S. 1994, ApJS, 91, 659
- Lada & Gautier (1982) Lada, C. J. & Gautier, III, T. N. 1982, ApJ, 261, 161
- Lada et al. (1984) Lada, C. J., Thronson, Jr., H. A., Smith, H. A., Schwartz, P. R., & Glaccum, W. 1984, ApJ, 286, 302
- Ladd et al. (1993) Ladd, E. F., Deane, J. R., Sanders, D. B., & Wynn-Williams, C. G. 1993, ApJ, 419, 186
- Lenzen et al. (1984a) Lenzen, R., Hodapp, K.-W., & Reddmann, T. 1984a, A&A, 137, 365
- Lenzen et al. (1984b) Lenzen, R., Hodapp, K.-W., & Solf, J. 1984b, A&A, 137, 202
- Lester et al. (1986) Lester, D. F., Harvey, P. M., Joy, M., & Ellis, Jr., H. B. 1986, ApJ, 309, 80
- Linz et al. (2008) Linz, H., Henning, T., Stecklum, B., et al. 2008, in Astronomical Society of the Pacific Conference Series, Vol. 387, Massive Star Formation: Observations Confront Theory, ed. H. Beuther, H. Linz, & T. Henning, 132–+
- Longmore et al. (2006) Longmore, S. N., Burton, M. G., Minier, V., & Walsh, A. J. 2006, MNRAS, 369, 1196
- Marsh et al. (2001) Marsh, K. A., Bloemhof, E. E., Koerner, D. W., & Ressler, M. E. 2001, ApJ, 548, 861
- Martín-Pintado et al. (2005) Martín-Pintado, J., Jiménez-Serra, I., Rodríguez-Franco, A., Martín, S., & Thum, C. 2005, ApJ, 628, L61
- Massi et al. (1985) Massi, M., Felli, M., & Simon, M. 1985, A&A, 152, 387
- Mathis et al. (1977) Mathis, J. S., Rumpl, W., & Nordsieck, K. H. 1977, ApJ, 217, 425
- Meakin et al. (2005) Meakin, C. A., Hines, D. C., & Thompson, R. I. 2005, ApJ, 634, 1146
- Menten & van der Tak (2004) Menten, K. M. & van der Tak, F. F. S. 2004, A&A, 414, 289
- Mezger et al. (1988) Mezger, P. G., Chini, R., Kreysa, E., Wink, J. E., & Salter, C. J. 1988, A&A, 191, 44
- Minchin et al. (1995) Minchin, N. R., Ward-Thompson, D., & White, G. J. 1995, A&A, 298, 894
- Minier et al. (2005) Minier, V., Burton, M. G., Hill, T., et al. 2005, A&A, 429, 945
- Moffat et al. (1979) Moffat, A. F. J., Jackson, P. D., & Fitzgerald, M. P. 1979, A&AS, 38, 197
- Mottram et al. (2007) Mottram, J. C., Hoare, M. G., Lumsden, S. L., et al. 2007, A&A, 476, 1019
- Mueller et al. (2002) Mueller, K. E., Shirley, Y. L., Evans, II, N. J., & Jacobson, H. R. 2002, ApJS, 143, 469
- Nakano et al. (2003) Nakano, M., Sugitani, K., & Morita, K. 2003, PASJ, 55, 1
- Ossenkopf & Henning (1994) Ossenkopf, V. & Henning, T. 1994, A&A, 291, 943
- Patel et al. (2005) Patel, N. A., Curiel, S., Sridharan, T. K., et al. 2005, Nature, 437, 109
- Peretto et al. (2006) Peretto, N., André, P., & Belloche, A. 2006, A&A, 445, 979
- Preibisch et al. (2001) Preibisch, T., Balega, Y. Y., Schertl, D., Smith, M. D., & Weigelt, G. 2001, A&A, 378, 539
- Preibisch et al. (2002) Preibisch, T., Balega, Y. Y., Schertl, D., & Weigelt, G. 2002, A&A, 392, 945
- Preibisch et al. (2003) Preibisch, T., Balega, Y. Y., Schertl, D., & Weigelt, G. 2003, A&A, 412, 735
- Rayner & McLean (1987) Rayner, J. & McLean, I. 1987, in Infrared astronomy with arrays, ed. C. G. Wynn-Williams & E. E. Becklin, 272–+
- Richardson et al. (1985) Richardson, K. J., White, G. J., Gee, G., et al. 1985, MNRAS, 216, 713
- Robitaille et al. (2006) Robitaille, T. P., Whitney, B. A., Indebetouw, R., Wood, K., & Denzmore, P. 2006, ApJS, 167, 256
- Rodón et al. (2008) Rodón, J. A., Beuther, H., Megeath, S. T., & van der Tak, F. F. S. 2008, A&A, 490, 213
- Saito et al. (2006) Saito, H., Saito, M., Moriguchi, Y., & Fukui, Y. 2006, PASJ, 58, 343
- Saito et al. (2007) Saito, H., Saito, M., Sunada, K., & Yonekura, Y. 2007, ApJ, 659, 459
- Scarrott & Warren-Smith (1989) Scarrott, S. M. & Warren-Smith, R. F. 1989, MNRAS, 237, 995
- Schreyer et al. (1997) Schreyer, K., Helmich, F. P., van Dishoeck, E. F., & Henning, T. 1997, A&A, 326, 347
- Schreyer et al. (2003) Schreyer, K., Stecklum, B., Linz, H., & Henning, T. 2003, ApJ, 599, 335
- Shepherd et al. (2000) Shepherd, D. S., Yu, K. C., Bally, J., & Testi, L. 2000, ApJ, 535, 833
- Shuping et al. (2004) Shuping, R. Y., Morris, M., & Bally, J. 2004, AJ, 128, 363
- Simon et al. (1984) Simon, M., Cassar, L., Felli, M., et al. 1984, ApJ, 278, 170
- Simon et al. (1985) Simon, M., Peterson, D. M., Longmore, A. J., Storey, J. W. V., & Tokunaga, A. T. 1985, ApJ, 298, 328
- Simon & Dyck (1977) Simon, T. & Dyck, H. M. 1977, AJ, 82, 725
- Sloan et al. (2003) Sloan, G. C., Kraemer, K. E., Price, S. D., & Shipman, R. F. 2003, ApJS, 147, 379
- Snell & Bally (1986) Snell, R. L. & Bally, J. 1986, ApJ, 303, 683
- Snell et al. (1988) Snell, R. L., Huang, Y.-L., Dickman, R. L., & Claussen, M. J. 1988, ApJ, 325, 853
- Sridharan et al. (2005) Sridharan, T. K., Williams, S. J., & Fuller, G. A. 2005, ApJ, 631, L73
- Su et al. (2007) Su, Y.-N., Liu, S.-Y., Chen, H.-R., Zhang, Q., & Cesaroni, R. 2007, ApJ, 671, 571
- Tamura et al. (1991) Tamura, M., Gatley, I., Joyce, R. R., et al. 1991, ApJ, 378, 611
- Tatebe et al. (2007) Tatebe, K., Hale, D. D. S., Wishnow, E. H., & Townes, C. H. 2007, ApJ, 658, L103
- Terebey et al. (1984) Terebey, S., Shu, F. H., & Cassen, P. 1984, ApJ, 286, 529
- Thompson et al. (2006) Thompson, M. A., Hatchell, J., Walsh, A. J., MacDonald, G. H., & Millar, T. J. 2006, A&A, 453, 1003
- Thompson et al. (1998) Thompson, R. I., Corbin, M. R., Young, E., & Schneider, G. 1998, ApJ, 492, L177+
- Thronson et al. (1980) Thronson, Jr., H. A., Gatley, I., Harvey, P. M., Sellgren, K., & Werner, M. W. 1980, ApJ, 237, 66
- Thronson et al. (1983) Thronson, Jr., H. A., Lada, C. J., Smith, H. A., et al. 1983, ApJ, 271, 625
- Tobin et al. (2008) Tobin, J. J., Hartmann, L., Calvet, N., & D’Alessio, P. 2008, ApJ, 679, 1364
- Tofani et al. (1995) Tofani, G., Felli, M., Taylor, G. B., & Hunter, T. R. 1995, A&AS, 112, 299
- Torrelles et al. (1992) Torrelles, J. M., Gomez, J. F., Anglada, G., et al. 1992, ApJ, 392, 616
- Trinidad et al. (2003) Trinidad, M. A., Curiel, S., Cantó, J., et al. 2003, ApJ, 589, 386
- van der Tak et al. (2005) van der Tak, F. F. S., Tuthill, P. G., & Danchi, W. C. 2005, A&A, 431, 993
- van der Tak et al. (1999) van der Tak, F. F. S., van Dishoeck, E. F., Evans, II, N. J., Bakker, E. J., & Blake, G. A. 1999, ApJ, 522, 991
- van der Tak et al. (2000) van der Tak, F. F. S., van Dishoeck, E. F., Evans, II, N. J., & Blake, G. A. 2000, ApJ, 537, 283
- Walker et al. (1990) Walker, C. K., Adams, F. C., & Lada, C. J. 1990, ApJ, 349, 515
- Walker (1956) Walker, M. F. 1956, ApJS, 2, 365
- Ward-Thompson et al. (2000) Ward-Thompson, D., Zylka, R., Mezger, P. G., & Sievers, A. W. 2000, A&A, 355, 1122
- Weigelt et al. (2002) Weigelt, G., Balega, Y. Y., Preibisch, T., Schertl, D., & Smith, M. D. 2002, A&A, 381, 905
- Weintraub & Kastner (1996) Weintraub, D. A. & Kastner, J. H. 1996, ApJ, 458, 670
- Whitney et al. (2003) Whitney, B. A., Wood, K., Bjorkman, J. E., & Wolff, M. J. 2003, ApJ, 591, 1049
- Williams et al. (2005) Williams, S. J., Fuller, G. A., & Sridharan, T. K. 2005, A&A, 434, 257
- Willner et al. (1982) Willner, S. P., Gillett, F. C., Herter, T. L., et al. 1982, ApJ, 253, 174
- Wilson et al. (2003) Wilson, T. L., Boboltz, D. A., Gaume, R. A., & Megeath, S. T. 2003, ApJ, 597, 434
- Wolfire & Churchwell (1994) Wolfire, M. G. & Churchwell, E. 1994, ApJ, 427, 889
- Wynn-Williams (1982) Wynn-Williams, C. G. 1982, ARA&A, 20, 587
- Wynn-Williams et al. (1981) Wynn-Williams, C. G., Becklin, E. E., Beichman, C. A., Capps, R., & Shakeshaft, J. R. 1981, ApJ, 246, 801
- Wynn-Williams et al. (1972) Wynn-Williams, C. G., Becklin, E. E., & Neugebauer, G. 1972, MNRAS, 160, 1
- Wynn-Williams et al. (1977) Wynn-Williams, C. G., Forster, J. R., Welch, W. J., et al. 1977, ApJ, 211, L89+
- Yorke & Sonnhalter (2002) Yorke, H. W. & Sonnhalter, C. 2002, ApJ, 569, 846
- Zapata et al. (2001) Zapata, L. A., Rodríguez, L. F., & Kurtz, S. E. 2001, Revista Mexicana de Astronomia y Astrofisica, 37, 83
- Zavagno et al. (1999) Zavagno, A., Lagage, P. O., & Cabrit, S. 1999, A&A, 344, 499
- Zubko et al. (1996) Zubko, V. G., Mennella, V., Colangeli, L., & Bussoletti, E. 1996, MNRAS, 282, 1321