Detection of C I in absorption towards PKS 1830211 with the eSMA
Abstract
We report the first science observations and results obtained with the “extended” SMA (eSMA), which is composed of the SMA (Submillimeter Array), JCMT (James Clerk Maxwell Telescope) and CSO (Caltech Submillimeter Observatory). Redshifted absorptions at =0.886 of C I () were observed with the eSMA with an angular resolution of 055022 at 1.1 mm toward the southwestern image of the remarkable lensed quasar PKS 1830211, but not toward the northeastern component at a separation of . Additionally, SMA observations of CO, 13CO and C18O (all =4–3) were obtained toward this object: CO was also detected toward the SW component, but none of the isotopologues were. This is the first time [C I] is detected in this object, allowing the first direct determination of relative abundances of neutral atomic carbon to CO in the molecular clouds of a spiral galaxy at . The [C I] and CO profiles can be decomposed into two and three velocity components respectively. We derive C/CO column density ratios ranging from 0.5 (representative of dense cores) to 2.5 (close to translucent clouds values). This could indicate that we are seeing environments with different physical conditions or that we are witnessing chemical evolution of regions where C has not completely been converted into CO.
Subject headings:
quasars: individual (PKS 1830) — quasars: absorption lines — galaxies: ISM — ISM: abundances1. Introduction
A powerful way to study the physical and chemical conditions in the interstellar medium (ISM) of distant galaxies is to observe chemical species in absorption against a strong continuum background source. Few such lines of sight have been unveiled so far but PKS 1830211 (catalog QSO B1830-210) (hereafter PKS 1830) is one of the most remarkable systems allowing this kind of study. PKS 1830 is a radio-loud quasar with a redshift of = 2.507 (Lidman et al., 1999), for which millimeter continuum emission images show two compact components, north-east (NE) and south-west (SW), separated by (Frye et al., 1997). This double structure represents two images of the background quasar, magnified and distorted by a lensing system at = 0.88582 (Wiklind & Combes, 1996). This lens was at first indirectly detected by the observations of broad H I and molecular absorptions at millimeter wavelengths (Wiklind & Combes, 1996, 1998; Gérin et al., 1997; Muller et al., 2006). Wiklind & Combes (1998) suggested the lensing system to be an almost face-on spiral galaxy, which was recently confirmed by direct optical and infrared HST images (Courbin et al., 2002; Winn et al., 2002).
A key species in the physics and chemistry of the ISM in galaxies
is atomic carbon.
For instance, [C I] 492 GHz is one of the major far-infrared (FIR)
fine structure atomic lines via which
cooling of the gas occurs
(Hollenbach & Tielens, 1997).
Moreover, both C and C+, which directly follow from C,
are essential in radical reaction networks,
especially those leading to carbon chains
(Suzuki et al., 1992; Sternberg & Dalgarno, 1995).
Atomic carbon is also crucial for better understanding the structure
of photo-dissociation
regions (PDRs).
Indeed, early observations of [C I] (e.g., Keene et al., 1985)
revealed more intense emission than originally
predicted by the models.
Observations
and theory now seem to have been reconciled by considering the effects of
the clumpy structure of clouds
(Hollenbach & Tielens, 1997, and references therein).
Several studies have investigated the use
of the neutral atomic carbon (C) to CO
abundance ratio () to
investigate the physical conditions of the gas.
A number of such analyses make use of
UV absorption data, and hence are limited to diffuse clouds in our Galaxy.
In order to measure and in a dense environment,
many studies have targeted submillimeter emission of these species.
However, the lowest C transition lies at a rather high frequency
( at 492 GHz), and so its detection requires
the use of ground-based facilities with sensitive receivers and/or
a large collecting area,
or the observation of a redshifted source.
Moreover, in these submillimeter studies,
the emission line data are averaged over large areas and suffer
from radiative transfer and excitation effects
(with a bias toward the densest regions).
The eSMA
(“extended” Submillimeter Array, Bottinelli et al. 2008)
is particularly well suited for this kind of observation as it provides
the high sensitivity and high spatial resolution required to observe
the weak [C I] transition in PKS 1830.
In this work, we present the first data obtained with the eSMA,
which probe
directly for the first time in absorption in
the dense molecular regions of an external galaxy.
2. Observations and data reduction
2.1. eSMA and SMA data
The eSMA
consists of the SMA111The Submillimeter Array is a joint project
between the Smithsonian Astrophysical Observatory
and the Academia Sinica Institute of Astronomy and
Astrophysics and is funded by the Smithsonian Institution and the
Academia Sinica.
array of eight 6-m antennas augmented by the nearby
single dishes of the JCMT222The James Clerk Maxwell Telescope
is operated by The Joint Astronomy Centre on behalf of the Science and
Technology Facilities Council of the United Kingdom,
the Netherlands Organisation for Scientific Research,
and the National Research Council of Canada. (15 m) and the
CSO (10.4 m).
The collecting area of the eSMA is twice that of
the SMA alone, providing increased sensitivity, in particular
for the longest baselines, which include the JCMT and CSO.
Moreover, the longest baseline of the eSMA is increased by 50% compared to the SMA alone,which can bring the angular
resolution down to below at 230 GHz, as reported here,
and to below 02 at 345 GHz, which will be the preferred
frequency for eSMA observations.
Observations of PKS 1830 (, ) were carried out with the eSMA for seven hours on 2008 April 14 (with eight SMA antennas in the very-extended configuration, or “vex”), and for eleven hours on 2008 August 5 with the SMA alone, also in vex configuration. The eSMA observations targeted the C I (3PP0) transition while the SMA provided CO, 13CO and C18O (all ) data. Table 1 summarizes the main observational parameters. The 45 eSMA baselines and the 28 SMA baselines had lengths ranging from 25-782 m (22-678 k) and 68-509 m (56-419 k) respectively, resulting in a best resolution at 1.1 mm of 055022. The tracks interleaved 15 to 20-minute observations of PKS 1830 with 3 to 5-minute observations of the calibrators. Observations were carried out in single polarization mode with half-wave plates in the beam of the CSO and JCMT that automatically rotate to a common polarization as a function of elevation.
In this interim state of eSMA commissioning, the JCMT used receiver A3 which, due to a different intermediate frequency, provided a usable bandwidth of about 1.5 GHz, slightly less than the 2 GHz covered by the SMA and CSO. For both eSMA and SMA tracks, the correlator was setup to provide a uniform spectral resolution of 0.8125 MHz per channel across the full 1.5-2 GHz bandwith, resulting in 2304 to 3072 channels per baseline and velocity coverages of 1725 and 2450 , for the eSMA and SMA respectively. Weather conditions were poor on the two nights with atmospheric opacity at 225 GHz ranging from 0.15 to 0.25.
2.2. Data reduction
The data were reduced and calibrated using the MIR/IDL software package333http://cfa-www.harvard.edu/cqi/mircook.html, and imaging was carried out with the MIRIAD software package. The SMA receiver temperatures ranged from 45 to 70 K on both nights, with the CSO comparable to the high end of this range, and the JCMT a factor of 2.5 times higher. The IF passband phase and amplitude were calibrated with observations of the strong sources 3C273, 3C454.3, J1924292, and NRAO530 for the eSMA observations, and 3C273, 3C279 and 3C454.3 for the SMA-only data. Self-calibration of the eSMA phase of PKS 1830 was done on the shortest possible timescales using an initial model consisting of a pair of equal point sources separated by at a position angle of . The amplitude gains for PKS 1830 were determined from the self-calibrated amplitudes of J1924292. For the SMA-only data, phase calibration was performed in a standard way using J1733130 to derive time-dependent amplitude gains throughout the night. The amplitude gains imply average efficiencies of about 0.75 for the SMA antennas, 0.70 for the JCMT, and 0.30 for the CSO; the low efficiency of the CSO is likely due to a known malfunction of its rotating polarizer. To set the flux scales, standard SMA monitoring observations of J1924292 (eSMA) and 3C279 (SMA-only) at 230 GHz and 345 GHz were used (uncertainty %).
3. Results
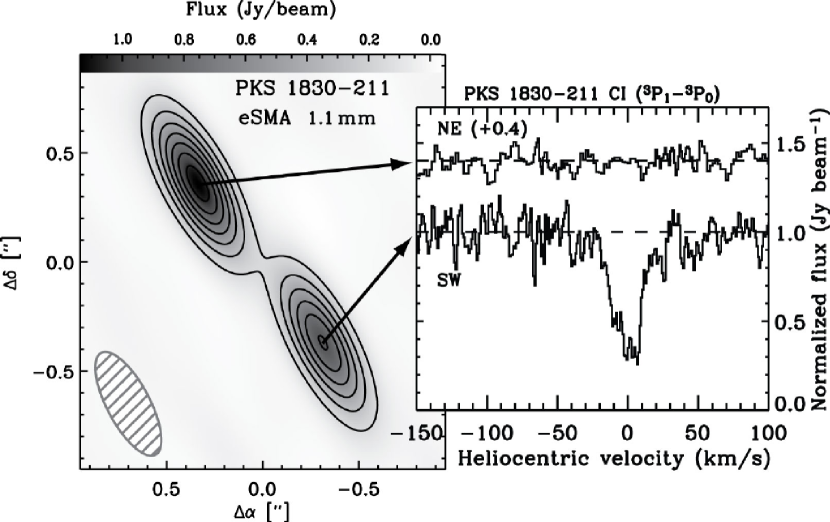
The continuum map, obtained with the eSMA and derived from line-free channels, is displayed in Fig. 1. This map shows the two lensed images of the distant quasar, separated by 1′′, consistent with previously reported values. Figure 1 also shows the [C I] spectra at the peak of the continuum emission of the SW and NE components.
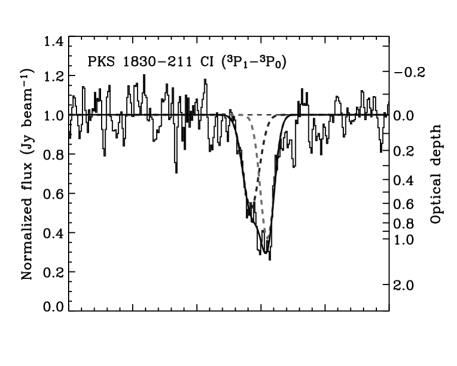
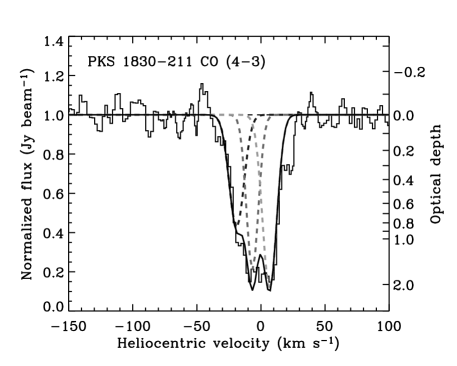
Figure 2 shows the absorption spectra
of [C I] and CO () as a function of heliocentric velocity, ,
observed in the SW source
by the eSMA and SMA respectively.
Two- and three-component gaussian fits were applied to the
[C I] and CO spectra respectively and are overplotted on Fig. 2.
Our [C I] velocities and widths agree within the errors with those
reported
for other molecular
species (Muller et al., 2006; Menten et al., 2008) and these
values were used to guide the fits to the blended CO components.
The presence of a fourth velocity component at +20 in the CO spectrum is possible, but was not fitted due to its
low signal-to-noise ratio and is therefore not investigated further in this work.
The derived parameters
are given in columns 2-5 of Table 2.
The optical depths at velocities were derived using
,
where and are the line and continuum fluxes respectively.
This equation implicitly assumes that the covering factor of the absorbing molecular
gas across the finite extent of the background continuum source is 1,
which will be discussed in Section 4.
Using line data from LAMDA, the Leiden Atomic and Molecular Database444http://www.strw.leidenuniv.nl/moldata/, we ran the radiative transfer code RADEX (van der Tak et al., 2007) for a range of H2 number densities and kinetic temperatures , and for =5.16 K; we obtain the excitation temperature for each (, ), and hence determine (, )( , K) corresponding to the excitation temperature =5.2-8 K derived by Muller et al. (2006) and Wiklind & Combes (1996) for molecular diagnostics of the physical conditions of dense cores such as HCO+. Using these same (, ), we in turn obtain for CO and C of 6-20 and 8-25 K. These slightly higher values are consistent with the lower Einstein -coefficients of CO and C compared to HCO+. and are then computed from, e.g., Eq. 2 of Muller et al. (2006), and are given in Table 2. The largest is consistent with the upper limit of reported by Gérin et al. (1997), and the CO column density we obtain for the 7 component, 0.9 , is also in agreement with the estimate given by these authors. Our results yield 2.5 for the two components at and 6 , and an upper limit of 0.5 for the third component at .
Finally, we derived an upper limit on in the NE component of , assuming a line width of 15 (Muller et al., 2006). This is consistent with the smallest of expected from the range of HCO+ to CO column density ratios determined from our data and that of Muller et al. (2006). Non-detection of the targeted molecules in the NE component could be due to the change in absorption reported by Muller & Guélin (2008) in this source.
4. Discussion and conclusion
Observations of C, C+ and CO can be used to probe the physical conditions of the gas. However, studies of the (clumpy) interstellar medium in external galaxies are complicated by several issues: (i) the large observing beams which encompass several regions of differing conditions; (ii) the difficulty of performing [C I] observations due to the weakness of the lines and the poorer atmospheric transparency at the high frequencies of the [C I] transitions (492 and 809 GHz); and (iii) the impossibility to access the [C II] 158-m transition from the ground. The observations presented here make it possible to tackle the first two points. Indeed, since the lines are detected in absorption and the galaxy responsible for the latter is almost face-on, the line profiles will not be affected much by rotation broadening. Regarding point (ii), it is worthy to note that in fact, no [C I] absorption has yet been detected in a local galaxy at . For PKS 1830, the absorbing material is at a redshift of 0.89, shifting the 492-GHz [C I] line to 261 GHz where the atmosphere is more transparent and stable.
While absorption data circumvent some of the problems inherent to emission spectra, some limitations unfortunately remain, in particular, our (lack of) knowledge of the structure of the absorbing gas. This translates partly into the estimation of the covering factor , which is one of the major sources of uncertainty (along with ) in the determination of the column densities. For CO(43), the largest optical depth is 2, meaning that the absorption almost reaches the zero intensity, but it is not heavily saturated as indicated by the non-detection of the less abundant 13CO. Indeed, Muller et al. (2006) derive 12C/13C 27, so that if CO were heavily saturated, the expected optical depth of 13CO would be 0.1, i.e. at the 2- detection limit. Hence, the covering factor of the absorbing material must be close to unity, as noted by previous studies of this source. This is consistent with the picture of individual clouds with sizes of order 1 pc (cf. Menten et al. 1999; Muller & Guélin 2008, and sizes of typical Galactic molecular clouds of up to a few pc) in front of a background source of projected size 1 pc at the distance of the galaxy, corresponding to the deconvolved core size of mas measured by Jin et al. (2003) for the SW image of PKS 1830 at 7 mm with the VLBA.
Comparing the total H column density derived with different methods
can indicate whether the “cloud” is uniform
(e.g. Wiklind & Combes, 1997).
For the SW source,
there is no strong evidence for clumpiness, since in this case
the total H column density derived from X-ray data
( , Mathur & Nair 1997)
is comparable to that derived from millimeter CO absorption
( , assuming CO/H2),
or from C I absorption ( , assuming a typical
C/H2, Frerking et al. 1989).
Hence, the assumption that the individual velocity components
consist of material with homogeneous physical and chemical
conditions seems sufficient, which allows us to compare the
column density ratios.
Our data indicate two types of (see Table 3 for comparisons): a low value, 0.5, representative of dense cores or PDRs (), and a somewhat high value, 2.5, close to those derived for translucent clouds (). Qualitatively, low are found in environments with low neutral atomic carbon abundances, such as high-UV environments (where C becomes ionized), or high-density environments (where CO formation is efficient). The presence of high density tracers such as HCO+, HCN and CS supports the latter case of a dense core for the component. On the other hand, high are representative of low-density, low-column density, mild-UV environments where CO is photodissociated but atomic carbon is not ionized. For the component, the detection of hot NH3 (5 , Henkel et al. 2008) and large H I optical depth (e.g. Koopmans & de Bruyn, 2005) point toward a low density PDR. Since hot NH3 was not detected at , the high here more likely indicates diffuse or translucent conditions. An absorbing source at with similar diffuse material, albeit a higher of 10, was reported by Srianand et al. (2008).
Atomic C variations could also be explained
by chemical evolution (Maezawa et al., 1999):
since the timescale for conversion of C to CO is comparable
to the dynamical timescale of a dense core ( yr),
is expected to be high in the early stage of dense core
formation and to decrease with time. Hence,
our 2.5 could be indicative of a cloud in an intermediate stage
of evolution from diffuse to dense gas, where C
has not completely converted into CO.
In conclusion, the data presented here demonstrate the ability of the eSMA to provide observers with high angular resolution, high sensitivity observations. Furthermore, they allowed us to investigate the physical and chemical conditions of the material obscuring the SW component of PKS 1830, and determine directly in a dense molecular cloud located at =0.886.
References
- Bottinelli et al. (2008) Bottinelli, S., Young, K. H., Chamberlin, R., Tilanus, R. P. T., & et al. 2008, in SPIE Conference on Astronomical Instrumentation
- Courbin et al. (2002) Courbin, F., Meylan, G., Kneib, J.-P., & Lidman, C. 2002, ApJ, 575, 95
- Federman et al. (1980) Federman, S. R., Glassgold, A. E., Jenkins, E. B., & Shaya, E. J. 1980, ApJ, 242, 545
- Frerking et al. (1989) Frerking, M. A., Keene, J., Blake, G. A., & Phillips, T. G. 1989, ApJ, 344, 311
- Frye et al. (1997) Frye, B., Welch, W. J., & Broadhurst, T. 1997, ApJ, 478, L25
- Gérin et al. (1997) Gérin, M., Phillips, T. G., Benford, D. J., Young, K. H., Menten, K. M., & Frye, B. 1997, ApJ, 488, L31
- Henkel et al. (2008) Henkel, C., Braatz, J. A., Menten, K. M., & Ott, J. 2008, A&A, 485, 451
- Hollenbach & Tielens (1997) Hollenbach, D. J. & Tielens, A. G. G. M. 1997, ARA&A, 35, 179
- Ikeda et al. (2002) Ikeda, M., Oka, T., Tatematsu, K., Sekimoto, Y., & Yamamoto, S. 2002, ApJS, 139, 467
- Israel & Baas (2001) Israel, F. P. & Baas, F. 2001, A&A, 371, 433
- Israel & Baas (2003) —. 2003, A&A, 404, 495
- Israel et al. (2006) Israel, F. P., Tilanus, R. P. J., & Baas, F. 2006, A&A, 445, 907
- Israel et al. (1995) Israel, F. P., White, G. J., & Baas, F. 1995, A&A, 302, 343
- Jansen et al. (1995) Jansen, D. J., Spaans, M., Hogerheijde, M. R., & van Dishoeck, E. F. 1995, A&A, 303, 541
- Jansen et al. (1996) Jansen, D. J., van Dishoeck, E. F., Keene, J., Boreiko, R. T., & Betz, A. L. 1996, A&A, 309, 899
- Jin et al. (2003) Jin, C., Garrett, M. A., Nair, S., Porcas, R. W., Patnaik, A. R., & Nan, R. 2003, MNRAS, 340, 1309
- Keene et al. (1985) Keene, J., Blake, G. A., Phillips, T. G., Huggins, P. J., & Beichman, C. A. 1985, ApJ, 299, 967
- Koopmans & de Bruyn (2005) Koopmans, L. V. E. & de Bruyn, A. G. 2005, MNRAS, 360, L6
- Lidman et al. (1999) Lidman, C., Courbin, F., Meylan, G., Broadhurst, T., Frye, B., & Welch, W. J. W. 1999, ApJ, 514, L57
- Little et al. (1994) Little, L. T., Gibb, A. G., Heaton, B. D., Ellison, B. N., & Claude, S. M. X. 1994, MNRAS, 271, 649
- Maezawa et al. (1999) Maezawa, H., Ikeda, M., Ito, T., Saito, G., Sekimoto, Y., Yamamoto, S., Tatematsu, K., Arikawa, Y., Aso, Y., Noguchi, T., Shi, S.-C., Miyazawa, K., Saito, S., Ozeki, H., Fujiwara, H., Ohishi, M., & Inatani, J. 1999, ApJ, 524, L129
- Mathur & Nair (1997) Mathur, S. & Nair, S. 1997, ApJ, 484, 140
- Menten et al. (1999) Menten, K. M., Carilli, C. L., & Reid, M. J. 1999, in Astronomical Society of the Pacific Conference Series, Vol. 156, Highly Redshifted Radio Lines, ed. C. L. Carilli, S. J. E. Radford, K. M. Menten, & G. I. Langston, 218–227
- Menten et al. (2008) Menten, K. M., Guesten, R., Leurini, S., Thorwirth, S., Henkel, C., Klein, B., Carilli, C. L., & Reid, M. J. 2008, ArXiv e-prints
- Minchin & White (1995) Minchin, N. R. & White, G. J. 1995, A&A, 302, L25+
- Muller & Guélin (2008) Muller, S. & Guélin, M. 2008, ArXiv e-prints
- Muller et al. (2006) Muller, S., Guélin, M., Dumke, M., Lucas, R., & Combes, F. 2006, A&A, 458, 417
- Petitpas & Wilson (1998) Petitpas, G. R. & Wilson, C. D. 1998, ApJ, 503, 219
- Plume et al. (1999) Plume, R., Jaffe, D. T., Tatematsu, K., Evans, II, N. J., & Keene, J. 1999, ApJ, 512, 768
- Schneider et al. (2003) Schneider, N., Simon, R., Kramer, C., Kraemer, K., Stutzki, J., & Mookerjea, B. 2003, A&A, 406, 915
- Srianand et al. (2008) Srianand, R., Noterdaeme, P., Ledoux, C., & Petitjean, P. 2008, A&A, 482, L39
- Stark & van Dishoeck (1994) Stark, R. & van Dishoeck, E. F. 1994, A&A, 286, L43
- Sternberg & Dalgarno (1995) Sternberg, A. & Dalgarno, A. 1995, ApJS, 99, 565
- Sun et al. (2008) Sun, K., Ossenkopf, V., Kramer, C., Mookerjea, B., Röllig, M., Cubick, M., & Stutzki, J. 2008, ArXiv e-prints, 807
- Suzuki et al. (1992) Suzuki, H., Yamamoto, S., Ohishi, M., Kaifu, N., Ishikawa, S.-I., Hirahara, Y., & Takano, S. 1992, ApJ, 392, 551
- van der Tak et al. (2007) van der Tak, F. F. S., Black, J. H., Schöier, F. L., Jansen, D. J., & van Dishoeck, E. F. 2007, A&A, 468, 627
- White et al. (1994) White, G. J., Ellison, B., Claude, S., Dent, W. R. F., & Matheson, D. N. 1994, A&A, 284, L23
- Wiklind & Combes (1996) Wiklind, T. & Combes, F. 1996, Nature, 379, 139
- Wiklind & Combes (1997) —. 1997, A&A, 328, 48
- Wiklind & Combes (1998) —. 1998, ApJ, 500, 129
- Wilson (1997) Wilson, C. D. 1997, ApJ, 487, L49
- Winn et al. (2002) Winn, J. N., Kochanek, C. S., McLeod, B. A., Falco, E. E., Impey, C. D., & Rix, H.-W. 2002, ApJ, 575, 103
| Parameter | DSB continuum | C (3PP0) | 12CO(4-3) |
|---|---|---|---|
| (GHz)aaThe rest and observing frequencies ( and ) are related by , with = 0.88582. | – | 492.16065 | 461.04077 |
| (GHz)aaThe rest and observing frequencies ( and ) are related by , with = 0.88582. | 1.1 mm | 260.97965 | 244.47761 |
| Channel width | 21.5 GHzbbNote that in the 230 GHz band, the eSMA bandwidth is limited by that of the JCMT’s receiver A3 — see text for details. | 0.93 ccCorresponding to a uniform frequency resolution of 0.8 MHz. | 0.99 ccCorresponding to a uniform frequency resolution of 0.8 MHz. |
| Beam FWHM | |||
| Beam P.A. | |||
| Array | eSMA | eSMA | SMA |
| Transition | FWHM | d | aaUsing =10 K for CO, 13CO, C18O, and 15 K for C I. | |||
|---|---|---|---|---|---|---|
| () | () | () | (1017 cm-2) | |||
| [C I] | -19.0 | 0.15cc2 upper limit in 6 channel. | 10.0ddFixed. | 1.6 | 1.6 | 0.6 |
| -7.8 | 0.65 | 15.1 | 10.3 | 10.2 | 2.7 | |
| 5.0 | 0.99 | 12.9 | 13.6 | 13.5 | 2.2 | |
| CO | -19.0bbThese positions/FWHM were constrained to the positions obtained from the fit to the C I transition (within the errors) and/or to the positions/FWHM obtained by Muller et al. (2006). | 0.86 | 13.7 | 12.5 | 2.6 | – |
| -6.5bbThese positions/FWHM were constrained to the positions obtained from the fit to the C I transition (within the errors) and/or to the positions/FWHM obtained by Muller et al. (2006). | 1.59 | 11.0bbThese positions/FWHM were constrained to the positions obtained from the fit to the C I transition (within the errors) and/or to the positions/FWHM obtained by Muller et al. (2006). | 18.6 | 3.8 | – | |
| 6.9bbThese positions/FWHM were constrained to the positions obtained from the fit to the C I transition (within the errors) and/or to the positions/FWHM obtained by Muller et al. (2006). | 2.21 | 13.0bbThese positions/FWHM were constrained to the positions obtained from the fit to the C I transition (within the errors) and/or to the positions/FWHM obtained by Muller et al. (2006). | 30.6 | 6.2 | – | |
| 13CO, C18O | – | 0.1cc2 upper limit in 6 channel. | 10.0ddFixed. | 1.1 | 0.2 | – |
| Source | References | |
| Translucent clouds | 3-6 | Stark & van Dishoeck 1994 |
| Diffuse clouds | 1-80 | Federman et al. 1980 |
| Diffuse material at =2.418 | 10 | Srianand et al. 2008 |
| Molecular clouds | ||
| Ophiucus | 0.05-1 | Frerking et al. 1989 |
| G34.3+0.2 | 0.1-1 | Little et al. 1994 |
| W3, NCG2024, S140, Cep A | 0.1-0.5 | Plume et al. 1999 |
| TMC1, L1527 | 0.06-0.25 | Maezawa et al. 1999 |
| Orion A/B (multi position) | 0.05-0.21 | Ikeda et al. 2002 |
| PDRs (multi positions) | ||
| M17, S140; IC 348 | 0.02-0.25 | Keene et al. 1985; Sun et al. 2008 |
| NGC1977 | 0.03-0.2 | Minchin & White 1995 |
| Orion Bar | 0.04-0.3 | Jansen et al. 1995 |
| S106 | 0.02-0.09 | Schneider et al. 2003 |
| IC 63 (high/low density) | 0.1-0.7 / 2-3 | Jansen et al. 1996 |
| Galaxies | ||
| M33 (4 positions) | 0.03-0.16 | Wilson 1997 |
| IC 342 (center) | 0.5-0.6 | Israel & Baas 2003 |
| NGC 253; Maffei 2 (center) | 0.2-0.3 | Israel et al. 1995; Israel & Baas 2003 |
| M82 | 0.5 | White et al. 1994 |
| M83 (5′′, 5′′) | 0.3 | Petitpas & Wilson 1998 |
| M83 (center), NGC 6946 | 0.9 | Israel & Baas 2001 |
| M51 (center) | 0.4-1.0 | Israel et al. 2006 |
| Spiral at =0.886 | 0.5, 2.5 | This work |