Stellar activity of planetary host star HD 189733††thanks: Based on observations collected with the SOPHIE spectrograph on the 1.93-m telescope at Observatoire de Haute-Provence (CNRS), France, by the SOPHIE Consortium (program 07A.PNP.CONS)
Abstract
Aims. Extra-solar planet search programs require high-precision velocity measurements. They need to determine how to differentiate between radial-velocity variations due to Doppler motion and the noise induced by stellar activity.
Methods. We monitored the active K2V star HD 189733 and its transiting planetary companion, which has a 2.2-day orbital period. We used the high-resolution spectograph SOPHIE mounted on the 1.93-m telescope at the Observatoire de Haute-Provence to obtain 55 spectra of HD 189733 over nearly two months. We refined the HD 189733b orbit parameters and placed limits on both the eccentricity and long-term velocity gradient. After subtracting the orbital motion of the planet, we compared the variability in spectroscopic activity indices with the evolution in the radial-velocity residuals and the shape of spectral lines.
Results. The radial velocity, the spectral-line profile, and the activity indices measured in He I (5875.62 ), H (6562.81 ), and both of the Ca II H&K lines (3968.47 Å and 3933.66 Å, respectively) exhibit a periodicity close to the stellar-rotation period and the correlations between them are consistent with a spotted stellar surface in rotation. We used these correlations to correct for the radial-velocity jitter due to stellar activity. This results in achieving high precision in measuring the orbital parameters, with a semi-amplitude ms-1 and a derived planet mass of MJup.
Key Words.:
techniques: radial velocities - stars: planetetary system - stars: individual: HD 189733 - stars: activity1 Introduction
The precision of radial-velocity (RV) searches for exoplanets depends on the noise induced by photospheric luminosity variations due to active regions (e.g. Santos et al. 2002). Until now, most active stars have been rejected from major RV surveys, but these systems might be interesting objects such as HD 189733. Planets around active stars are now found by research instruments such as CoRoT, and need radial-velocity follow-up (Alonso et al., 2008). Monitoring the activity of active planetary-host stars may provide a means of disentangling radial-velocity variations due to Doppler motion from the noise induced by stellar activity, i.e. dark spots in the photospheric region.
HD 189733 is a well-known planet-hosting system discovered by Bouchy et al. (2005) in a metallicity-biased search for transiting hot Jupiters with the ELODIE spectrograph, then mounted on the 1.93m telescope at Observatoire de Haute-Provence (OHP). It is one of the two brightest transiting systems (V = 7.7) and thus the parameters of the system are well constrained, thanks to a series of detailed spectroscopic and photometric monitoring programs (Bouchy et al., 2005; Bakos et al. 2006b, ; Winn et al., 2007). Such monitoring constrains the orientation of the system and the possibility of there being another planet in the system (Croll et al., 2007; Miller-Ricci et al., 2008). For instance, photometry excluded with high probability the presence of Earth-sized moons and Saturn-type debris rings around the planet, and excluded a massive second planet in outer 2:1 resonance (Pont et al. 2007).
HD 189733 is a chromospherically active star. This dwarf star is classified as a variable of type BY Dra, i.e. K stars with quasiperiodic photometric variations, on timescales ranging from hours to years. Hébrard & Lecavelier des Etangs (2006) detected stellar microvariability in Hipparcos photometric data. Winn et al. (2006) found that HD 189733 exhibits velocity noise or ”photospheric jitter” with an amplitude of 12 m s-1. Henry & Winn (2008) used the optical photometric variability due to spots and plages carried into and out of view as the star rotates to determine the rotation period of the star.
Activity is a signature of stellar magnetism. Moutou et al. (2007) completed spectropolarimetric measurements of HD 189733 to derive theoretical models of planet-star magnetic interaction with quantitative constraints. They observed activity signatures that varyied mostly with the rotation period of the star. They found that the chromospheric-activity index measured in the Ca II H&K lines and Zeeman signatures are consistent with a moderate field being present at the stellar surface that is modulated by the rotation cycle. Shkolnik et al. (2007) monitored the Ca II H&K lines chromospheric index and associated the index variability with an active region rotating with the star. Moreover, they identified an additional flare potentially induced by interactions with the hot Jupiter.
In this article, we monitor activity using all the parameters available from high-precision spectroscopic measurements: radial-velocity, bisector of the lines, and chromospheric indices measured in He I (5875.62 Å), H (6562.81 Å), and the Ca II H&K lines (3968.47 Å and 3933.66 Å, respectively).
Section 2 describes the observations and the data reduction process. The refined parameters of the HD 189733b orbital solution are discussed in Sect. 3. In Section 4, we examine the radial-velocity residuals and the bisector behavior, followed by a study of the chromospheric activity in Sect. 5. In the last section, we analyze the correlation between parameters and how this analysis may be used to disentangle radial-velocity variation from the noise induced by activity-related phenomena.
2 Observations and data reduction
Fifty-five radial-velocity (RV) measurements were obtained between 12 July 2007 and 23 August 2007 with the high-resolution SOPHIE spectrograph (Bouchy et al., 2006) mounted on the 1.93-m telescope at the Observatoire de Haute-Provence, France. We gathered about two exposures per night to sample correctly both the short orbital period ( 2.2 days) and the longer rotation period of the star ( 12 days). This SOPHIE campaign was performed simultaneously with a photometric campaign, discussed shortly hereafter.
The observations were conducted in the high-resolution mode (= 75 000). The simultaneous Thorium-Argon (ThAr) lamp was used to achieve higher precision in RV measurements. The typical exposure time was 6 minutes, sufficiently long to reach an average signal-to-noise ratio (SNR) per pixel of about 80 at = 5500 Å. RVs were determined using a weighted cross-correlation method with a numerical G2 mask: this mask was constructed from the Sun spectrum atlas including up to 3645 lines, following the procedure of Baranne et al. (1996) and Pepe et al. (2002) implemented in the automated reduction package provided for SOPHIE. We removed the first 8 blue spectral orders containing essentially noise and the last 3 orders in the red part that distorted the RV calculation due to the presence of telluric lines. The effective wavelength range used for the RV calculation was between 4311 Å and 6551 Å.
The typical photon-noise error of the measurements was about m s-1 and the mean uncertainty in the wavelength calibration was around m s-1. The main limitation of SOPHIE originates in the Cassegrain Fiber Adaper (developed for the previous ELODIE spectrograph), which is responsible for the guiding and centering system in the fiber entrance. Empirically, the stable stars followed by the SOPHIE Consortium have an accuracy around m s-1 so we added a systematic error of m s-1. Our average error was then around m s-1, which was the quadratical sum of the photon-noise error, the uncertainty in the wavelength calibration, and an estimation of the SOPHIE current systematics.
A perturbation in the apparent radial velocities of the star is caused by the planet blocking part of the Doppler-shifted light from the rotating star. The resulting radial velocity anomaly due to the transit of the planet in front of the star is called the Rossiter-McLaughlin effect. Five measurements were made during the transit time, calculated with ephemerides from Winn et al. (2007). We removed them from the study, plus another measurement of too low SNR ( 20 at nm) due to bad weather.
Background Moon light also polluted part of the exposures, shifting the RV measurements by up to m s-1. Indeed, the sky acceptance of the SOPHIE fiber is 3 arc-second and the spectra are contaminated by sky background. Clouds or full Moon on barycentric Julian date BJD-2454000 = 311 days increases the level of polluting light. The Moon light shifts the measured RVs significantly because the Moon apparent velocity changes from km s-1 to km s-1 between 12 July 2007 and 23 August 2007, whereas the mean RV of the star is around km s-1. The sky background may be recorded using the second fiber feeding the SOPHIE spectrograph but in our case, this fiber was used by the ThAr calibration lamp. Consequently, we removed 16 measurements of RVs and bisectors when there was a significant correlation peak with RV Moon apparent velocity in the second fiber during an exposure of another star in less than two hours of the HD189733 exposures. These spectra were not removed from the activity studies in Sect. 5 because the Moon light did not pollute strongly the flux in the lines used as activity indicators. Finally, 33 measurements of RVs and bisector velocity span were studied. These measurements are available in the version of Table 1 at the CDS, which contains in its cols. 1, 2, and 3, the time in BJD, the RV, and the error in RV, respectively. \onltab1
| BJD [day] | RV [km.-1] | RV error [km.-1] |
|---|---|---|
| 2454294.5084 | -2.0865 | 0.0033 |
| 2454298.3704 | -2.2320 | 0.0037 |
| 2454298.6022 | -2.1180 | 0.0034 |
| 2454299.6075 | -2.3931 | 0.0034 |
| 2454300.3518 | -2.3702 | 0.0034 |
| 2454300.6136 | -2.2123 | 0.0035 |
| 2454301.3613 | -2.1437 | 0.0034 |
| 2454302.3864 | -2.4464 | 0.0035 |
| 2454303.6148 | -2.1555 | 0.0035 |
| 2454304.3853 | -2.4705 | 0.0035 |
| 2454306.3676 | -2.4206 | 0.0038 |
| 2454306.5803 | -2.4638 | 0.0036 |
| 2454306.6077 | -2.4644 | 0.0033 |
| 2454307.3669 | -2.1593 | 0.0034 |
| 2454307.4946 | -2.1057 | 0.0033 |
| 2454307.5826 | -2.0795 | 0.0033 |
| 2454308.3698 | -2.3264 | 0.0033 |
| 2454308.5947 | -2.4465 | 0.0033 |
| 2454309.4000 | -2.2859 | 0.0034 |
| 2454309.5121 | -2.2181 | 0.0033 |
| 2454315.5672 | -2.4759 | 0.0038 |
| 2454316.3922 | -2.1139 | 0.0034 |
| 2454316.5673 | -2.0794 | 0.0034 |
| 2454317.4941 | -2.4306 | 0.0034 |
| 2454317.6281 | -2.4652 | 0.0034 |
| 2454318.3294 | -2.2216 | 0.0036 |
| 2454318.5691 | -2.1097 | 0.0034 |
| 2454328.3935 | -2.3662 | 0.0033 |
| 2454328.5365 | -2.4255 | 0.0042 |
| 2454330.3345 | -2.1936 | 0.0037 |
| 2454334.3945 | -2.0675 | 0.0034 |
| 2454335.3983 | -2.4625 | 0.0035 |
| 2454336.4651 | -2.0804 | 0.0034 |
3 Determination of system parameters
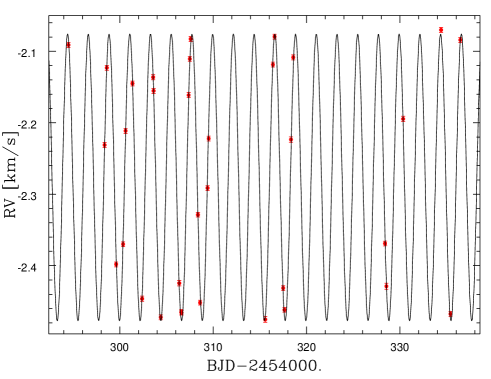
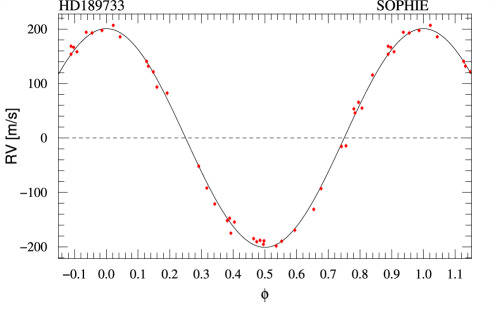
The Keplerian solution was derived for the 33 RV points selected in Sect.2. We fixed the orbital period and the time of periastron, well constrained by previous studies, using transit timing (Pont et al., 2007; Croll et al., 2007; Winn et al., 2007). We used the values estimated by Winn et al. (2007), days and our periastron time was derived from their time of transit center [BJD]. SOPHIE RV measurements were then most accurately fitted with a Keplerian function of semi-amplitude m s-1, an eccentricity consistent with zero and a mean radial velocity km s-1 (Figs. 1 and 2, Table 2), in agreement with previous results (Bouchy et al., 2005; Winn et al., 2006). Our determination of the semi-amplitude is more accurate than the value reported by Bouchy et al. (2005) and the value evaluated from the measurements published by Winn et al. (2006).
A zero value for the eccentricity is satisfactory because one would expect the orbit of the hot Jupiter HD 189733b to be nearly circular due to tidal effects. Nevertheless, Knutson et al. (2007) discussed the possibility of a weak eccentricity , where is the longitude of pericenter for HD 189733b, to explain a time delay of 150 24 s in the photometric observations of the secondary transit. Similarly, Winn et al. (2007) determined the limits the orbital eccentricity and found that eccentricity might be as high as 0.02 if 90°.
We assessed for the detectability of non-zero eccentricity for the orbit of HD 189733b in the RV data set. We used all published RV measurements, a total of 151 values, (Bouchy et al., 2005; Winn et al., 2007) in addition to our own, excluding all measurements for data acquired during the transit. We fitted the data with a long-term linear-velocity gradient , taking into account that HD 189733 has an M dwarf stellar companion (Bakos et al. 2006a) with an orbital period of 3200 years and an RV amplitude of 2 km s-1. The trend identified between the three datasets was =1.4 2.3 m s-1 yr-1. This is consistent with the presence of the stellar companion and does not require a long-period planetary companion to be explained. Leaving and as free parameters, we determined that the eccentricity was lower than 0.008. The long-term velocity gradient does not have a significant effect on the determination of the eccentricity. The result agrees with the value of Winn et al. (2007) and is still consistent with the Knutson et al. (2007) solution introduced to explain the secondary transit delay.
| Parameter | Value |
|---|---|
| Prot [days] | 11.953 0.009a |
| M∗ [M☉] | 0.82 0.03b |
| Pp [days] | 2.2185733 [fixed] c |
| T0 [BJD] | 2453988.24876 [fixed] c |
| TT [BJD] | 2453988.8034 [fixed] c |
| v i∗ [km s-1] | 2.97 0.22 c |
| i [°] | 85.68 0.04 d |
| e | 0.008 |
| V [km s-1] | -2.2765 0.0017 |
| K [m s-1] (before correction) | 200.60 2.32 |
| K [m s-1] (after correction) | 200.56 0.88 |
| Mp [MJup] | 1.13 0.03 |
-
a
Henry & Winn (2008)
-
b
Bouchy et al. (2005)
-
c
Winn et al. (2007)
-
d
Pont et al. (2007)
4 RV residuals and bisectors of the lines
The large ”observed-minus-calculated” (O-C) residuals around the best-fit Keplerian solution are usually explained by activity-induced ”jitter” of the star. Our dispersion value, m s-1, is smaller than the m s-1 measured by Winn et al. (2007) and the m s-1 residuals found by Bouchy et al. (2005). These larger residuals might be due to the amplitude of the stellar-activity jitter decreasing with time (within long-term stellar-activity cycle) and to the lower accuracy of ELODIE spectrograph used by Bouchy et al. (2005).

The cross-correlation function (CCF), calculated for measuring the RVs of the star, corresponds to an average of all the spectral lines. We analyzed the CCF bisector velocity span (Vspan), a measurement of the shape of the CCF as defined in Queloz et al. (2001). Active regions at the stellar surface, such as dark spots or bright plages, induce an asymmetry in the emitted light of the star changing periodically as they move in and out of view with stellar rotation. They then also induce an asymmetry in the line profile that can be measured by the Vspan. An activity phenomenon is characterized by an anticorrelation between the observed radial-velocity (here, the residuals from the fit) and Vspan Queloz et al. (2001). In Figure. 3, the Vspan is anticorrelated with the residuals in agreement with a stellar phenomenon as an explanation of the RV variations. Vspan error bars correspond to twice the size of the RV error bars. The calculation of the Vspan needs two measurements of RV, which provides an approximate estimate of its uncertainty. The linear correlation coefficient is -0.58, implying that the null-hypothesis, i.e. that the 34 observations come from a random sample of two uncorrelated variables, has a probability of lower than 0.1 %. A linear fit to the relation of Vspan versus residuals (O-C) is given by Vspan (O-C).
5 Spectroscopic indices of stellar activity
5.1 Ca II H&K lines

The Ca II H and K lines are broad, deep lines for solar-type stars. Respectively centered on 3968.47 Å and 3933.66 Å, (Fig 4), the emission reversal in the core of the Ca II HK resonant lines, resulting from non-radiative heating of the chromosphere, is indicative of spots and plages, i.e. active regions. When studying the Ca II HK lines in SOPHIE spectra, one must account for the fact that they are located in a spectral region that suffers from contamination from the simultaneously recorded ThAr spectrum. The star spectrum is recorded in fiber A, while the ThAr lamp calibration spectrum is recorded simultaneously in fiber B. The calibration lamp produces a background of scattered light all over the CCD at the level of of the stellar continuum. In order to use the signature of flux emitted in the Ca II lines, we substract this background level from each stellar spectrum. We define our Ca II H+K index following the Mt. Wilson S index (Wilson, 1968; Baliunas et al., 1995):
| (1) |
where H and K are the flux measured in a 1.09 Å wide window centered on each line of the Ca II doublet, and B and V estimate the continuum on both sides with the flux measured in 20 Å wide windows respectively centered on 3900 Å and 4000 Å. We determined the errors of the Ca II index by taking into account the CCD readout and photon shot noise. We were unable to estimate the error due to the background substraction because it depends on too many parameters: SNR, exposure time, elevation of the target, and the weather. So, this index is mainly dominated by systematics.
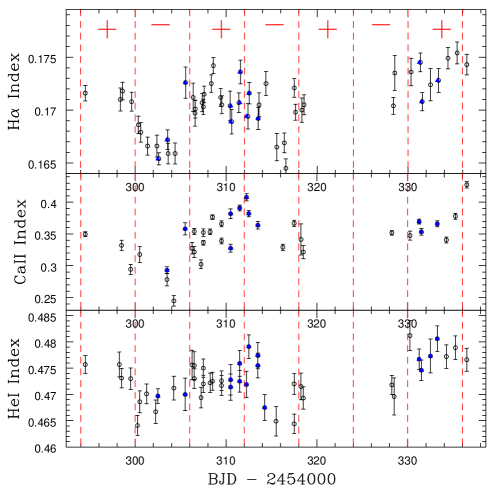
We removed from this study all spectra for which the Ca II spectral range had insufficient flux due chiefly to the atmospheric refraction that dispersed the blue part of the spectra more significantly. We plot the calculated index for the remaining 38 spectra as a function of time in Fig. 5 (middle panel) and observe a decrease in the activity level around days.
5.2 H line
The H line at (Fig. 4) is similarly sensitive to the mean chromospheric activity (Kürster et al., 2003; Bonfils et al., 2007). H is less affected by the flux of the ThAr calibration lamp than Ca II lines. We defined our index as described in Bonfils et al. (2007):
| (2) |
with sampling the H line and and the continuum on both sides of the line. The interval is 0.678 Å wide and centered on , while and are integrated over and , respectively. The errors bars are also calculated in a similar way.
We used all 55 available spectra. Figure 5 shows the variations in the H index with time; it is characterised by a lower noise level than the Ca II index, as expected, and by two dips in the activity level around 303 and 316 days.
5.3 He I line
The absorption line of the He I D3 triplet at (Fig. 4) is a signature of a non-radiative heating processes. The He I is known to be a tracer of the solar plages (Landman 1981). Since it is sensitive to the heating of the chromosphere (Saar et al. 1997), this absorption line is also a diagnostic of stellar magnetic activity. We define the He I index in a similar way to that for H :
| (3) |
with sampling the He I line, and and representing the continuum on both sides of the line. Our is centered on and is wide, while and are integrated over and , respectively.
The He I line is located at the borders of two spectral orders in our SOPHIE spectra and is far noisier than the H line. Moreover, in this region of the spectra, telluric lines increase the noise level. Nevertheless, two decreases of the index around 302 and 315 days are evident in Fig. 5, and perhaps a partial third one around 328 days. The behavior of this index reinforces the active region interpretation.

Shkolnik et al. (2007) identified the presence of an additional variability or flaring in the Ca II cores of HD 189733, potentially induced by interactions with the hot Jupiter. We also used the H activity index to study the chromospheric variability as a function of the planet’s orbit, since it is less affected by noise than the Ca II index in our data. Removal of the main modulation induced by stellar rotation was completed by estimating a sinusoidal fit of the nightly averaged H indices. We did not detect significant modulation in the residual activity index with the orbital phase, as shown in Fig. 6. This result differs from the tentative conclusion by Shkolnik et al. (2007), which was based on a 4-night data set. It is possible that Ca II and H indices are not strongly correlated in this star, which may explain the different behavior that we observe. Alternatively, it could be another demonstration of the on/off nature of star-planet interactions (as argued by Shkolnik et al. 2007).
6 Discussion
6.1 Periodicity of the parameters
The period derived from an active region is not expected to be exactly the rotation period of the star. As for the Sun, HD 189733 exhibits differential rotation, with the poles rotating more slowly than the equator (Moutou et al. 2007, Farès et al., in prep.). We had insuficient data to determine exactly the period of our indices of activity. So, we were unable to estimate the latitude of the main active region. The rotation period of the star has been most reliably determined by Henry & Winn (2008). They measured days by analysing the quasiperiodic photometric variability observed during about one year.
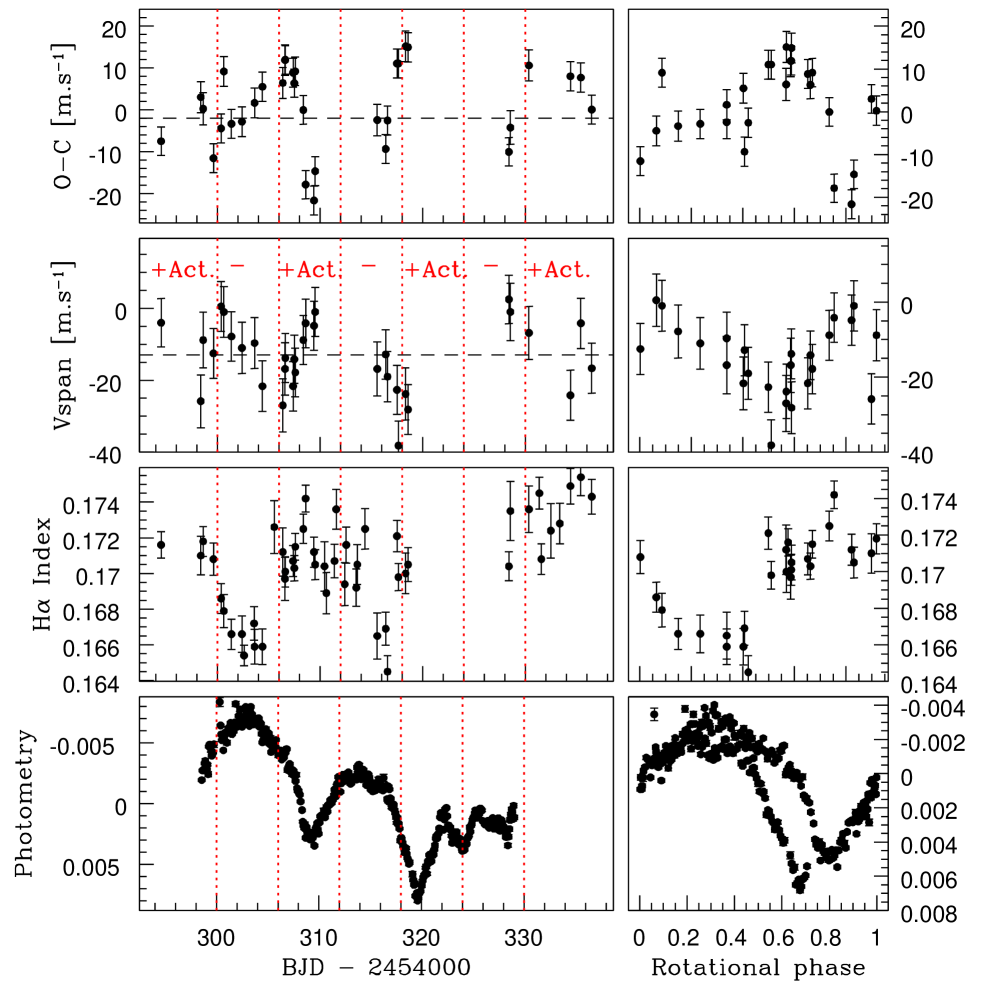
In Fig. 7, both the residual RV jitter and the bisector span
appear to exhibit periodic variations on a timescale to the rotation period of the star of 12 days. This periodicity was consistent with consideration of the parameters as a function of stellar rotational phase. We excluded the data points after days because data points in this time interval were not in phase with the previous ones. We may infer that the main active region moved at this period. This is in agreement with the stellar classification for which spots are known to evolve quickly. In the same Fig. 7, the lowest levels of activity in the H line are separated by about 12 days. The 12-day variation exhibited by the H index becomes more obvious when plotted as a function of the rotational phase. We excluded the data points after days that had clearly a higher level of activity than for the days before. The spectroscopic line profile, the indices of chromospheric emission, and the radial-velocities (O-C) therefore exhibit periodic variability around the rotation period of the star.
6.2 Correlations of the parameters
By searching for the variations in the different parameters together in Fig. 7, we can conclude that they are consistent with one main active region on the stellar surface, as a first approximation for multiple active regions. Henry & Winn (2008) estimated a lower limit of i∗ 54° for the inclination of the stellar equator with respect to the sky plane. This is consistent with the fact that the timescale of the maximum-minimum activity is around half a rotation period.
We selected the H index as an indicator of activity variability since it was the most sensitive index. The activity variations exhibit roughly a quarter-phase shift with respect to the radial-velocities and line profile variations. This fact is in agreement with an observed stellar activity (Queloz et al., 2001) and a model of a dark spot rotating with the stellar surface and moving in and out of view. In Figure 8, we also plot the residuals from the Keplerian fit (O-C) as a function of the chromospheric activity index. We observe a loop pattern as expected for an active region, which features a dark spot rotating on the stellar surface as already described by Bonfils et al. (2007). The quarter-phase shift and the loop pattern results from the same correlation. When the activity level is at its maximum and the spot is on the central meridian of the star, it occupies symmetrically the approaching and the receding halves of the stellar disk, and we do not expect the RV to be perturbed. Similarly, when the spot is out of sight, the activity level is at a minimum and the impact on the RV should be negligible, in addition to the impact on the line shape. On the other hand, when the spot appears or disappears on the visible stellar disk, it lies on the rotationally blue-shifted or red-shifted half part of the stellar surface and induces an asymmetry in the velocity distribution of the emitted flux. Thus, when the dark spot appears (disappears), the activity index is at its middle level and the RV effect is minimum (maximum), while the Vspan is anticorrelated with the RV.

6.3 MOST photometric data
Our observations of HD 189733 can be compared with those taken simultaneously with the MOST microsatellite. MOST (Walker et al. 2003; Matthews et al. 2004) is an optical microsatellite that is designed to observe nearby, relatively bright stars through a single broadband (350-700 nm) filter using a 15/17.3 cm Rumak-Maksutov telescope. MOST observed HD 189733 for over 31 days in 2007. The 2007 observations, reduction and resulting analysis is discussed in Rowe et al. (in prep.). For comparison with the SOPHIE observations, we present the MOST observations of HD 189733 in 2007 in Fig. 7 (bottom panels). The MOST lightcurve has the transits of the known planet removed, the data is binned to the orbital period of the satellite ( 101.43 minutes). A long-term linear trend of 5.710-4 mag day-1 is removed in the right panel of the Fig. 7 in order to emphazise the correlations with the other parameters. The comparison stars do not exhibit this drift, suggesting that the drift is real. Since the timescale for the drift appears to be much longer than the length of the observations, one can only speculate to its cause. As can be seen in the bottom panel of Fig. 7, HD 189733 displayed 1% variations in flux that were most likely due to starspot modulation over 2.5 rotation cycles of the star in optical light during the MOST observations. In 2006, during the same period, MOST observations of HD 189733 displayed 3% variations in flux (Croll et al. 2007). The difference in the amplitude of the variation may be due to a decrease in amplitude of the stellar activity jitter with time due to a long-term activity cycle of the star. This interpretation is only speculation but would agree with the decrease in the (O-C) residuals around the fit in RV observed by the successive RVs campaigns in 2005, 2006, and 2007 discussed in Sect. 4.
MOST photometric data exhibit variations in the stellar flux with a periodicity of about 11 days. When the MOST data were acquired simultaneously with the SOPHIE data, the maximum flux agrees with the minimum of activity, showing that the variation in emitted flux of the star is dominated by dark spots. Between BJD-2454000 = 318 and 329 days, the photometric curve seems to present a new main active region. The minimum flux at BJD-2454000 = 319.5 days comes just 10 days after the previous minimum and is also deeper than the previous one. Moreover, a third shallow minimum occurs at BJD-2454000 = 324 days, and the maximum flux at BJD-2454000 = 329 days comes later (12 days) than the previous maximum. This corresponds to the fact that the radial-velocities residuals, Vspan, and H index data after BJD-2454000 = 328 days are not in phase with their previous values before BJD-2454000 = 320 days.
6.4 Profile of the CCF
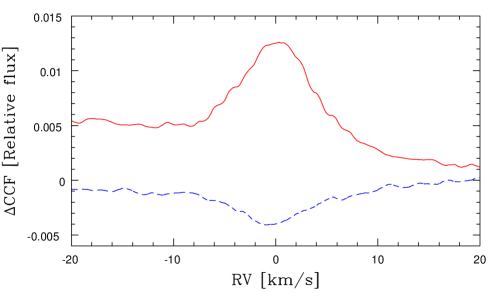
Using the fact that the CCF is equivalent to an average of all spectral lines, we compared the profile of the CCF when the star was both at its maximum level of activity and its lowest activity level. The abscissa of each CCF was first corrected for the orbit of the planet. All the available spectra unaffected by the background Moon light were used to compute the mean CCF. On the other hand, we summed selected spectra to compute a mean CCF at maximum activity level (MaxCCF) and a mean CCF at minimum activity level (MinCCF). The mean CCF was subtracted from MaxCCF and MinCCF. The resulting profiles are plotted in Fig. 9. When the star was at its maximum level of activity, the difference (MaxCCF-Mean) was positive whereas at its minimum level of activity, the difference (MinCCF-Mean) was negative. This result could be explained by the presence of dark spots when the star was at its maximum level of activity. Dark spots have a lower temperature and exhibit different absorption lines than those of the star. The spectrum of the dark spot may be closer to that of an M-dwarf. When there are dark spots on the stellar surface, the lines of the K2V star are shallower. This result shows that the parameters of the CCF may be used to characterize the variation in the stellar activity.
6.5 Improvement of RV measurements
In a similar way to Melo et al. (2007), we corrected the radial-velocity measurements for the stellar activity and refined the orbital parameters of the planetary system. We used the least-square fit between the residuals (O-C) and Vspan according to Fig. 3, as determined in Sect. 4. We added the least-square fit between (O-C) and Vspan to the residuals (O-C) data points. We then adjusted the most accurately determined Keplerian fit to the corrected radial velocities (new residuals summed to values of the previous orbit). As in Sect. 3, we fixed the orbital period, the time of periastron, and the eccentricity. We derived lower residuals from the fit of 3.7 m s-1, compared with 9.1 m s-1 before correction. These lower residuals are in agreement with the estimated current systematics on SOPHIE measurements discussed in Sect. 2. The error bars on the semi-amplitude of the orbit are also smaller with = 200.6 0.9 m s-1, compared with = 200.6 2.3 m s-1 before correction. Using the mass of the star = 0.82 0.03 M☉ given by Bouchy et al. (2005), we found a planet mass of = 1.13 0.03 MJup. Our result agrees exactly with the value of 1.13 0.03 MJup reported by Winn et al. (2006), and it is also in agreement with the Bouchy et al. (2005) value of 1.15 0.04 MJup. The current uncertainty in is dominated by the error in .
7 Conclusion
We have observed the transiting planetary system HD 189733 with the high-resolution SOPHIE spectrograph, with the aim of correcting the parameters of the planetary orbit for the effect of radial-velocity variations due to activity on the stellar surface. We refined the HD 189733b orbital parameters and placed limits on both the orbital eccentricity and long-period variation. After subtracting the orbital motion of the known planet, the radial-velocity residuals were correlated with the spectroscopic activity indices and the shape of spectral lines. Chromospheric activity tracers and surface photometry were modulated mainly by the 12-day rotational period of the star. However, the relation that we have derived between the bisector span and radial-velocity residuals is the most accurate yet and allows a precise correction for stellar jitter. The error in the derived semi-amplitude of the orbit is reduced by a factor of 2.5 after applying this correction law and reduced to close to the instrumental limit, allowing a more precise estimate of the companion’s mass.
This result is promising for radial-velocity surveys, which cannot continue to avoid targeting active stars. Additionally, radial-velocity instruments have to perform follow-up observations for photometric planet search programs, which are less sensitive to the stellar activity for detecting transits. In case the use of a single correlation is insufficient, the use of several indices allows one to be more confident of accounting for the main active regions and provides stellar-variability diagnostics. In the present study, the bisector span was found to be the most reliable parameter. In the case of the bright star HD 189733, this method of correction is a good compromise. But, if the correction decreases the activity jitter, it also increases the Vspan photon-shot noise in the corrected radial-velocity measurements. This method has therefore to be tested further on other systems, to estimate the confidence in the corrected RVs and, subsequently, to apply similar analyses in planet-search programs. Finally, a clearer understanding of the stellar intrinsic variability will have a positive impact on identifying and studying activity features potentially triggered by star-planet interactions.
Acknowledgements.
N.C.S. would like to thank the support from Fundação para a Ciência e a Tecnologia, Portugal, in the form of a grant (references POCI/CTE-AST/56453/2004 and PPCDT/CTE-AST/56453/2004), and through programme Ciência 2007 (C2007-CAUP-FCT/136/2006). We would like to thank the referee, M. Kürster, for all his useful comments, which helped to improve this paper.References
- Alonso et al. (2008) Alonso, R., Auvergne, M., Baglin, A. et al. 2008, A&A, 482, 21
- (2) Bakos, G. A., Pàl, A., Latham, D. W., Noyes, R. W., Stefanik, R. P. 2006a, ApJ, 641, L57
- (3) Bakos, G. A., Knutson, H., Pont, F. et al. 2006b, ApJ, 650, 1160
- Baliunas et al. (1995) Baliunas, S. L., Donahue, R. A., Soon W. H. et al. 1995, ApJ, 438, 269
- Baranne et al. (1996) Baranne, A., Queloz, D., Mayor, M. et al. 1996, A&A, 119,373
- Bonfils et al. (2007) Bonfils, X., Mayor, M., Delfosse, X. et al. 2007, A&A, 474, 293
- Bouchy et al. (2005) Bouchy, F., Udry, S., Mayor, M. et al. 2005, A&A, 444, L15
- Bouchy et al. (2006) Bouchy, F. & The SOPHIE Team. 2006 in Tenth Anniversary of 51 Peg-b: Status of and prospects for hot Jupiter studies, ed. L. Arnold, F. Bouchy, & C. Moutou, 319-325
- Croll et al. (2007) Croll, B., Matthews, J. M., Rowe, J. F. et al. 2007, ApJ, 671, 2129
- (10) Farés, R. et al., in prep.
- Hébrard & Lecavelier des Etangs (2006) Hébrard, G. & Lecavelier des Etangs, A. 2006, A&A, 445, 341
- Henry & Winn (2008) Henry, G. W., & Winn, J. N. 2008, AJ, 135, 68
- Knutson et al. (2007) Knutson, H. A., Charbonneau, D., Allen, L. E. et al. 2007, Nature, 447, 183
- Kürster et al. (2003) Kürster, M., Endl, M., Rouesnel, F., et al. 2003, A&A, 403, 1077
- Landman (1981) Landman, D.A. 1981, ApJ, 244, 345
- Matthews et al. (2004) Matthews, J.M. et al. (2004), Nature, 430, 51
- Melo et al. (2007) Melo, C., Santos, N. C., Gieren, W. et al. 2007, A&A, 467, 721
- Miller-Ricci et al. (2008) Miller-Ricci, E., Rowe, J. F., Sasselov, D. et al. 2008, arXiv: 0802.2722
- Moutou et al. (2007) Moutou, C., Donati, J.-F., Savalle, R. et al. 2007, A&A, 473, 651
- Pepe et al. (2002) Pepe, F., Mayor, M., Galland, D. et al. 2002, A&A, 388, 632
- Pont et al. (2007) Pont, F., Gilliland, R. L., Moutou, C. et al. 2007, A&A, 476, 1347
- Queloz et al. (2001) Queloz, D., Henry, G. W., Sivan, J. P. et al. 2001, A&A, 379, 279
- (23) Rowe, J.F. et al., in prep.
- Saar et al. (1997) Saar, S. H., & Donahue, R. A. 1997, ApJ, 485, 319
- Santos et al. (2002) Santos, N. C., Mayor, M., Naef, D. et al. 2002, A&A, 392, 215
- Shkolnik et al. (2007) Shkolnik, E., Bolhender, D. A., Walker, G. A. H. and Cameron, A. C. 2007, ApJ, 676, 628
- Walker et al. (2003) Walker, G.A.H. et al. (2003), PASP, 115, 1023
- Wilson (1968) Wilson, O.C. 1968, ApJ, 153, 221
- Winn et al. (2006) Winn, J. N., Johnson J. A., Marcy G. W. et al. 2006, ApJ, 653, L69
- Winn et al. (2007) Winn, J. N., Holman, M. J., Henry G. W. et al. 2007, AJ, 133, 1828