Integral Field Spectroscopy of two radio galaxies at z2.3
Abstract
Aims. In this article we study the morphology, kinematics and ionization properties of the giant ionized gas nebulae surrounding two high redshift radio galaxies, 4C40.36 (2.27) and 4C48.48 (2.34).
Methods. Integral Field Spectroscopy observations were taken using the PPAK bundle of the PMAS spectrograph, mounted on the 3.5m on the Calar Alto Observatory, in order to cover a field-of-view of 6472 centered in each radio galaxy. The observations spanned over 5 nights, using two different spectral resolutions (with FWHM4Å and 8Å respectively), covering the optical wavelength range from 3700Å to 7100Å, which corresponds to the rest-frame ultraviolet range from 1100Å to 2000Å . Various emission lines are detected within this wavelength range, including Ly (1216Å), NV (1240Å), CIV (1549Å), HeII (1640Å), OIII] (1663Å) and CIII] (1909Å). The dataset was used to derive the spatial distribution of the flux intensity of each of these lines and the gas kinematics. The properties of the emission lines in the nuclear regions were studied in detail.
Results. In agreement with previous studies, we find that both objects are embedded in a large ionized gas nebula, where Ly emission is extended across 100 kpc or more. The CIV and HeII emission lines are also spatially extended. The nebulae are generally aligned with the radio axis, although we detect emission far from it. In 4C+48.48, there is a band of low Ly/CIV running perpendicular to the radio axis, at the location of the active nucleus. This feature might be the observational signature of an edge-on disk of neutral gas. The kinematics of both nebulae are inconsistent with stable rotation, although they are not inconsistent with infall or outflow.
Key Words.:
Galaxies: active – Galaxies: high-redshift – (Galaxies:) quasars: emission lines1 Introduction
High redshift radio galaxies (HzRGs) are often surrounded by giant Ly nebulae which sometimes extend for more than 100 kpc (e.g., McCarthy et al. 1990a; Reuland et al. 2003; Villar-Martín et al. 2003; Villar-Martín et al. 2007b) and sometimes beyond the radio structure (e.g., Eales et al. 1993; Kurk et al. 2002; Maxfield et al. 2002). Giant Ly nebulae have also been found associated with other classes of high- object, both active and non active ones, radio loud and radio quiet (e.g., Christensen et al. 2006; Steidel et al. 2001). They are frequently aligned with the radio axis (McCarthy et al. 1995), showing an irregular morphology (e.g., Reuland et al. 2003).
In the rest-frame ultraviolet (UV) wavelength range, the giant nebulae associated with HzRGs show a variety of strong emission lines, with Ly usually being the brightest, followed by CIV1550, HeII1640 and CIII] (hereafter CIV, HeII and CIII]). A multitude of weaker lines have also been detected in deep spectra (e.g. Vernet et al. 2001). Based on comparisons between emission line ratios and various ionization models, the line emitting gas is substantially enriched with metals, and is ionized predomonantly by the hard radiation field of the active nucleus (e.g., Vernet et al. 2001; Humphrey et al. 2008). In a few extreme cases, however, young stars or shocks may also make a significant contribution to the ionization of this gas (e.g. Villar-Martín et al. 2007a; Maxfield et al. 2002). The nebulae have typical masses of 109-10 M⊙, Ly luminosities of the order of 1043-44 erg s-1 and electron densities of a few to several hundred cm-3 (e.g.,McCarthy 1993; Reuland et al. 2003).
These nebulae often show high velocity dispersions (FWHM1000 km s-1 ) associated with, and confined by, the radio structures (e.g., Villar-Martín et al. 2003). It is likely that these large velocity dispersions are a consequence of interactions between the radio structure and the ambient interstellar medium, which are thought to result in outflows (e.g., Villar-Martín et al. 2003; Humphrey et al. 2006; van Ojik et al. 1997).
In addition, the giant nebulae associated with HzRGs also contain gas with significantly lower velocity dispersions, which shows no clear relationship with the radio source, and in many cases is observed to extend far beyond it (i.e., 500 km s-1 : Villar-Martín et al. 2002; 2003). These nebulae seem to be present too, although not in all the cases, in another kind of AGNs, like radio-quiet QSOs (e.g., Christensen et al. 2006, Husemann et al. 2008). Humphrey et al. (2007) have recently proposed that this quiescent gas is in infall towards the central regions of the host galaxy. The importance of this gas in feeding the AGN activity, as a reservoir of gas for galaxy assembling at high-redshift (e.g., di Matteo et al. 2005), or its role in the AGN feedback process is still unclear (e.g., Kang et al. 2007; Best 2007).
Most previous studies of the giant ionized nebulae around HzRGs have been undertaken using long-slit spectroscopy, usually with the slit aligned with the radio structure (e.g. Villar-Martín et al. 2003). A few other studies have made use of narrow band images of Ly (e.g. Reuland et al. 2003). While both of these types of observation have resulted in a significant expansion in our understanding of the giant nebulae, they were limited by a lack of spatial information or a lack of spectral information, respectively. Integral field spectroscopy (IFS) has a clear advantage over both of these methods, in that spectral and 2-dimensional spatial information can be obtained simultaneously. For this reason, we began an observational program of IFS of powerful HzRGs at 2-3 using VIMOS on the VLT, and PMAS/PPAK on the 3.5m telescope at the Calar Alto Observatory (Villar-Martín et al. 2006; Villar-Martín et al. 2007). The main goal of this programme is to characterize the morphology, kinematics and ionization conditions of the extended ionized gas surrounding these objects.
In this paper, we present our results based on PPAK observations of two powerful HzRGs, 4C40.36 (2.27) and 4C48.48 (2.34). Both were selected from the 4C ultrasteep spectrum compendium (e.g. Chambers et al. 1996a and reference therein), and are known to have spatialy extended, low surface brightness emission-line nebulae (Chambers et al. 1996b). Longslit spectroscopy for these two sources has been presented by Vernet et al. (2001) and Villar-Martín et al. (2003).
The layout of this article is as follows: In section 2 we give details of the observational strategy and data reduction. In section 3 we describe the analysis of the data, including the analysis of the two dimensional distribution of intensity of the different emission lines (Sec. 3.1), and the line fitting (Sec. 3.2). In section 4 we present the different results from the analysis, describing the the properties of the nuclear spectra (Sec. 4.1), the morphology of the emission lines (Sec. 4.2), the ionization conditions at different locations (Sec. 4.3), and the gas kinematics (Sec. 4.4). In section 5 we discuss the results, and summarise the conclusions of this paper.
2 Observations and data reduction
The observations were carried out between May the 31st and June the 4th 2005, at the 3.5m telescope of the Calar Alto observatory, using the Potsdam MultiAperture Spectrograph (PMAS: Roth et al. (2005)) in the PPAK mode (Verheijen et al. (2004); Kelz et al. (2006)). The atmospheric conditions were stable, with clear nights, but were not photometric. The seeing was variable, ranging between 0.7 and 1.2.
The PPAK fibre bundle consists of 382 fibres of 2.7” diameter each (see Fig.5 in Kelz et al. 2006). Of these, 331 fibres (the science fibres) are concentrated in a single hexagonal bundle covering a field-of-view of 72”64”, with a filling factor of 65%. The sky is sampled by 36 additional fibres, distributed in 6 bundles of 6 fibres each, located following a circular distribution at 90” of the center and at the edges of the central hexagon. The sky-fibres are distributed among the science ones in the pseudo-slit, in order to have a good characterization of the sky. The remaining 15 fibres are used for calibration purposes, as described below. Cross-talk between adjacent fibres is estimated in less than a 5% when using a pure aperture extraction (see below). The distribution of the fibres in the pseudo-slit does not follow any regular distribution in comparison with their distribution in the focal plane of the telescope (Kelz et al. 2006), which minimizes evenmore the effect of the cross-talk. Two different gratings with different resolutions, wavelength coverage and exposure times were used. Table 1 gives a log of the observations, including the date, the grating, the wavelength range covered, the instrumental resolution (FWHM of the sky-emission lines), the wavelength sampling at the detector, the target, and the exposure time (number of exposures length of individual exposures). The FWHM of the instrumental profile corresponds to 424 km s-1 for the V600 grating, and 672 km s-1 for the V300 grating, at the redshifted wavelength of Ly.
| Date | Grating | Wavelength | FWHM∗ | Sampling | Object | Exposure |
| range (Å) | (Å) | (Å/pix) | Time (sec) | |||
| 31/05/05 | V600 | 3700-5350 | 3.9 | 1.5 | 4C40.36 | 5x1800 |
| 01/06/05 | V600 | 3700-5350 | 3.9 | 1.5 | 4C40.36 | 5x1800 |
| 02/06/05 | V300 | 3700-7100 | 7.8 | 3.2 | 4C40.36 | 4x1800 |
| 03/06/05 | V600 | 3700-5350 | 3.9 | 1.5 | 4C40.36 | 3x1800 |
| 04/06/05 | V600 | 3700-5350 | 3.9 | 1.5 | 4C40.36 | 3x1800 |
| 01/06/05 | V600 | 3700-5350 | 3.9 | 1.5 | 4C48.48 | 6x1800 |
| 02/06/05 | V300 | 3700-7100 | 7.8 | 3.2 | 4C48.48 | 5x1800 |
| 03/06/05 | V600 | 3700-5350 | 3.9 | 1.5 | 4C48.48 | 5x1800 |
| 04/06/05 | V600 | 3700-5350 | 3.9 | 1.5 | 4C48.48 | 3x1800 |
(*) Errors are too low to be quoted.
Data reduction was performed using R3D (Sánchez (2006)), in combination with IRAF packages (Tody (1993))111IRAF is distributed by the National Optical Astronomy Observatories, which are operated by the Association of Universities for Research in Astronomy, Inc., under cooperative agreement with the National Science Foundation. and E3D (Sánchez (2004)). The reduction consists of the standard steps for fibre-based integral-field spectroscopy. A master bias frame was created by averaging all the bias frames observed during the night and was subtracted from the science frames.
The individual exposures from each night (see Table 1) were then combined using IRAF routines, clipping any probable cosmic rays. The location of the spectra in the CCD was determined using a continuum illuminated exposure taken before the science exposures. Each spectrum was extracted from the science frames by coadding the flux within an aperture of 5 pixels around this location along the cross-dispersion axis for each pixel in the dispersion axis, and was stored in a row-staked-spectrum file RSS (Sánchez (2004)). Wavelength calibration was performed using a HeHgCd lamp exposure obtained from archive data, and corrected for distortions using ThAr exposures obtained simultaneously to the science exposures through the calibration fibres (indicated above). Differences in the fibre-to-fibre transmission throughput were corrected by comparing the wavelength-calibrated RSS science frames with the corresponding continuum illuminated ones. The sky emission was determined by using the spectra obtained throughout the sky-fibres, interpolating to recover the sky-spectrum at the location of any other fibre as described in Sánchez (2006), and it was then subtracted from the science spectra. Each night we obtained spectra of the spectrophotometric standard star Hz44 that we used to perform the flux calibration. The galactic extinction is low towards both objects (E(B-V)=0.062 and E(B-V)=0.089 mags, for 4C40.36 and 4C48.48 respectively), and hence no correction for galactic extinction was applied to the data. Any uncertainties introduced by not applying the extinction correction are expected to be quite substantially smaller than those introduced by our flux calibration. The large size of the fibres and the low air-mass of the object during the observations minimize the effects of the differential atmospheric refraction. We checked its possible effect by inspecting the location of field stars across the field-of-view at each wavelength, finding no appreciable displacement. Thus, we did not perform a correction for this effect.
Once reduced, the different exposures taken on different nights were combined to produce a final frame for each grating setting. The final combined exposures times were 28800s for 4C40.36 with the V600 grating and 7200s with the V300 one, and 25200s for 4C48.48 with the V600 grating and 9000s with the V300 one. We estimate the depth of the combined exposures as follows. First, we measuring the standard deviation of the background in a wavelength region free of emission. Then, we calculate the flux of an emission line with a FWHM similar to the instrumental profile and an average flux per pixel of 3 times the background standard deviation. The resulting 3 detection limit for an emission line ranges between 2-5 10-17 erg s-1 cm-2 arcsec-2for the four final datacubes.

3 Data analysis
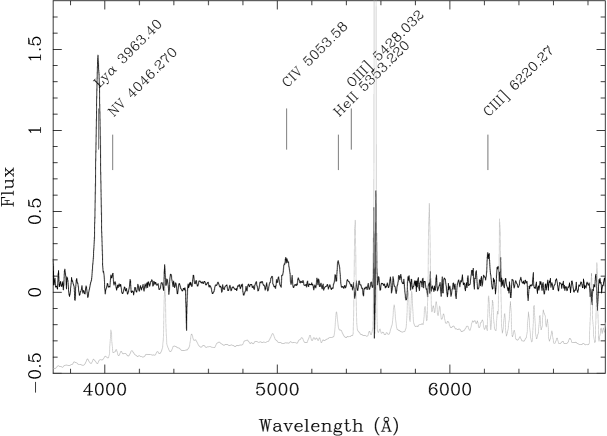
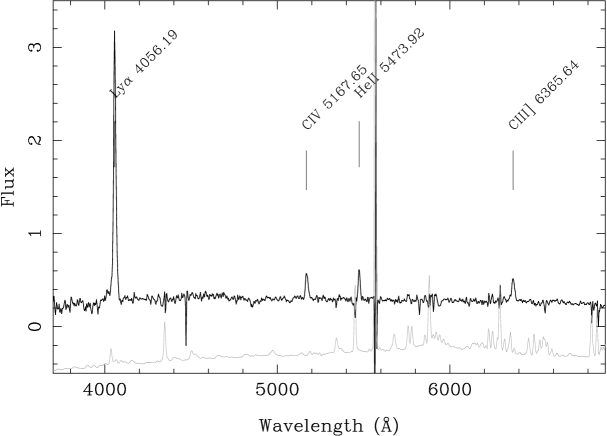
The wavelength range of our V300 data includes the redshifted Ly (1216Å), NV (1240Å), CIV (1549Å), HeII (1640Å), OIII] (1663Å) and CIII] (1909Å) lines. In the case of the data using the V600 grating, only Ly (1216Å), NV (1240Å) and CIV (1549Å) fell within the spectral coverage. We extracted the spectrum of the fibre corresponding to the peak intensity of Ly by using E3D, for each object and grating (ie., a 2.7 aperture spectrum). Figure 1 shows these extracted spectra for each object corresponding to the V300 grating data, together with a label for each of the previously listed emission lines detected in the spectra and their corresponding observed wavelength. Based on these wavelengths the estimated redshifts were for 4C40.36, and for 4C48.48, similar to the objects’ nominal redshifts.
3.1 Emission line images and spatial registration
Prior to perform any further analysis the IFS data were spatially registered with astrometric calibrated images, in order to place correctly the detected structures in the sky. For this, we extract narrow-band images at the redshifted wavelength of each of the detected emission lines and the adjacent continuum, blueshifted and redshifted with respect to the emission line. The width of all the narrow-band images were fixed to 116Å, which basically corresponds to the typical width of a standard narrow-band filter (FWHM80-100Å). It is important to note here that we are considering to wavelengths in the observer-frame. Once extracted the narrow-band images, the adjacent continua images were combined and subtracted to the emission line ones, obtaining, for each line, an emission line image free of continuum. Since the typical FWHM of these lines is much narrower than the selected width for the narrow-band images it is expected that the noise increases somewhat after continuum subtration. However, using this width the obtained emission line images can be directly compared with similar published narrow-band images. On the other hand, selecting this width we ensure that all the flux from the emission lines, even the wings, are included in the narrow-band images. We checked the results creating images with narrower bands (50Å), and we found no significant differences in the results. In addition a broad-band image comprising all the wavelength range of our V300-grating data was extracted from the datacubes (3700-7100Å). This image is dominated by the continuum emission of the sources within the field-of-view (appart from the HzRGs, in which the Ly still dominates).
To register the IFS data we first compare the Ly emission line images with those ones published by Chambers et al. (1996). For 4C40.36 they published a registered U-band image, which samples Ly at the redshift of the object. The peak of the Ly emission is coincident with that of the UV continuum emission in this object, as shown in the available Keck spectra (e.g., Villar-Martín et al. 2006, Humphrey 2005). We register the peak of the Ly emission image to the coordinates of the peak emission of the Chambers et al. (1996) U-band image. For 4C48.48 Chambers et al. (1996) published a registered Ly narrow-band image of 60Å bandpass. The Ly emission shows a well defined peak in this image. We used the coordinates of this peak to register our Ly image. Once registered the Ly images the rest of the narrow-band images and IFS data were registered using this astrometric solution. Taking into account the original size of the PPAK fibres, and the errors in the astrometry of the Chambers et al. (1996) images, we expect an accuracy not worse than 0.5 in the image registration.
We perform an independent check of the performed spatial registration. The coordinates of the field stars within the field-of-view of the IFS data, derived from the broad-band continuum image described before, where compared with those coordinates derived from the corresponding Digitized Sky Survey (DSS) POSS2 blue-band images. We found 5 stars in the field-of-view of the 4C40.36 IFS data and 9 more in the field-of-view of the 4C48.48 one. The coordinates of these stars match within an standard-deviation of 0.3, which we consider the typical uncertainty of our spatial registration.
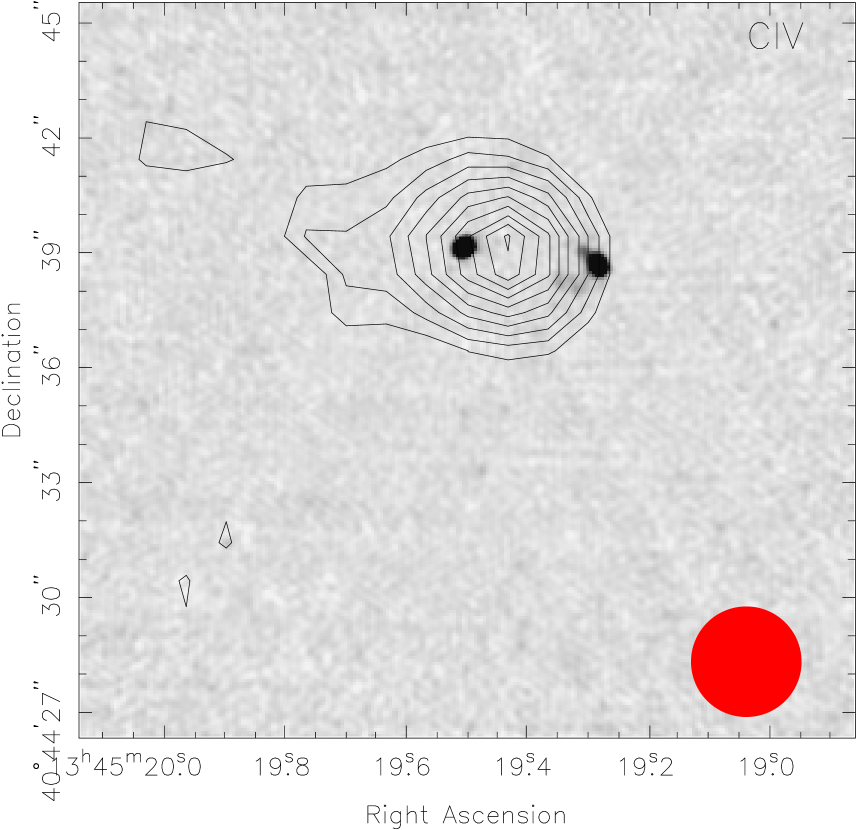
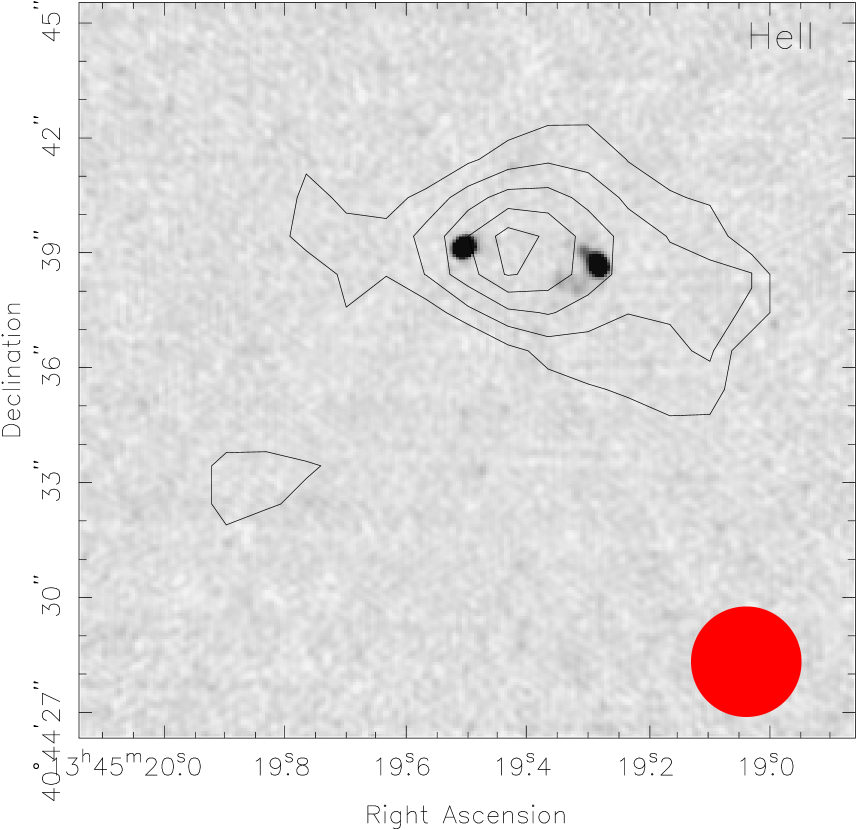
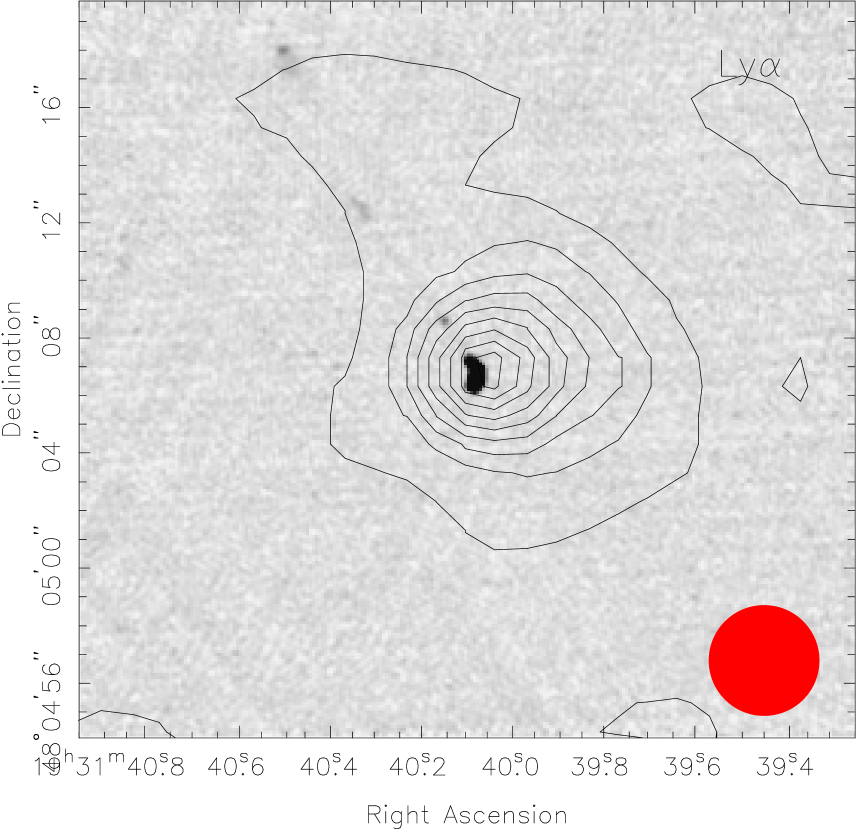
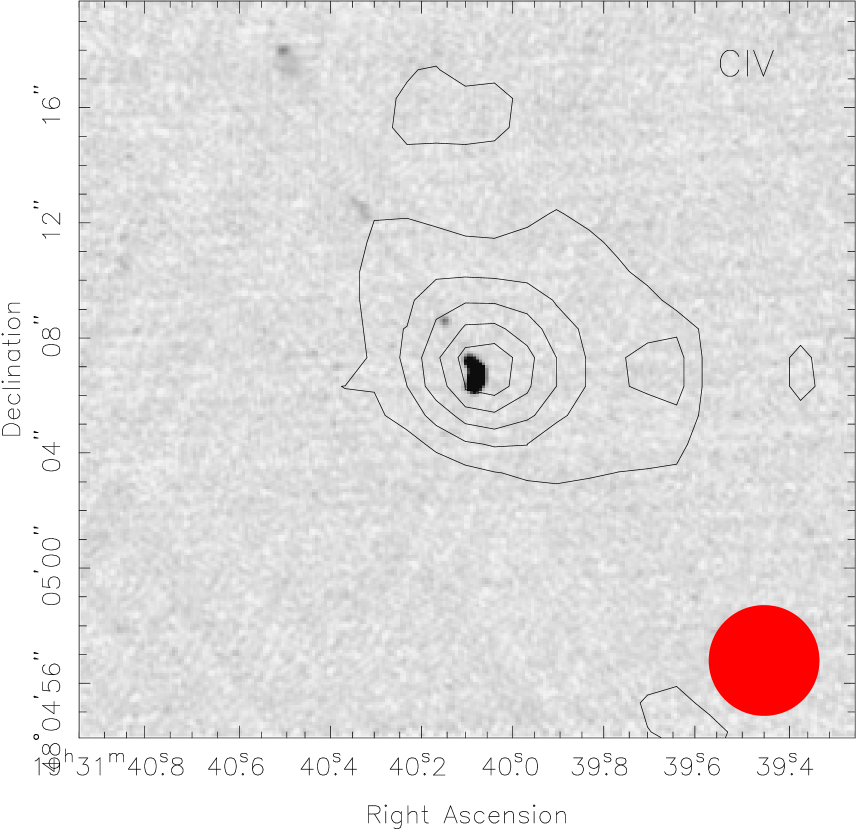
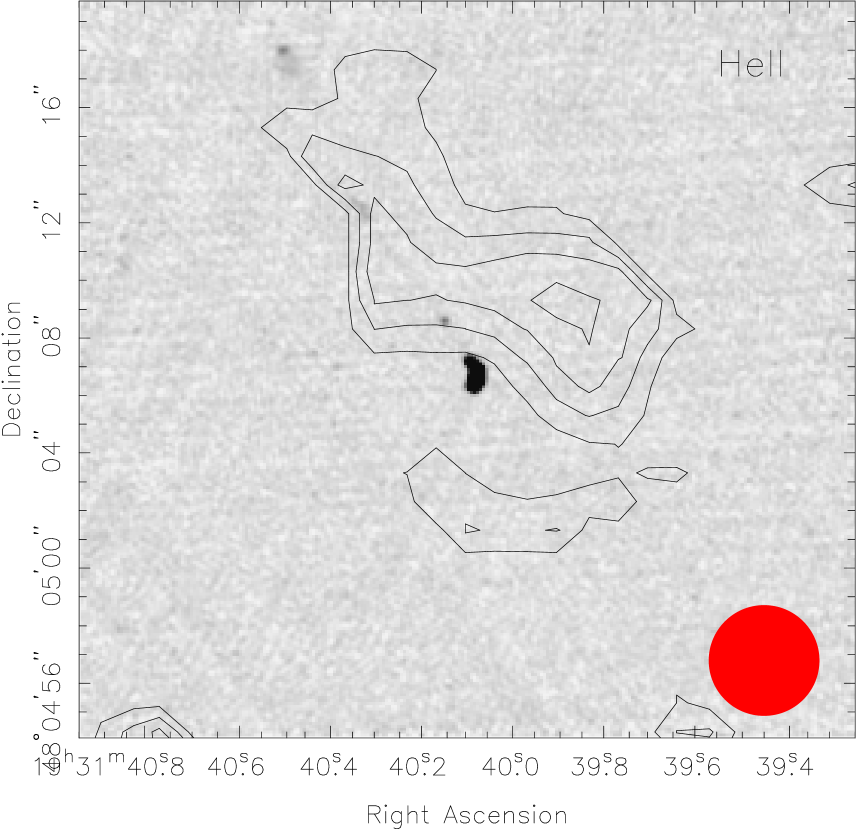
Once registered, the line emission maps can be compared with the emission in other wavelength ranges. Figure 2 shows, for each object, a counter-plot of the Ly, CIV and HeII emission map, together with a radio map at 5 GHz, obtained at the VLA with A configuration (Carilli et al. 1997). The remaining emission lines were not included in this comparison because they were not detected (NV in the case of 4C48.48) or not detected as spatially extended (CIII] for both objects, and NV in the case of 4C40.36). Note that the displayed images have been spatially interpolated to a regular grid using E3D, with a final sampling of 1/pix.
3.2 velocity, FWHM and line ratio maps
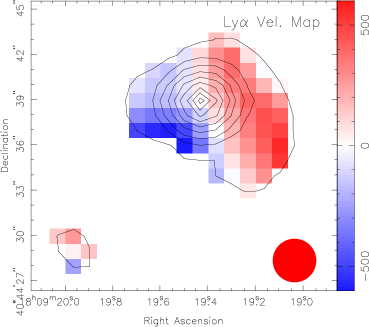
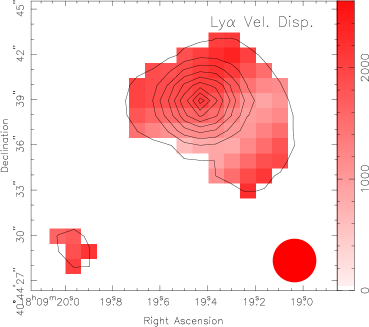
Since it is the brightest and most extended of the emission lines within the spectral range of our data, we used Ly as a means to extract information on the kinematics of the warm ionized gas associated with the two HzRGs. In each fibre where we detect Ly, the line was fitted with a single Gaussian function, plus a low order polynomial function to describe the continuum, using FIT3D (Sánchez et al. (2007)). The central wavelength, the FWHM, and the integrated intensity were free parameters in the fitting process. The V300 and V600 datasets were analysed separately due to their different spectral resolutions. All values of velocity dispersion were corrected for the instrumental profile as listed in Table 1. The results were then spatially interpolated using E3D to create regular gridded images, with a final sampling of 1/pix.
For both the velocity and velocity dispersion maps, we adopt the values at the position of the Ly flux peak as our fiducial zero point. As a final step, we co-averaged the V300 and V600 datasets for each of the two HzRGs. (We note that for each of the two objects, the V300 and V600 datasets are very similar.) The velocity and FWHM maps for 4C+40.36 and 4C+48.48 are shown in 4.
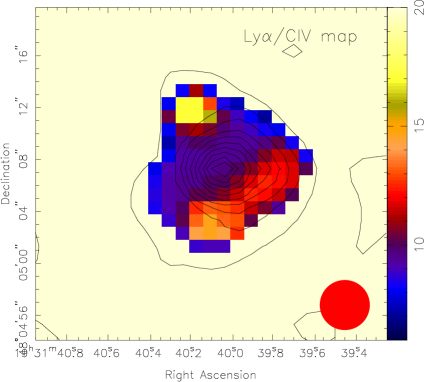
In the case of 4C+48.48, we produced Ly/CIV line ratio maps by simply dividing the interpolated Ly map by those of CIV, respectively. This ratio map is shown in figure 3. Other line ratios, such as Ly/HeII, CIV/HeII or CIV/CIII], have lower signal to noise in the spatially extended regions or are strongly affected by inaccuracies in the continuum subtraction, and hence they are not shown. In the case of 4C+40.36, the line ratio maps were rather noisy, and thus are also not shown here.
4 Results and discussion
4.1 The nuclear spectrum
Table 2 shows the results from fitting the emission lines in the fibre wherein the line emission is brightest, which we assume includes the nucleus of the galaxy. The kinematic properties derived from the emission in this fibre are generally consistent with those reported by Villar-Martín et al. (2003). Table 3 shows emission line ratios composed from the Ly, NV, CIV, HeII and CIII] lines in this fibre. For comparison, we also show the line ratios measured from Keck II long-slit spectra (Vernet et al. 2001; Humphrey 2005), for which the slit was aligned with the radio axis. Vernet et al. (2001) used relatively large extraction apertures of 4.7″ 1.0″and 6.2″ 1.0″for 4C+40.36 and 4C+48.48, respectively. Humphrey (2005), analysing the same spectra as Vernet et al. (2001), but used extraction apertures of 2.1″ 1.0″for both objects.
From Table 3, it can be seen that several of the line ratios differ significantly between the different apertures. In the case of 4C+40.36, the NV/HeII ratio in our central fibre (and in the 2.5″ 1.0″aperture of Humphrey 2005) is almost twice that measured in the larger aperture of Vernet et al. (2001). For 4C+48.48, the NV/HeII, CIV/HeII, CIV/CIII] and CIII]/HeII ratios are between 1.5-2.4 times lower in our central fibre (and also in the 2.5″ 1.0″aperture of Humphrey 2005) than in the relatively large aperture of Vernet et al. (2001). Comparing these differences against ionization models (e.g. Humphrey et al. 2008a), we consider that the two most plausible explanations are (a) a spatial gradient in gas metallicity, with higher metallicities closer to the nucleus, for 4C+40.36, or with the oposite trend, for 4C+48.48 (e.g. Overzier et al. 2001) or (b) a spatial gradient in the excitation level of the gas (e.g. Humphrey et al. 2007), with higher excitation nearer the nucleus. More emission lines, such as NIV] 1749 or the forbidden optical lines, would be needed to break the degeneracy between these two possibilities (e.g. Humphrey et al. 2008a). We can, however, conclude that within the extended nebulosities of both 4C+40.36 and 4C+48.48 the ionized gas have a significant range in physical conditions, as has been found for other HzRGs (e.g. Humphrey et al. 2007).
| Object | grating | Line Id. | Wavelength | Flux | FWHM | FWHM |
|---|---|---|---|---|---|---|
| ∗ | (Å) | ∗∗ | (Å)∗∗∗ | km s-1 | ||
| 4C40.36 | V300 | Ly | 3961.03 | 45.830.23 | 28.8 | 2179.7557.3 |
| NV | 4043.84 | 2.450.23 | 28.8 | 2135.1545.9 | ||
| CIV | 5052.75 | 6.580.20 | 35.6 | 2112.2540.1 | ||
| HeII | 5352.34 | 3.600.20 | 35.6 | 1994.0510.0 | ||
| CIII]1909 | 6222.77 | 3.460.20 | 16.0 | 770.8196.9 | ||
| V600 | Ly | 3967.39 | 62.110.85 | 27.0 | 2040.2228.3 | |
| NV | 4050.35 | 2.670.85 | 27.0 | 1998.4223.6 | ||
| CIV | 5056.13 | 9.450.33 | 21.4 | 1268.9142.0 | ||
| 4C48.48 | V300 | Ly | 4057.26 | 46.660.51 | 14.0 | 1034.5274.9 |
| Ly | 4058.39 | 37.470.42 | 18.4 | 1359.2361.1 | ||
| Ly | 4055.83 | 11.360.28 | 3.9 | 288.2 76.6 | ||
| CIV | 5170.31 | 5.160.12 | 15.6 | 904.5240.3 | ||
| CIV | 5172.25 | 4.130.11 | 15.0 | 869.4231.0 | ||
| CIV | 5165.23 | 1.000.08 | 3.5 | 203.1 54.0 | ||
| HeII | 5474.06 | 4.890.21 | 10.6 | 580.5154.2 | ||
| CIII]1909 | 6366.45 | 4.920.19 | 17.9 | 842.9224.0 | ||
| 4C48.48 | V600 | Ly | 4060.72 | 104.291.21 | 13.0 | 959.7 43.2 |
| Ly | 4063.55 | 51.310.99 | 16.0 | 1180.4 53.2 | ||
| Ly | 4059.41 | 52.600.78 | 9.5 | 701.6 31.6 | ||
| CIV | 5172.39 | 9.300.23 | 16.5 | 956.3 43.1 | ||
| CIV | 5175.85 | 6.160.21 | 16.5 | 955.7 43.1 | ||
| CIV | 5168.53 | 3.170.16 | 8.9 | 516.2 23.3 |
(*) indicate the broader components and the narrower one.
(**) 10-16 erg s-1 cm-2 arcsec-2.
(***) After removing the instrumental profile width.
| Object | dataset | Ly/HeII | Ly/CIV | Ly/NV | NV/HeII | CIV/HeII | CIV/CIII] | CIII]/HeII |
|---|---|---|---|---|---|---|---|---|
| 4C40.36 | V300 | 12.730.23 | 6.970.07 | 18.710.48 | 0.680.03 | 1.830.05 | 1.900.05 | 0.960.03 |
| V600 | 6.570.13 | 23.261.45 | ||||||
| V01∗ | 14.7 | 8.4 | 39.2 | 0.37 | 1.8 | 1.8 | 1.0 | |
| H05∗∗ | 11.6 | 7.1 | 19.3 | 0.6 | 1.6 | 2.2 | 0.7 | |
| 4C48.48 | V300 | 9.570.13 | 9.040.12 | 17.9 | 0.38 | 1.060.03 | 1.050.03 | 1.010.03 |
| Broader | 9.070.15 | |||||||
| Narrower | 11.360.75 | |||||||
| 4C48.48 | V600 | 11.210.21 | 65.2 | |||||
| Broader | 8.330.24 | |||||||
| Narrower | 16.590.88 | |||||||
| V01∗ | 13.2 | 12.6 | 48.3 | 0.27 | 1.0 | 1.7 | 0.6 | |
| H07∗∗ | 11.3 | 8.2 | 12.6 | 0.9 | 1.4 | 2.6 | 0.5 | |
∗ Vernet et al. (2001) ∗∗ Humphrey (2005).
4.2 Emission line morphologies
The Ly emission from 4C+40.36 has a large spatial extent, and is distributed across 12 10 (100 kpc 83 kpc: see figure 2). The CIV and HeII lines from this object are also spatially extended, and are aligned with the axis of the radio emission. As noted by previous investigators (e.g. Chambers et al. 1996b; Villar-Martín et al. 2003), the Ly, CIV and HeII emission extends far beyond the radio structure. Their derivation of the spatial extension of these emission lines was limited by the position and aperture of the slit in their observations. Allowing for the low spatial resolution of our data, the distributions of the lines are broadly consistent with being within a pair of diametrically opposed ‘ionization cones’ with an opening angle of , aligned with the radio axis. We have not obtained any clear detection of line emission in those regions that are outside any plausible ionization cone. From the spatially very extended Ly emitting regions to the East (A in Figure 2) and South-East (B) of the nucleus, we detect CIV and HeII, respectively. This shows that the gas in these regions is ionized, and is not merely a neutral Ly ‘mirror’ (e.g. Villar-Martín, Binette & Fosbury 1996). The most distant knot of Ly emission to the South-East of 4C+40.36 (C: at a radius of 70 kpc) is also detected in broad band images (Chambers et al. 1996b), and thus may be associated with a companion galaxy.
Interestingly, the HeII line is brighter on the Western side of 4C+40.36 than on the Eastern side, while the reverse is true for the CIV line. This might be due to a difference in the ionization properties or chemical abundances between the Western and Eastern emission line regions. However, we are unable to discriminate between these two possible explanations, because the CIV/HeII ratio is sensitive both to the ionization properties and the chemical abundance of the ionized gas (e.g. Vernet et al. 2001).
In the case of 4C+48.48, the Ly emission is also very spatially extended, and is detected across 14 16 (116 kpc 133 kpc). Its spatial extent parallel to the axis of the radio source is similar to the extent measured from the slit spectrum of Villar-Martín et al. (2003).
The Ly, CIV and HeII emission lines from 4C+48.48 show a striking morphology. They extend several arcseconds towards the North-East, in close alignment with the radio source. However, on the other side of the nucleus, this alignment with the radio source is not present: While the South-Western radio source undergoes a dramatic 45 deg bend to the South, the line emission extends 5″(40 kpc) from the nucleus towards the West. In this object, we note that the CIV and HeII lines have very similar spatial distributions to that of Ly. This shows that the giant nebula is ionized. Moreover, the presence of HeII emission rules out ionization by young stars, but is consistent with photoionization by the obscured AGN (e.g. Vernet et al. 2001). We note here that the two-dimesional extensions of the CIV and HeII emission lines have been reported for the first time in the current study.
4.3 Ly/CIV map of 4C+48.48
Figure 3 shows the spatial distribution of the Ly/CIV line ratio. Since the HeII image is affected by the presence of the nearby field star, we do not show a Ly/HeII map. Previous investigations using long-slit spectroscopy (Humphrey et al. 2007) revealed that line ratios involving Ly vary significantly along the radio axis. Our Ly/CIV map confirms their result and, moreover, shows that this ratio also varies substantially in two spatial dimensions.
The line ratio map reveals a band of relatively low Ly/CIV, running perpendicular to the radio axis, and passing through the position of maximum Ly flux. In this band, we measure Ly/CIV ratios as low as 8, whereas standard photoionization models predict Ly/CIV 10 (e.g. Villar-Martín et al. 2007). Thus, we consider these relatively low observed values of Ly/CIV to be the result of absorption of Ly, presumably by neutral Hydrogen or interstellar dust. We suggest that this band of Ly absorption might be the observational signature of an edge-on disc of gas and dust associated with the radio galaxy host (e.g. Gopal-Krishna & Wiita 2000).
To the South-West and North-East of the low Ly/CIV band, we measure Ly/CIV ratios of 11-15, which are consistent with the values predicted by standard photoionization models (e.g. Villar-Martín et al. 2007).
4.4 Emission line kinematics
Figure 4 (top-left panel) shows a colour coded image of the Ly velocity map for 4C+40.36, together with a contour plot of the intensity of this line. Since we do not detect any stellar absorption lines from which to determine the systemic velocity, we have simply adopted the velocity at the position of the Lya emission peak as our fiducial zero point. It is important to recognise that this velocity may not necessarily correspond to the true systemic velicity, as discussed by Humphrey et al. (2008)
This velocity map shows a somewhat regular pattern, with a clear gradient from East to West. The maximum velocity amplitude is 1000 km/s, with the gas to the East approaching and the gas to the West receding, relative to the fiducial velocity zero-point. This is consistent with the velocity curves obtained by Villar-Martín et al. (2003) using a 1″slit along the radio axis. The region of null velocity runs from North-East to South-West, i.e., at an angle of 45∘ relative to the axis of the radio and line emission (see Fig.3).
The relatively ordered nature of the velocity map suggests that the kinematics of the ionized gas are dominated by ordered motion, i.e., infall, outflow or rotation. Superficially, the map is consistent with each of these three possibilities, and we are unable to definitively distinguish between them. However, we argue that since the FWHM and velocity amplitude are both roughly twice what one would expect for gravitational motion around a giant elliptical galaxy (e.g. Villar-Martín et al. 2002), at least part of the Ly nebula associated with 4C+40.36 has been kinematically perturbed, presumably by the radio source, as suggested by Villar-Martín et al. (2003). Moreover, we note that the average FWHM would seem rather large relative to the velocity amplitude (/v1) for a stable rotating system, even without correcting for inclination. In addition, we do not observe the broadening of the FWHM at the null velocity that would be expected in the case of rotation.
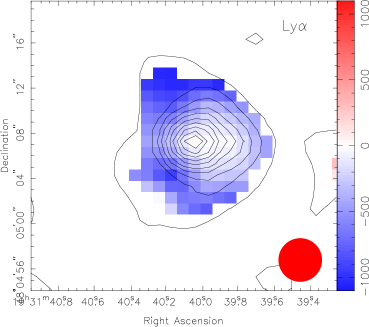
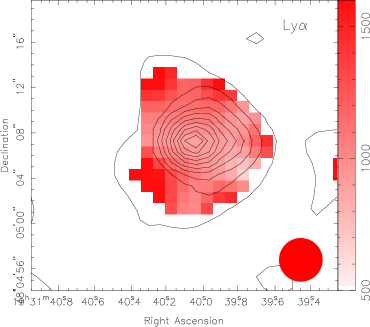
The lower left panel of Fig. 4 shows the colour-coded representation of the Ly velocity map of 4C+48.48. As before, we define our fiducial zero as the velocity at the peak of the Ly emission. The FWHM shows little spatial variation, with a typical value of 1000 km s-1, and with slightly higher values in the outer regions. As we also noted for 4C+40.36, we find that the kinematics of 4C+48.48 are inconsistent with stable rotation: the FWHM is rather high compared to the amplitude of the velocity shifts, and there is no clear broadening of the FWHM near the galaxy nucleus or the null velicity. Taken at face value, this velocity map is consistent with either infall or outflow.
5 Summary
In this paper we have presented integral field spectroscopic data-cubes for two HzRGs, namely 4C+40.36 and 4C+48.48; this study is part of a wider programme in which we use this technique (Villar-Martín et al. 2006; Villar-Martín et al. 2007) to obtain information relating to the nature of the spatially extended gas associated with HzRGs, and their possible connection with the nuclear and radio-jet acivity.
Although both objects have been observed before using slit-spectroscopy, at the same wavelength range, we present for the first time IFS data on them. This techinique allows to study the spatial extension of the emission in the direction perpendicular to the radio-jet axis, what in many cases long-slit spectroscopy systematically miss.
For both sources, the Ly emission is extended across 100 kpc or more, in agreement with previous imaging and spectroscopic studies (Chambers et al. 1996b; Villar-Martín et al. 2003). The CIV and HeII emission lines are also spatially extended. While these emission lines are generally aligned with the axis of the radio emission, we also detect emission far from this axis.
Our map of the Ly/CIV ratio in 4C+48.48 has revealed a band of low Ly/CIV running perpendicular to the radio axis, through the assumed position of the active nucleus. We suggest that this feature might be the observational signature of an edge-on disc of neutral gas (e.g. Gopal-Krishna & Wiita 2000).
We have argued that when viewed in two spatial dimensions, the kinematic properties of both 4C+40.36 and 4C+48.48 are inconsistent with stable rotation. However, their properties are not inconsistent with infall (e.g. Humphrey et al. 2007) or outflows (Nesvadba et al. 2006).
Acknowledgements.
SFS thanks the Spanish Plan Nacional de Astronomía program AYA2005-09413-C02-02, of the Spanish Ministery of Education and Science and the Plan Andaluz de Investigación of Junta de Andalucía as research group FQM322. We thank M. Villar-Martin for her fundamental contribution to this project. We thank the referee, Dr. L.Binette, who has indicate valuable changes to increase the quality of the article.References
- Baum et al. (1990) Baum, S. A., Heckman, T., & van Breugel, W. 1990, ApJS, 74, 389
- Best (2007) Best, P. N. 2007, New Astronomy Review, 51, 168
- Carilli et al. (1997) Carilli, C. L., Roettgering, H. J. A., van Ojik, R., Miley, G. K., & van Breugel, W. J. M. 1997, ApJS, 109, 1
- Carson et al. (2001) Carson, J. E., et al. 2001, ApJ, 563, 63
- Chambers et al. (1996) Chambers, K. C., Miley, G. K., van Breugel, W. J. M., Bremer, M. A. R., Huang, J.-S., & Trentham, N. A. 1996, ApJS, 106, 247
- Christensen et al. (2006) Christensen, L., Jahnke, K., Wisotzki, L., & Sánchez, S. F. 2006, A&A, 459, 717
- Di Matteo et al. (2005) Di Matteo, T., Springel, V., & Hernquist, L. 2005, Nature, 433, 604
- Eales et al. (1993) Eales, S. A., Rawlings, S., Dickinson, M., Spinrad, H., Hill, G. J., & Lacy, M. 1993, ApJ, 409, 578
- Egami et al. (2003) Egami, E., Armus, L., Neugebauer, G., Murphy, T. W., Jr., Soifer, B. T., Matthews, K., & Evans, A. S. 2003, AJ, 125, 1038
- García-Lorenzo et al. (2005) García-Lorenzo, B., Sánchez, S. F., Mediavilla, E., González-Serrano, J. I., & Christensen, L. 2005, ApJ, 621, 146
- Humphrey et al. (2006) Humphrey, A., Villar-Martín, M., Fosbury, R., Vernet, J., & di Serego Alighieri, S. 2006, MNRAS, 369, 1103
- Humphrey (2005) Humphrey, A., 2005, PhD Thesis
- Humphrey et al. (2007) Humphrey, A., Villar-Martín, M., Fosbury, R., Binette, L., Vernet, J., De Breuck, C., & di Serego Alighieri, S. 2007, MNRAS, 375, 705
- Humphrey et al. (2008) Humphrey, A., et al. 2008, arXiv:0809.1267
- Husemann et al. (2008) Husemann, B., Wisotzki, L., Sánchez, S. F., & Jahnke, K. 2008, A&A, 488, 145
- Kang et al. (2007) Kang, X., van den Bosch, F. C., & Pasquali, A. 2007, ArXiv e-prints, 704, arXiv:0704.0932
- Kelz et al. (2006) Kelz, A., Verheijen, M.A.W., Roth, M.M. et al., 2006, PASP, 118, 129
- Kurk et al. (2002) Kurk, J. D., Pentericci, L., Röttgering, H. J. A., & Miley, G. K. 2002, Revista Mexicana de Astronomia y Astrofisica Conference Series, 13, 191
- Maxfield et al. (2002) Maxfield, L., Spinrad, H., Stern, D., Dey, A., & Dickinson, M. 2002, AJ, 123, 2321
- (20) McCarthy, P. J., Spinrad, H., Dickinson, M., van Breugel, W., Liebert, J., Djorgovski, S., & Eisenhardt, P. 1990, ApJ, 365, 487
- McCarthy (1993) McCarthy, P. J. 1993, ARA&A, 31, 639
- McCarthy et al. (1995) McCarthy, P. J., Spinrad, H., & van Breugel, W. 1995, ApJS, 99, 27
- Reuland et al. (2003) Reuland, M., et al. 2003, ApJ, 592, 755
- Roth et al. (2005) Roth, M.M., Kelz, A., Fechner, T., et al., 2005, PASP, 117, 620
- Sánchez (2004) Sánchez, S. F. 2004, AN, 325, 167
- Sánchez (2006) Sánchez, S. F. 2006, AN, 327, 850
- Sánchez et al. (2007) Sánchez S.F., García-Lorenzo, B., Pecontal-Rousset, A., 2007, Proceedings of the XIII IAC Winter School, Arribas, S., Mediavilla, E., & Roth, M., Ed., in press.
- Tadhunter et al. (1989) Tadhunter, C. N., Fosbury, R. A. E., & Quinn, P. J. 1989, MNRAS, 240, 225
- Tody (1993) Tody, D. 1993, ”IRAF in the Nineties” in Astronomical Data Analysis Software and Systems II, A.S.P. Conference Ser., Vol 52, eds. R.J. Hanisch, R.J.V. Brissenden, & J. Barnes, 173.
- van Ojik et al. (1997) van Ojik, R., Roettgering, H. J. A., Miley, G. K., & Hunstead, R. W. 1997, A&A, 317, 358
- Veilleux et al. (2005) Veilleux, S., Cecil, G., & Bland-Hawthorn, J. 2005, ARA&A, 43, 769
- Verheijen et al. (2004) Verheijen, M. A. W., Bershady, M. A., Andersen, D. R., Swaters, R. A., Westfall, K., Kelz, A., & Roth, M. M. 2004, AN, 325, 151
- Vernet et al. (2001) Vernet, J., Fosbury, R. A. E., Villar-Martín, M., Cohen, M. H., Cimatti, A., di Serego Alighieri, S., & Goodrich, R. W. 2001, A&A, 366, 7
- Villar-Martín et al. (2000) Villar-Martín, M., Alonso-Herrero, A., di Serego Alighieri, S., & Vernet, J. 2000, A&AS, 147, 291
- Villar-Martín et al. (2003) Villar-Martín, M., Vernet, J., di Serego Alighieri, S., Fosbury, R., Humphrey, A., & Pentericci, L. 2003, MNRAS, 346, 273
- Villar-Martín et al. (2006) Villar-Martín, M., et al. 2006, MNRAS, 366, L1
- Villar-Martín et al. (2007) Villar-Martín, M., Humphrey, A., De Breuck, C., Fosbury, R., Binette, L., & Vernet, J. 2007, MNRAS, 375, 1299
- Villar-Martín et al. (2008) Villar-Martín, M., Sánchez, S. F., Humphrey, A., Dijkstra, M., di Serego Alighieri, S., De Breuck, C., & González Delgado, R. 2007, MNRAS, 378, 416