Plasma diagnostics using digital holographic interferometry
Abstract
The advances in Charge Coupled Devices in one hand and the high resolution measurements of holographic technique on the other hand, we have adopted the method of digital real-time holographic interferometry for the diagnostics of high density plasma. The measured values of plasma electron density agree with the measurements from other techniques.
In recent years, digital holographic interferometry and shadowgraphy are emerging as a versatile tool for non destructive testing and diagnostics purposes in materials engineering recent . Similar techniques are also adopted for diagnosing plasma and to measure various plasma parameters using pulsed lasers. However a plasma diagnostics method that can reliably and rapidly measure fluctuations with both spatial and time resolution can lead to increased understanding and eventual control of turbulent transport. Additionally, reliable diagnostics that measure the plasma profiles are critical to moving towards an actual prototype magnetic fusion reactor. Conventional methods for plasma diagnostics include paul Langmuir probe Dude , microwave, laser interferometry Weber and Thompson scattering Weber ; Game , Out of these, laser interferometry has the advantage as it is versatile and gives accurate results. Since the advent of optical lasers, interferometry has been widely used to study different types of plasmas LPP . We have made an attempt to successfully adopt the digital holographic interferometry for plasma diagnostics. To authors knowledge, this is the first time digital holographic interferometry is employed for plasma discharge tubes in real-time. This open up the way for the diagnosis of arc plasma, DC discharge plasma, etc. The advantages of this technique over other conventional spectroscopic methods are its high resolution measurements of the order of few tens of nanometer, real-time measurements and cost effectiveness. Further this methods could give realistic parameters of plasma like electron density and electron temperature recent .
The present technique provides information in the form of two-dimensional maps of the electron density, without the need of extensive modeling. In a laser interferometry various types of interferometer can be used such as Michelson interferometer, Mach-Zhender interferometer (MZI) etc. We employed a Mach-Zhender interferometer. Chord integrated phase information is utilized to obtain the radial profile of electron density by using Abel inversion technique with appropriate software code written using MathCAD and LabVIEW.
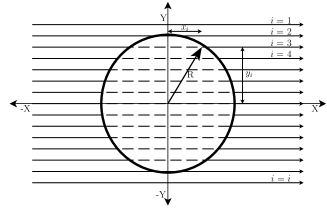
We adopt the fact that the geometrical and optical lengths traveled by light through plasma are different, since the refractive index of plasma is proportional to the density of free electrons. When a laser beam passes through a cylindrical tube containing circular symmetric plasma density ), the light suffers a change in optical path length. Light passing through different chords of the tube as shown in Fig. 1, are phase shifted by different amount. The change in phase is estimated from book ; Lisi
| (1) | |||||
where is the horizontal distance of th chord from origin, , , , , and are the wavelength of laser light, charge of an electron, change in electron plasma density at th chord, speed of light, mass of electron and absolute permittivity, respectively. Free electrons produce negative phase shift because the effective index of refraction is less than 1. Hence, the change in refractive index will be less than 1, but positive.
The experimental setup is shown in Fig. 1. A 30 mW polarized He-Ne laser (Melles Griot) having central wavelength at 632.8 nm passes through a spatial filter assembly and a beam expander (BE). A cylindrical lens is used to convert the circular symmetric beam into a line beam. The line helps us to measure the optical properties along a single cross section of the plasma tube only. Also, the plasma tube, if mounted on a linear stage may be useful to scan the plasma tube completely. The expanded beam is divided using a 50:50 non-polarizing cubic beam splitter (BS1). A part of the beam is allowed to incident on a plane mirror (hereafter, we call it reference beam) while the other part is reflected by another mirror (object beam). In this experimental setup,
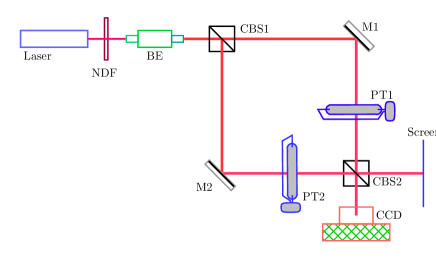
we have used high pressure mercury lamps (Phillips) as a plasma source. Two identical lamps are used in both the arms of the Mach-Zhender setup. One lamp acts as a compensator while the other lamp is connected to power source. Both the beams interfere inside a non-polarizing cubic beam splitter (BS2). Interference fringes are monitored using a charge coupled device (CCD) (Apogee, Model- LISAA-M). A large area convex lens assembly (Pentax) is used to collect the beam into the CCD. The whole system is mounted on a vibration isolation table (Melles Griot). Interference fringes are viewed from one arm of BS2 using a screen. In the absence of any plasma, the interference fringes (or chord integrated intensity) recorded in the CCD can be expressed as Born
| (2) |
Here, and are the intensity of the laser in the two arms of the interferometer while is the phase difference between the two beams. Since, the two beams are passing through a path which is identical but intentionally at a small angle so as to obtain straight line fringes. In the presence of plasma eq. (2), may be rewritten as
| (3) |
Simulated results obtained using eq. (3) and experimental observation of chord integrated intensity are shown as contour plots in Figs. 3a and 3b, respectively. Due to the limitation of the experimental setup we could obtain only a partial image from the CCD. A typical interference signal obtained using CCD is shown as Fig. 3c. The fringes continuously obtained with time are displayed in Fig. 3b. While obtaining the simulated results, the values of constants are obtained from the present experimental conditions. The experimental data is obtained from CCD, while the simulated results are generated from a software code written using LabVIEW. For times to 50 sec no current is applied to PT1. Since no temporal change in phase is occurring, the fringe pattern remains almost same as evident from Figs. 3a and 3b. At sec, constant current is applied to the plasma source. In the presence of plasma the interference pattern are modulated
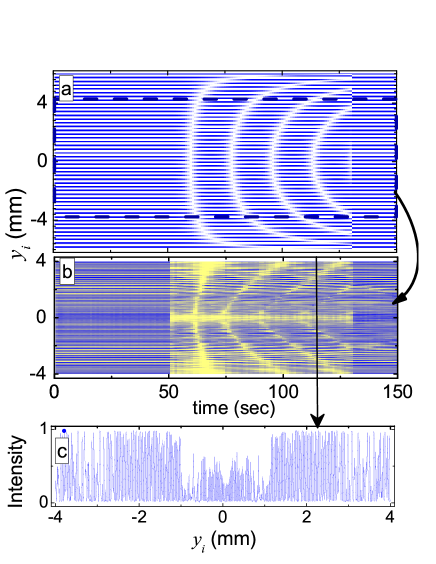
with time. The number of fringes increases due to large change in plasma density, but saturates after the build-up (rising) time of plasma. The unknown parameter for different chords is obtained after performing many iterations of the simulated results for minimum standard deviation. Best profile of which matches gives minimum standard deviation with the experimental profile is used for calculation.
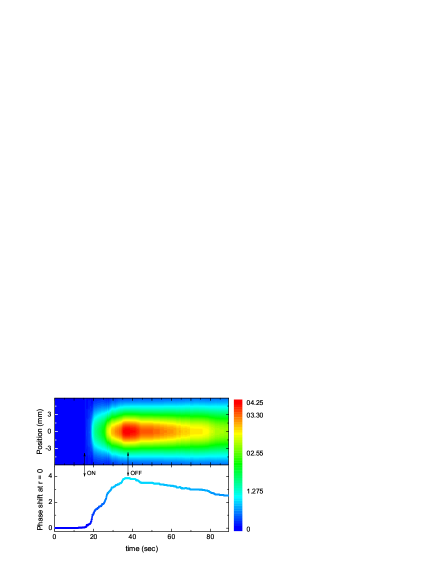
The measurement of phase change indirectly gives the magnitude of electron density. Figure 4, shows the temporal change in plasma density. When the plasma tube is switched ON, the electron density raises rapidly and saturates. However, it cools slowly after switching it OFF.
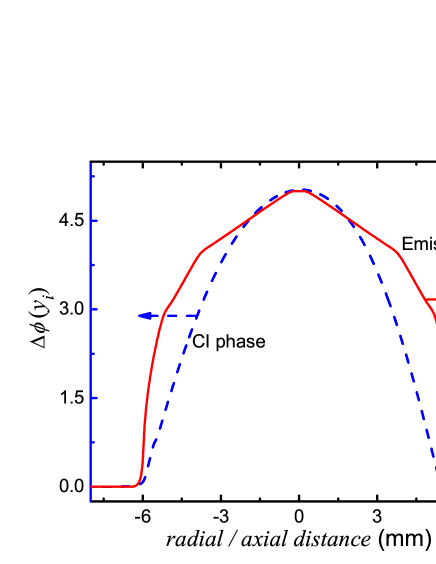
The chord integrated phase changes with respect to axial distance () are converted radial distance by using Abel inversion method and are shown in Figure 5. The axis on the left shows the numerical values of phase change while the axis on the right side is the estimated values of change in electron density after Abel inversion. These values agree with the recent observations using spectroscopic method Nima .
To conclude, we used the method of holographic interferometry to estimate the plasma electron density. The measured value agrees with the standard values of high pressure mercury plasma density. The present work has the potential of measuring, imaging the plasma density variations in real-time. This method can also be used for obtaining the 3D profile of electron density in a DC plasma.
Acknowledgements.
The authors thankfully acknowledge the financial support received from DST & AICTE, New Delhi. The authors also thank Professors P. K. Sen and P. K. Barhai for Discussions.References
- (1) A. Wada, M. Kato and Y. Ishii, Applied Optics, 47, 2053 (2008); Md. M. Hossiasn, D. S. Mehta and C. Shakher, Optics and Lasers in Engg. 40 120 (2008); R. Kumar, S. K. Kaura, D. P. Chhachhia, D. Mohan and A. K. Aggarwal, Current Science, 94, 184 (2008). J. Soria and C. Atkinson, Meas. Sci. Technol. 19, 074002 (2008).
- (2) R. K. Paul, J. T. Andrews, K. Bose and P. K. Barhai, Plasma Devices and Operations, (2005); G. Toker and N. Korneevb, Optik - International Journal for Light and Electron Optics, 119, 112 (2008).
- (3) M. Dudeck, G. Poissant, B. R. Rowe, J. L. Queffelec and M. Morlais, J. Phys. D: Appl. Phys., 16 995 (1983).
- (4) B. V. Weber, S. F. Fulghum, Rev. Sci. Instrum., 68, 1227 (1997);
- (5) G. Gamez, A. Bogaerts and G. M. Hieftje, J. Anal. At. Spectrom., 21, 350 (2006).
- (6) F. Charri re, et al, Appl. Opt., 45, 829 (2006).
- (7) M. Ali. Kettani and Max F. Hoyaux, Plasma Engineering (Butterworth:London, 1973).
- (8) I. V. Lisitsyn, S. Kohno, S. Katsuki and H. Akiyama, Rev. Sc. Instrum., 69, 1584 (1998).
- (9) M. Born and E. Wolf, Principles Optics: 6th edition (Pergoman, Oxford 1986), pp. 312-14.
- (10) T. Nimalasuriya, A. J. Flikweert, W. W. Stoffels, M. Haverlag, J. J. A. M. van der Mullen, and N. B. M. Pupat, J. Appl. Phys., 99, 053302 (2006).