Density-dependence of functional development in spiking cortical networks grown in vitro
Abstract
During development, the mammalian brain differentiates into specialized regions with distinct functional abilities. While many factors contribute to functional specialization, we explore the effect of neuronal density on the development of neuronal interactions in vitro. Two types of cortical networks, dense and sparse, with and total cells respectively, are studied. Activation graphs that represent pairwise neuronal interactions are constructed using a competitive first response model. These graphs reveal that, during development in vitro, dense networks form activation connections earlier than sparse networks. Link entropy analysis of dense network activation graphs suggests that the majority of connections between electrodes are reciprocal in nature. Information theoretic measures reveal that early functional information interactions (among 3 cells) are synergetic in both dense and sparse networks. However, during later stages of development, previously synergetic relationships become primarily redundant in dense, but not in sparse networks. Large link entropy values in the activation graph are related to the domination of redundant ensembles in late stages of development in dense networks. Results demonstrate differences between dense and sparse networks in terms of informational groups, pairwise relationships, and activation graphs. These differences suggest that variations in cell density may result in different functional specialization of nervous system tissue in vivo.
I Introduction
The mammalian brain is a remarkable structure composed of many specialized regions and types of cells. Despite organizational differences in neural tissue, the basic functional units of the nervous system, neurons, are generally similar across tissues, as are methods of forming and modifying synaptic connections between them (e.g. spike-timing dependent plasticity markram_1997 , bi_1998 ). Thus, functional specialization of brain regions is a function of neuron specialization, (e.g. excitatory or inhibitory), ratios of neurons to neuroglia, synaptic density, learning, and many other factors that are not yet well understood.
Though the functional role of neurons in different types of tissues can be similar, neuronal density can vary dramatically. For example, neuronal density in human fascia dentata is neurons/mm3 kim_1990 while cortical tissue density is neurons/mm3 anderson_1996 , nearly an order of magnitude difference.
A previous study of network development in vitro demonstrated that network bursting (when a large majority of neurons fire in a coordinated pattern) and spiking patterns are affected by neuronal density wagenaar_2006 . Since spike and burst activity are observable results of neuronal interaction (functional connectivity) they can be used to infer neuronal relationships pfister_2006 , bcourt_2007 , tang_2008 , bettencourt_2008 .
In this work the effect of density on functional units is explored using dissociated cortical tissue developing in vitro on microelectrode arrays. These are well established models of neuronal interaction paninski_2003 , beggs_2004 , feinerman_2007 , though obvious constraints and limitations must be considered when attempting to extrapolate between in vitro and in vivo structures corner_2002 , marom_2002 . To gain new insight into functional connectivity in developing networks, we analyze the coordinated electrophysiological activity of groups of two and three spike trains, each representing an integration of all of the action potentials recorded at a single electrode. Each electrode may capture the activity of a single neuron, or less frequently, incorporate signals from several cells.
Activation between pairs of electrodes is inferred using a competitive first response model, whereby directional links are derived from spike train data. These pairwise links estimate the probability that activity at one electrode causes activity at another. The set of all such links forms a network activation graph where vertices represent recording electrodes and weighted edges represent a dependent activation probability. We use entropy based link analysis (link entropy) to characterize connectivity between electrodes. Information theoretic measures applied to ensembles of electrodes reveal functional information structures. Such structures are characterized using an information overlap method that reveals whether interactions are synergetic (more information is obtained from the measurement of two electrodes together conditioned on the third compared to measuring them separately), redundant (less information is obtained from the measurement of two electrodes together conditioned on the third compared to measuring them separately) or independent. Results show that functional structures in networks are strongly influenced by neuronal density and suggest that varying cell density is a potential strategy for differentiating tissue functionality.
II Methods
We analyze developmental activity patterns in eight cultured cortical networks growing on microelectrode arrays. Networks were recorded wagenaar_2006 on days ranging from to days in vitro (DIV, days after plating). Half the networks studied are sparsely seeded ( cells/ml) the other half densely seeded ( cells/ml).
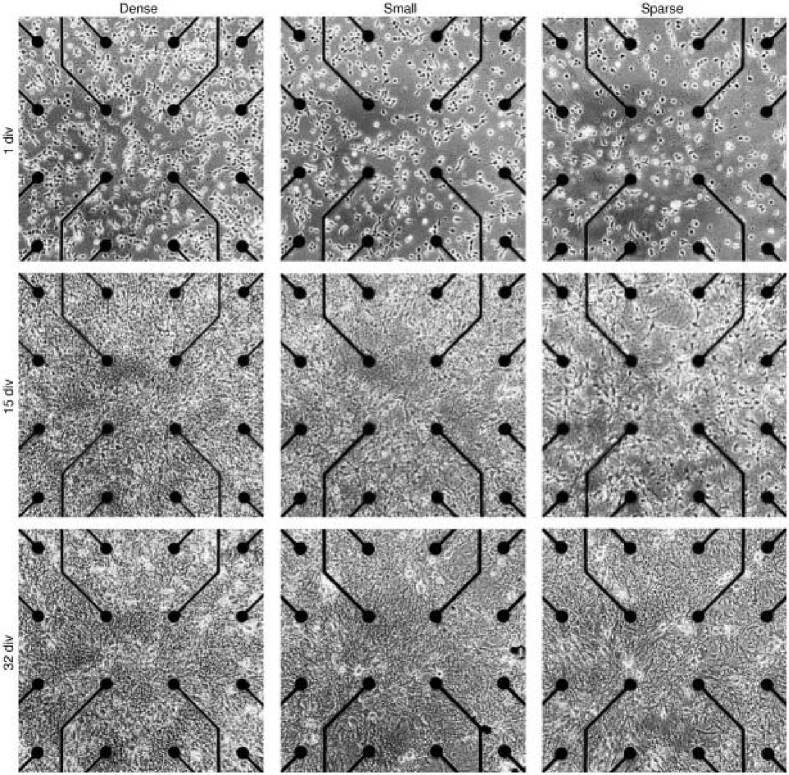
Cells (neurons and support glia) are removed from embryonic mice and their existing tissue structure is dissociated mechanically and enzymatically. After cells are seeded on a microelectrode array, they form new connections and self-organize into spontaneously active networks grossbook_1994 , maeda_1995 . Figure 1 depicts a representative dense and sparse network at , and DIV. Experiments and data collection were performed by Wagenaar et al. wagenaar_2006 and made publicly available for analysis. Detailed information about culturing, plating, and feeding techniques are provided in this reference.
II.1 First response model
We build a model of network connectivity using spike timing correlations to study the evolution of pairwise neural interactions during development. The model is based on the assumption that, within a small network, all activity preceding a spike within a biologically plausible time window contributes to its firing. Any given spike is assumed to be correlated with the ignition of the next spike to fire within ms. This temporal window is selected such that the first spike has enough time to influence the production of the second, but not so long that its effect will have faded nakanishi_1998 , bi_1998 . All spikes collected at a single electrode form a single spike train. Therefore, the number of spike trains is equal to the number of active channels (Table 1) and functional connections discussed here are made between electrodes.
| Network | Electrodes | Recording days |
|---|---|---|
| D1 | 56 | 4-7,9-26,28,31-35 |
| D2 | 56 | 4-26,28,31-35 |
| D3 | 56 | 4-26,28,31-35 |
| D4 | 56 | 4-26,28,31-35 |
| S1 | 58 | 4-7,10,11,13,14,17,19,21,22,24-26,28,31,33,34 |
| S2 | 58 | 4-7,10,11,13,14,17,19,21,22,24-26,28,31,33,34 |
| S3 | 58 | 4-7,10,11,13,14,17,19,21,22,24-26,28,31,33,34 |
| S4 | 58 | 4-8,10,12-14,17,18,20,21,31-35 |
Recent analysis of similar recordings in which individual neurons at an electrode were discriminated (spike sorted) shows that, for plating densities comparable to those in the data presented here, typically no more than 2 neurons are observed at any given electrode ham_2008 .
The first response model provides a method for estimating whether a spike produced at one electrode initiates a spike at another. Each time a spike at an electrode is the first to fire within ms after a spike at another electrode (Fig. 2a), the link (edge) from the first to the second is incrementally increased. This results in a weighted and directed edge between electrodes (Fig. 2b).
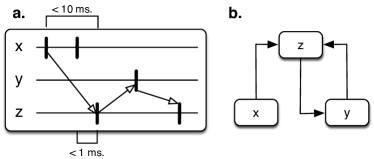
Edge weights are calculated for all electrode pairs. Edges represent inferred activation links in the network and are not necessarily representative of actual synaptic connection between neurons recorded at any two electrodes. Edges are denoted by , where is the first electrode to fire and the second. When pairwise edges are studied individually, they are normalized by the lesser of the total spikes recorded at or , giving an estimate of the probability that leads . Normalized frequency edges and are denoted and respectively.
II.2 Activation graph
The combination of all weighted directed edges between electrodes forms an activation graph, which is a weighted directed graph, with each edge normalized between zero and unity. This graph estimates the activation probability between all electrodes. New activation graphs are created for each network on each recording day.
II.3 Information ensembles of order 2
Neuronal activation along pathways in the brain is generally a sequential process. Activity in one area can ignite activity in another on large scales (tissue structure, e.g. spitsyna_2006 ) as well as small scales (neuronal networks, e.g. ham_2008 ). To characterize the influence a target electrode has on all other electrodes, we apply a link entropy analysis of the activation graphs. Link entropy is calculated for each electrode and measures the uncertainty of which electrodes will be activated by the target electrode. For example, in Fig. 2b, electrode activates only . Since there is no uncertainty about which electrode activates, the link entropy is . If activated more than one other electrode, uncertainty in activation and link entropy increase. In a fully connected network with electrodes, there are potential pathways (edges) originating from each electrode. Edges () originating from a target electrode () in the weighted directed activation graph are used to estimate the probability :
| (1) |
The link entropy of the target electrode () in an activation graph with N active electrodes is:
| (2) |
This measure represents the uncertainty (in bits) of the potential activation paths originating from a target electrode. Link entropy values range from (no uncertainty; activation flows along only one path with probability of ) to a maximal value of . The latter occurs only when (non-zero) probabilistic connections between the target and all other electrodes in the network are equal.
II.4 Informational ensembles of order
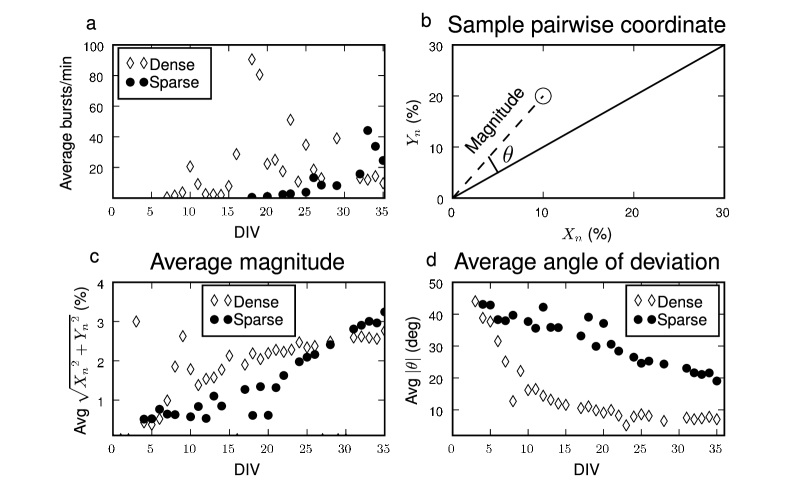
Information theoretic measures applied to ensembles of electrodes are used to estimate functional relationships, beyond simple directed connectivity, in developing networks. At this point, probabilities are no longer based on activation graph links between electrodes. Rather, each electrode can assume two states – spiking or not spiking. In the convention established in Reike et al. reike_1997 , see also bcourt_2007 , information theoretic quantities are measured only during network bursts, where the vast majority of all coordinated interactions occur. More details about network burst detection are given in ham_2008 . The average number of detected network bursts per minute across all dense and sparse networks on all recorded DIV is shown in Fig. 4a. Bursts are digitized by dividing time into ms bins. If activity occurs during a bin, the bin is assigned a . Otherwise the bin is assigned a . Probabilities are computed by normalizing the number of spiking and not spiking bins by the total number of bins. Joint probabilities can also be computed in the same way for multiple electrodes.
After digitization, all groups of spike train triplets are examined for redundant or synergetic relationships per the convention established in bcourt_2007 , schneidman_2003 . Specifically, for three electrodes , we consider the conditional mutual information between and the state of two other electrodes and (cover_1991 ):
| (3) |
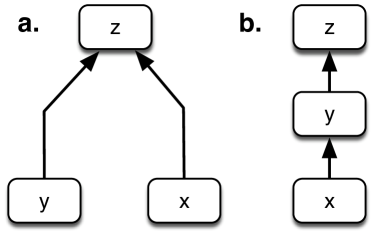
Subtracting this quantity from the sum of and reveals the informational nature of the ensemble cover_1991 . For example, in a synergetic ensemble (see Fig. 3a), more information is gained when considering and together rather than separately: . However, in a redundant ensemble (see Fig. 3b), less information is gained when considering and together rather than separately: . If and are independent, . Therefore, we can use the measure to characterize the functional informational nature of an ensemble. can be positive (redundant), negative (synergetic) or zero (independent).
To test for statistical significance, experimentally obtained values were compared to values obtained from a Poisson null model with the same spiking rates as in the experiment bcourt_2007 . In this model, experimentally obtained spike trains are used to form a randomly distributed Poisson spike train for each electrode. This eliminates all correlations between spike trains, so that non zero values of are the result of finite sampling. The Poisson spike train contains the same number of spikes as the experimentally observed spike train. In practice, values obtained from this model are very small since coincidences are minimal between random Poisson spike trains. The Poisson model establishes a background noise level below which values were considered to be effectively 0. This null model was used to establish the background noise level below which values were considered to be effectively 0. The mean Poisson values over 10 instances of the model were on the order while typical values from the experimental data ranged between and .
II.5 Results
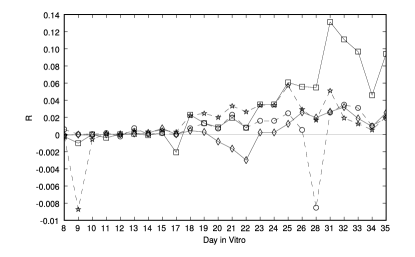
We analyze eight developing networks, four dense ( cells/mm2) and four sparse ( cells/mm2). For each network on each recording day (1), new activation graphs are generated by the competitive first response model (see Methods) and directional activation links between pairs are established. Thus, pairs can be represented by the coordinate , where is the estimated probability that electrode activates and is the estimated probability activates (Fig 4b). If =, the point falls on the line (solid line, Fig. 4b). Each coordinate has a magnitude (distance from zero) and a deviation angle from the line . If = , then the deviation angle = and the magnitude = . In figures 4c & 4d we examine the magnitude and deviation of all non-zero ( & ) coordinates in all networks. In figure 4c, the average coordinate magnitude for dense and sparse networks on each recorded DIV is plotted. At early ages, the average coordinate magnitude in dense networks is greater than in their sparse counterparts. This indicates that pairwise connections form faster in dense networks. However, in sparse networks, the average coordinate magnitude stabilizes at (slightly) higher values than in dense networks (Fig. 4c). In Fig 4d, we examine the average deviation from the line in dense and sparse networks, for all active pairs. Pairwise activation is relatively balanced during dense network maturation (), as demonstrated by low deviation angles. In sparse networks, deviation angles decrease, but remain larger than dense deviation angles throughout maturation.
Wagenaar et al. wagenaar_2006 observed that sparse networks are slower to develop network bursting than their dense counterparts (Fig. 4a). Additionally, activation graphs reveal that late onset bursting, a function of pairwise interactions ham_2008 , is highly correlated to the slow development of pairwise activation connections. Therefore, early development of pairwise interactions in dense networks appears to be related to the onset of multiple network bursts per minute around DIV. Note that multiple bursts per minute are not a present in sparse networks until about DIV (Fig 4a).
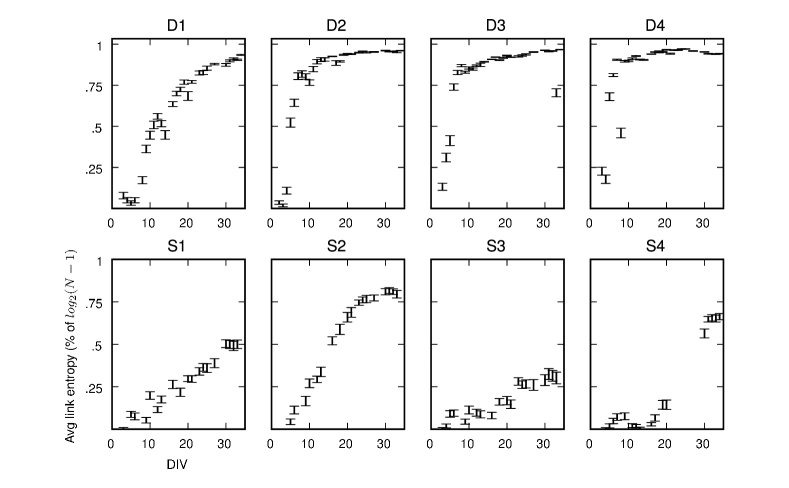
II.6 link entropy
Figure 5 shows the average daily link entropy for all electrodes in each of the eight networks studied. Note that a similar number of active electrodes were observed in all networks (Table 1). As dense networks mature, average individual electrode link entropy values approach the maximum possible value, which indicates nearly uniform probabilistic links between any target electrode and all other active electrodes. In other words, given activation at a particular dense network electrode, the next electrode to activate is almost completely random. Mature sparse networks exhibit midrange link entropy values, indicating that probabilistic connections from a target to all other electrodes are unequally distributed and therefore more predictable. This corresponds to the larger deviation angles observed in sparse networks (Fig. 4d). Note that sparse network S2 has larger link-entropy values than S1, S3 or S4 though not as large as in the dense networks.
II.7 Informational relationships of order 3
Groups of three electrodes (triplets), are the smallest (and most abundant) arrangement capable of providing information about functional connectivity in a network bettencourt_2008 . As described in Methods, informational structures are determined by comparing the information from two electrodes together conditional on the third with information gained from the two electrodes separately conditioned on the third. The resulting value () categorizes activity between electrodes as redundant, synergetic or independent.
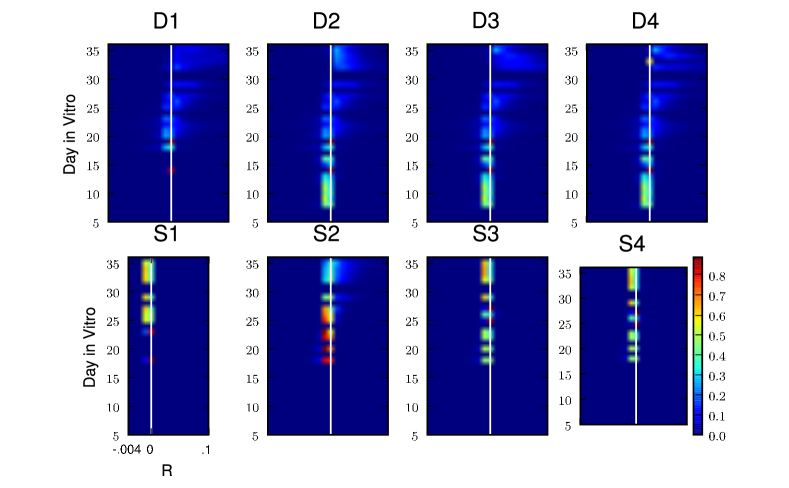
On each recording day, values for all unique electrode triplet ensembles are calculated (see Methods). Note that . In Figure 6, distributions of values from each network on each recorded day are shown. Synergetic values () are grouped in bin sizes of bits while redundant values () are grouped in bins of size bits. The asymmetry in relative sizes of positive and negative values has been demonstrated previously bcourt_2007 . Independent values () account for 35% of all values and are not shown. As described in Methods, all values are obtained during network burst events to provide a comparison with earlier studies.
In all instances, young network bursts ( DIV) are dominated by synergetic triplets. However, around DIV, all networks show a shift towards redundant triplets. By DIV, matured dense networks are dominated by redundant triplet ensembles. This finding is commensurate with our previous study of a mature DIV network bcourt_2007 . Sparse networks are observed to switch back and forth between primarily synergetic and primarily redundant from DIV. Unlike their dense counterparts, sparse network triplets became primarily synergetic after DIV. While three out of the four sparse networks remain primarily synergetic (Fig 6, S1, S3, S4), in one network (S2) redundant groups reemerge around DIV and are present throughout the remainder of the experiment. Note that synergetic triplets still maintain a strong presence during this time period. This is in clear contrast to dense networks where synergetic groups essentially disappear altogether in favor of redundant ensembles. This shift is primarily due to the evolution of individual triplet values changing from synergetic to redundant. In Figure 7, several randomly selected representative triplets and their values on different recording days are shown from network D4. We observe that the vast majority of dense network triplets (98%) that are synergetic at a young age become redundant during maturation.
At around DIV, redundant ensembles begin emerging in both dense and sparse networks (Fig. 6). This correlates to the time period when cortical networks in vitro are generally considered mature jimbo_1999 and when Wagenaar et al. wagenaar_2006 observed that spike rates stopped increasing and leveled off.
II.8 Triplet interactions
Large link-entropy values and the presence of redundant ensembles do not appear to be directly correlated to one another. However, large values of link entropy seem to be an indicator that redundant ensembles will dominate the informational relationships. It should be noted that in D1, the rise in average link-entropy and the increase in redundant triplets are well correlated, but this is not observed in the other three dense networks where link-entropy maximizes before redundant ensembles fully dominate. Regardless, results suggest that high values of link entropy are necessary for the emergence and dominance of redundant neuronal ensembles. Figure 5 S2 indicates that, with moderate link entropy values, synergetic and redundant groups coexist. Relatively low link entropy, like that seen in S1, S3, and S4, appears indicative of synergetic relationships (Fig. 5).
III Discussion
In this manuscript, we explored quantitative patterns of neuronal interactions in developing dense and sparse cultured cortical networks. Such networks are formed when dissociated prenatal cortical tissue is plated on microelectrode arrays and new connections are spontaneously formed. Multisite electrophysiological data from these networks provides unique access to the development of cortical cultures. It should be noted that in vitro network formation is guided by similar mechanisms (synaptogenesis; herndon_1981 ) used by intact nervous systems.
III.1 Pairwise interactions
At the most basic level, network formation can be thought of as a pairwise phenomenon where two neurons form synaptic connections with one another through electrical and chemical means. We extrapolate functional pairwise connections through a competitive first response model which is based on the assumption that all previous activity (within a biologically plausible time window) contributes to action potential initiation. This model is used to create directed, weighted activation graphs.
Mature activation graphs of dense networks reveal that connections between electrodes are mostly reciprocal (, Fig 4d) as indicated by relatively low deviation angles. In contrast, electrodes in sparse networks tend to develop activation connection strengths that are skewed in one direction or the other (larger deviation angle, , Fig. 4d). Additionally, link entropy in sparse networks is smaller than link entropy in dense networks (S1-S4, Fig. 5). Together, these results indicate that electrodes show activation pathway biases (low link entropy) in sparse networks, but these biases are not reciprocal between pairs. In dense networks, the opposite appears true; probabilistic activation pathways between electrodes are nearly uniform (large values of link entropy, Fig. 5) and reciprocal between pairs.
In networks processing information, each type of connection structure has advantages and disadvantages. Dense networks appear to have more redundancy (high link entropy) which may allow for higher fault tolerance: if a path via a given electrode becomes unresponsive to activation attempts by another, many other pathways could easily be activated. However, such a system may be detrimental to rapid information processing where fewer strong pathways, like those seen in sparse networks, could help an animal reach a fast decision state with greater precision. The presence of favored activation pathways in sparse networks may indicate that they are better platforms for performing training studies that seek to change network interactions in vitro shahaf_2001 . Since there are fewer probabilistic pathways for modification, changes to these connections will likely produce greater differences in existing efferent and afferent activation pathways. Conversely, shutting down or building pathways in dense networks would likely produce a less noticeable change in directional activation patterns as many detours are available.
Ensembles of nodes are the minimum required to form computational groups bettencourt_2007 . Sequential chains of redundant cells, shown in Figure 3b, can be used to relay information, and similar arrangements have been shown to play a role in short-term memory in the brain abeles_1991 diesmann_1999 . In the synergetic configuration depicted in Fig 2a, a neuron receives inputs from many other cells in such a way that spiking activity is a nonlinear function of the inputs. Both systems (redundant and synergetic) allow neurons to integrate activity from many sources and process information.
We demonstrated that plating density has an important effect on informational relationships. Dense and sparse networks develop similar distributions of synergetic informational structures between and DIV (Fig. 6). However, as dense networks mature, most triplets change from synergetic to redundant functional informational connections (Fig. 7). By about DIV very few synergetic triplets remain in dense networks. Conversely, individual triplets in sparse networks remain primarily synergetic from early to late stages of development. These results suggest that sparse networks may be better suited for processing information since synergetic relationships are necessary to perform these tasks bcourt_2007 . Of course synergetic relationships also exist in denser networks, but in a smaller relative proportion. They may also occur in larger groups of cells, not analyzed here bettencourt_2008 . One mature sparse network, S2 (Fig. 6), showed a relatively even mix of both synergetic and redundant ensembles during late stages of maturation. This was not seen in any of the other networks. Furthermore, this network exhibited link entropy values lying between the other sparse networks and the dense networks (Fig 5). These findings suggest a link between activation connections and informational relationships. Specifically, when activation connections are balanced throughout a network (larger link entropy values), redundant ensembles result. However, if activation connection are not quite balanced (mid range link entropy values), but are close, both synergetic and redundant ensembles appear.
The observed density dependent functional organization of cortical tissue in vitro raises interesting questions for future research. To elucidate how network density affects connectivity structures, experiments that span a broader range of plating densities are needed. Additionally, it would be interesting to apply these analytical techniques to recordings where a network is monitored continuously during development.
III.2 Conclusion
The development of functional connectivity in neural networks in vitro comprising similar cells is greatly affected by plating density. In a comparison of dense and sparsely prepared networks, we demonstrate that strong pairwise connections occur earlier in dense networks. Link entropy analysis of pairwise activation graphs reveal that nodal connections tend to be biased in sparse and nearly equal in dense networks. Connections between electrode triplets in both dense and sparse networks are primarily synergetic during early stages of development. However, in dense networks, they become primarily redundant by DIV. Conversely, in sparse networks triplets are primarily synergetic by DIV. Due to the fact that in vitro cultures have many similarities with in vivo tissue, we believe that the developmental features identified here may also play a role in living organisms. These findings should be applicable to future research seeking to replicate or emulate brain functions and provide useful constraints for experiments of neural function.
IV acknowledgements
We are grateful to Daniel Wagenaar, Jerome Pine and Steve Potter for making the data analyzed in this manuscript available to us. This work was supported by the Los Alamos National Laboratory Directed Research and Development (LDRD) 2009006DR synthetic cognition through petascale models of the primate visual cortex project.
References
- [1] M. Abeles. Corticonics: Neural Circuits of the Cerebral Cortex. Cambidge University Press, Cambridge, 1991.
- [2] B. Anderson and T. Harvey. Alterations in cortical thickness and neuronal density in the frontal cortex of albert einstein. Neuroscience Lett., 210:161–164, 1996.
- [3] J. M. Beggs and D. Plenz. Neuronal avalanches are diverse and precise activity patterns that are stable for many hours in cortical slice cultures. J. Neurosci., 24:5216, 2004.
- [4] L. M. A. Bettencourt, V. Gintautas, and M. I. Ham. Identification of functional information subgraphs in complex networks. Phys. Rev. Lett., 100:238701, 2008.
- [5] L. M. A. Bettencourt, G.J. Stephens, M. I. Ham, and G. W. Gross. Functional structure of cortical neuronal networks grown in vitro. Phys. Rev. E, 75:021915, 2007.
- [6] L. M. A. Bettencourt, G.J. Stephens, M.I. Ham, and G. W. Gross. Functional structure of cortical neuronal networks grown in vitro. Phys. Rev. E, 75:021915, 2007.
- [7] G. Bi and M.M. Poo. Synaptic modifications in cultured hippocampal neurons: Dependence on spike timing, synaptic strength, and postsynaptic cell type. J. Neurosci, 18:10464–10472, 1998.
- [8] M.A. Corner, J. Van Pelt, P.S. Wolters, R.E. Baker, and R.H. Nuytinck. Physiological effects of sustained blockade of excitatory synaptic transmission on spontaneously active developing neuronal networks?an inquiry into the reciprocal linkage between intrinsic biorhythms and neuroplasticity in early ontogeny. Neurosci Biobehav Rev, 26:127–185, 2002.
- [9] T. M. Cover and J. A. Thomas. Elements of Information Theory. Wiley, New York, 1991.
- [10] M. Diesmann, M. O. Gewaltig, , and A. Aertsen. Stable propagation of synchronous spiking in cortical neural networks. Nature, 402:529, 1999.
- [11] O. Feinerman, M. Segal, and E. Moses. Identification and dynamics of spontaneous burst initiation zones in unidimensional neuronal cultures. J Neurophysiol, 97(4):2937–2948, 2007.
- [12] G.W. Gross. Internal dynamics of randomized mammalian neuronal networks in culture. In: Enabling technologies for cultured neural networks. New York: Academic, 1994.
- [13] M. I. Ham, L. M. A. Bettencourt, G.W. Gross, and F.D. McDaniel. Spontaneous coordinated activity in cultured networks: Analysis of multiple ignition sites, primary circuits, and burst phase delay distributions. J. Comp. Neurosci., 24:346–357, 2008.
- [14] R.M. Herndon, F.J. Seil, and C. Seidman. Synaptogenesis in mouse cerebellum: a comparative in vivo and tissue culture study. Neuroscience, 6(12):2587–98, 1981.
- [15] Y. Jimbo, T. Tateno, and H.P.C. Robinson. Simultaneous induction of pathway-specific potentiation and depression in networks of cortical neurons. Biophys J, 76:670, 1999.
- [16] J.H. Kim, P.O. Guimaraes, M.Y. Shen, L.M. Masukawa, and D.D. Spencer. Hippocampal neuronal density in temporal lobe epilepsy with and without gliomas. Acta Neuropathologica, 80:41–45, 19990.
- [17] E. Maeda, H. P. C. Robinson, and A. Kawana. The mechanisms of generation and propogation of synchronized bursting in developing networks of cortical neurons. J. Neurosci, 15:939, 1995.
- [18] H. Markram, J. Lukbe, M. Frotscher, and B. Sakmann. Regulation of synaptic efficacy by coincidence of postsynaptic aps and epsps. Science, 275:213–215, 1997.
- [19] S. Marom and G. Shahaf. Development, learning and memory in large random networks of cortical neurons: lessons beyond anatomy. Q. Rev. Biophys., 35:63, 2002.
- [20] K. Nakanishi and F. Kukita. Functional synapses in synchronized bursting of neocortical neurons in culture. Brain Res, 795:137–146, 1998.
- [21] Pfister J. P. and Gerstner W. Triplets of spikes in a model of spike timing-dependent plasticity. J. Neurosci, 26:9673–9682, 2006.
- [22] L. Paninski. Estimation of entropy and mutual information,. Neural Comp., 15:1191–1253, 2003.
- [23] F. Reike, D. Warland, R.R. de Rutyter Van Steveninck, and W. Bialek. Spikes: Exploring the Neural Code. MIT Press, Cambridge, MA, 1997.
- [24] E. Schneidman, W. Bialek, and M. J. Berry 2nd. Synergy, redundancy, and independence in population codes. J. Neurosci., 23:11539, 2003.
- [25] G. Shahaf and S. Marom. Learning in networks of cortical neurons. J Neurosci, 21:8782–8788, 2001.
- [26] G. Spitsyna, J.E. Warren, and S.K. Scott. Converging language streams in the human temporal lobe. J. Neurosci, 26:7328–7336, 2006.
- [27] A. Tang, D. Jackson, J. Hobbs, W. Chen, J.L. Smith, H. Patel, A. Prieto, D. Petrusca, M.I. Grivich, A. Sher, P. Hottowy, W. Dabrowski, A.M. Litke, and J.M. Beggs. A maximum entropy model applied to spatial and temporal correlations from cortical networks in vitro. J. Neurosci, 28:505–518, 2008.
- [28] D.A. Wagenaar, J. Pine, and S.M. Potter. An extremely rich repertoire of bursting patterns during the development of cortical cultures. BMC Neurosci, 7:11, 2006.