Three Dimensional Line Transfer Study of Energy Sources in Compact
Molecular Gas in Active Galaxies
— AGN/Starburst Connection —
Abstract
Recent observations suggest molecular line ratios in millimeter and submillimeter bands may be a good tool to reveal the long-standing question on the origin of energy sources in obscured active galaxies – AGN and/or starburst. Observations of actual molecular medium show in general inhomogeneous structures as well as high-resolution hydrodynamic simulations do. In order for precise interpretation of emergent line emission from the inhomogeneous molecular gas to probe the dominant energy source of active galaxies, we study characteristic features of emergent intensities via three-dimensional non-LTE (non-local thermodynamic equilibrium) line transfer simulations. Our results succeeded in making clear 1) the necessary conditions for HCN/HCO+-dichotomy, and 2) importance of clumpiness on intensity ratio and its interpretation. These results are obtained for the first time by our realistic three-dimensional simulations, and line transfer simulations will be a powerful tool to comprehensive studies of extragalactic interstellar medium (ISM) in forthcoming ALMA (Atacama Large Millimeter/submillimeter Array) era.
ALMA-J Office, National Astronomical Observatory of Japan, Mitaka, Tokyo, 181-8588, Japan
Center for Computational Astronomy, National Astronomical Observatory of Japan, Mitaka, Tokyo, 181-8588, Japan
1. Introduction
Molecular gas in external galaxies is a subject of crucial importance for observational and theoretical studies of galaxy formation. Among the interstellar medium (ISM), compact molecular gas around an active galactic nuclei (AGN) is expected to be energy budget from AGN and/or the nuclear starburst of possible relevance. Recent observations suggest line ratios in millimeter and submillimeter bands may be a good tool to reveal the long-standing question of the origin of activities in obscured active galaxies – AGN or nuclear starburst (see e.g. Kohno et al. 2001; Kohno 2005; Imanishi et al. 2007).
Current observations present compact molecular gas of size 1 kpc or less, though, hydrodynamic simulations predict highly inhomogeneous and clumpy substructures in a ”compact” molecular gas at the centers of active galaxies (Wada & Norman 2001; Wada & Tomisaka 2005). In such an inhomogeneous molecular gas, energy level populations of emitting particles will be also complex and complicated one, which makes derivation of correct physical features of emitting ISM from emergent line intensities difficult. Then we study excitation conditions and line intensities from an inhomogeneous molecular gas at the center of an active galaxy, with three-dimensional non-local thermodynamic equilibrium (non-LTE) line transfer simulations along with the results of high-resolution hydrodynamic simulation (Wada & Tomisaka 2005; Yamada, Wada & Tomisaka 2007; Yamada & Tomisaka 2008).
2. Numerical Calculations
We first performed hydrodynamic simulations of a compact ( pc) ISM in a steady gravitational potential of supermassive blackhole () and host galaxy. And then we performed non-LTE line transfer simulations as a post process using a snapshot result of hydrodynamic simulation. We solved non-LTE rate equations in statistical equilibrium up to and integrated a standard radiative transfer equation along all the sampling rays to calculate mean intensity . We calculated these two equations iteratively until energy level distributions and mean intensity field converge with relative precision (Hogerheijdge & van der Tak 2000 ; see Yamada, Wada & Tomisaka 2007 for details).
3. HCN and HCO+ Dichotomy of Active Galaxies
Since the pioneering work of Kohno et al. (2001), it has been argued that intensity ratio of HCN and HCO+ rotational lines would be able to probe obscured central energy sources of active galaxies in terms of chemical abundances (see e.g. Kohno 2005; Imanishi et al. 2007; Baan et al. 2008). The basic idea underlying this dichotomy is that strong X-ray from AGN will form X-ray dominated regions (XDR) compared with stellar feedback from nuclear starburst that will form photodissociation region (PDR), and different chemical structures in XDR and PDR imprinted in molecular line ratio indirectly enables unveil the central energy sources.
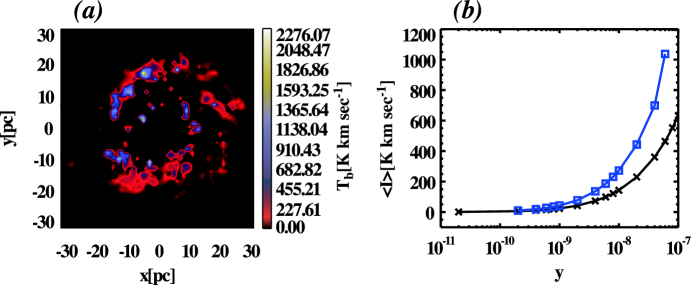
In Figure 1 we show our numerical simulation results with an assumption of spatially uniform chemistry. Distribution of integrated intensity of HCN (1-0) line (Fig. 1(a)) becomes quite inhomogeneous, reflecting the inhomogeneous structure in the molecular gas model. Numbers of bright regions of which radius is 10pc or less are observed. Current millimeter observational instruments cannot resolve these small structures except for the closest galaxies, but forthcoming ALMA (Atacama Large Millimeter/submillimeter Array) telescope will reveal these internal structures in a ”compact” gas at the center of a distant galaxy. In order to examine intensity ratio of HCN(1-0) and HCO+ (1-0), we computed HCN and HCO+ lines for a wide range of molecular abundances (, where is relative molecular abundance to H2). In Figure 1 (b) we plot the ratio of resultant intensities averaged over the ”field-of-view” of the simulation as a function of for face-on view. Our results show that for the same value of , HCO+ (1-0) is always brighter than HCN (1-0), so that a high intensity ratio greater than unity requires overabundance of HCN compared with HCO+ () on average.
Current models of XDR chemistry predicted under-abundance of HCN (Meijerink & Spaans 2005; Meijerink, Israel & Spaans 2007), and then original picture of HCN/HCO+ diagnostics in terms of XDR/PDR chemistry would need revision and sophistication. Extended observations have given rise discussion on alternative mechanisms that determine such as mid-IR photon pumping (Aalto et al. 2007). Extended line transfer simulations including non-uniform chemical structure and/or continuum pumping will serve as a powerful tool to more detailed studies as well as more sophisticated chemistry models with realistic gas geometry.
4. Intensity Ratio of Millimeter and Submillimeter Lines
Recent progress of submillimeter observations of high- molecular lines opened a way to examine physical conditions of emitting ISM in more detail. Since critical densities for LTE population and wavelengths are dependent on , average intensity ratio will be affected by density and temperature structures, and the effect of inhomogeneity is expected to be stronger for high density tracer because of small fraction of dense and thermalized gas. We examined the ratio of 4-3 and 1-0 lines of HCN molecule as representative dense gas tracers with line transfer simulations described in §2 (Yamada 2008; Yamada & Tomisaka 2008).
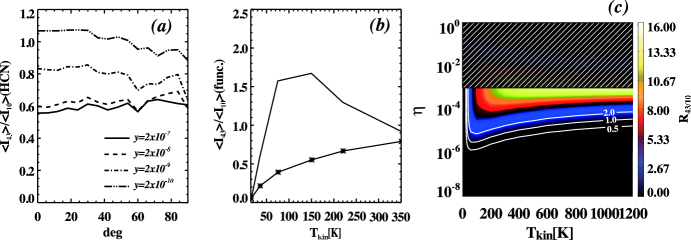
Figure 2 (a) shows averaged intensity ratio as a function of viewing angle ( is face-on view, and 90∘ is edge-on view). It shows that average decreases with increase of , which contradicts one-zone estimation that approaches unity as (or optical thickness) increases. This result is likely to come from multi-phase nature of emitting ISM.
4.1. Two-Phase Modelling and Analytic Formula of
We model multi-phase ISM as a simple two component one based on the knowledge of excitation mechanisms. Since we know that average kinetic temperature of model ISM (174 K) is sufficiently higher than the excitation energy of level of HCN, we assume single temperature ISM. Furthermore in order for analytic examination we assume optically thin over a whole region. Then our two-phase model consists of two density components, one is dense () clumps of which volume fraction is , and another is tenuous () ambient.
Considering that in dense () regions level population is close to LTE, and in warm () and tenuous () regions level population is a balance of spontaneous decay and collisional excitation (Yamada et al. 2007), average intensity ratio is described as a ratio of sum of intensities from both regions,
| (1) | |||||
| (2) |
Figure 2 (c) shows an numerical evaluation of thus obtained . It is obvious that average is quite sensitive to , and can take almost any value up to theoretical maximum (=16 in this case) even if average density ( cm-3) is smaller than critical density ( cm-3 for 1-0 line). In other words, intensity ratio close to unity does not guarantee a thermalized population.
In Figure 2 (b) we plot numerical evaluation of equation (1) with a definition of
| (3) |
Compared with results of line transfer simulations of isothermal hydrodynamic data generated by original input model, we can see that the analytic formula of (1) can fit numerical simulation results within a factor of two in spite of simplicity of this formula. We thus concluded that multi-phase modelling based on excitation condition considerations along with numerical line transfer simulations could help construct more sophisticated ways to derive correct physical features and structures from observed line intensities. Our results also demonstrated the importance of spatial structure of density (and temperature) on emergent intensity besides chemical structure.
5. Summary
We showed theoretical considerations on molecular line diagnostics of active galaxies by numerical experiments of three-dimensional line transfer simulations. Two kinds of results ( and of HCN) showed that simple models need revisions to take into account of inhomogeneities of emitting ISM. Numerical experiments can achieve a high-resolution examination in prior to the forthcoming ALMA project, and will be a powerful tool to examine physics imprinted in emergent intensities.
Acknowledgments.
Numerical computations were partly carried out on the PC cluster at Center for Computational Astrophysics (CfCA), National Astronomical Observatory of Japan, and this research was supported in part by Grants-in-Aid by the Ministry of Education, Science, and Culture of Japan (16204012).
References
- Aalto et al. (2007) Aalto, S., Monje, R. & Martin, S. 2007, A&A, 475, 479.
- Baan et al. (2008) Baan, W. A., Henkel, C., Loenen, A. F., Baudry, A & Wiklind, T. 2008, A&A, 477, 747.
- Hogerheijdge & van der Tak (2000) Hogerheijdge, M. R., & van der Tak, F. F. S. 2000, A&A, 362, 697.
- Imanishi et al. (2007) Imanishi, M. et al. 2007, AJ, 134, 2366.
- Kohno et al. (2001) Kohno, K. et al. 2001, in ASP Conf. Ser. 249, 672.
- Kohno (2005) Kohno, K. 2005, AIP Conf. Ser. vol. 783, 203.
- Meijerink & Spaans (2005) Meijerink, R. & Spaans, M. 2005, A&A, 436, 397.
- Meijerink, Israel & Spaans (2007) Meijerink, R., Saans, M. & Isral, F. P. 2007, A&A, 461, 793.
- Yamada et al. (2007) Yamada, M., Koyama, H., Omukai, K. & Inutsuka, S. 2007, ApJ, 657, 849.
- Yamada, Wada & Tomisaka (2007) Yamada, M., Wada, K., & Tomisaka, K. 2007, ApJ, 671, 73.
- Yamada (2008) Yamada, M. 2008, proceedings of ”FIR 2007”, EAS Publication Series, 31, 97 (arXiv:0712.13179).
- Yamada & Tomisaka (2008) Yamada, M. & Tomisaka, K. 2008, in prep.
- Wada & Norman (2001) Wada, K. & Norman, C. 2001, ApJ, 547, 172.
- Wada & Tomisaka (2005) Wada, K. & Tomisaka, K. 2005, ApJ, 619, 93.