Carbon and Nitrogen Abundances in Early-type Galaxies
Abstract
For the first time, we undertake a systematic examination of the nitrogen abundances for a sample of 35 early-type galaxies spanning a range of masses and local environment. The nitrogen-sensitive molecular feature at 3360Å has been employed in conjunction with a suite of atomic- and molecular-sensitive indices to provide unique and definitive constraints on the chemical content of these systems. By employing NH3360, we are now able to break the carbon, nitrogen, and oxygen degeneracies inherent to the use of the CN-index. We demonstrate that the NH3360 feature shows little dependency upon the velocity dispersion (our proxy for mass) of the galaxies, contrary to what is seen for carbon- and magnesium-sensitive indices. At face value, these results are at odds with conclusions drawn previously using indices sensitive to both carbon and nitrogen, such as cyanogen (CN). With the aid of stellar population models, we find that the N/Fe ratios in these galaxies are consistent with being mildly-enhanced with respect to the solar ratio. We also explore the dependence of these findings upon environment, by analyzing the co-added spectra of galaxies in the field and the Coma cluster. We confirm the previously found differences in carbon abundances between galaxies in low- and high-density environments, while showing that these differences do not seem to exist for nitrogen. We discuss the implications of these findings for the derivation of the star formation histories in early-type galaxies, and for the origin of carbon and nitrogen, themselves.
Subject headings:
galaxies: abundances — galaxies: elliptical and lenticular, cD — galaxies: evolution — galaxies: formation — galaxies: stellar content1. Introduction
Uncovering the star formation histories of early-type galaxies has proved to be a challenging endeavor for several decades now. Perhaps the most common approach to date has been via the comparison of Lick/IDS spectral indices, each with varying degrees of sensitivity to age and metallicity (Worthey, 1994). Alas, the lack of indices which are purely sensitive to age and/or metallicity has limited the uniqueness of the claimed results. Despite a rich literature, there remains fundamental disagreement on the magnitude and even veracity of important trends, including those linking age, metallicity, and relative elemental abundances, with mass and environment. A further limitation to this technique is its sensitivity to the youngest stellar component in a given galaxy, as opposed to the more representative underlying population.
An alternative approach, and one employed successfully for our own Galaxy, is to use our knowledge of galactic chemical evolution to inform our derivation of star formation histories. In massive early-type galaxies Oconnell (1976) first noticed that Mg abundance was enhanced relative to Fe; Other works confirmed this by comparing absorption line indices with isochrone-based stellar population models. Because Mg is predominantly produced in Type II supernovae while Fe production is dominated by Type Ia supernovae, this enhancement is often interpreted as the result of very short timescales for the formation of stars in these galaxies. Apart from Mg, other elements (eg. C, N, Na) have been claimed to be enhanced in large ellipticals (Worthey 1998; Burstein 2003; Kelson et al. 2006, Sánchez-Blázquez et al. 2003, 2006a (SB03 and SB06a hereafter); Schiavon 2007; Graves et al. 2008) and to be strongly correlated with their velocity dispersions (although see Kelson et al., 2006; Clemens et al., 2006) for an alternate perspective regarding Mg and C).
Claims have been made for a strong N/Fe correlation with mass (SB06a, Kelson et al., 2006; Schiavon, 2007; Graves & Schiavon, 2008). Nitrogen is produced during hydrogen burning via the CNO and CN cycles, and it is created as both, primary and secondary element. In primary nucleosynthesis N is produced at the same time as C and O and it is independent of metallicity while in secondary production nitrogen is synthesized from the carbon and oxygen already present in the star, and its abundance is therefore proportional to the heavy elements abundance. The correlation of N/Fe with mass have been interpreted as a correlation between N/Fe and metallicity (through the mass-metallicity relation) and has lead the authors above to conclude that most of the N produced in ellipticals is of secondary origin. To derive nitrogen abundances, the CN-band at 4175Å has typically been used; however, disentangling the effects of C, N, and O using the CN-band is difficult (Burstein, 2003). Direct observation of the NH feature at 3360Å offers a more direct, and robust estimator as the NH-feature is insensitive to C and O (Sneden, 1973; Norris et al., 2002) and it is directly measuring N abundances (Bessell & Norris, 1982; Tomkin & Lambert, 1984). In addition, the near-UV light is produced primarily by dwarf stars (Davidge & Clark, 1994), while the optical cyanogen indices result from a more complex mix of both dwarf and giant star light. This avoid the variation in the stellar atmospheric abundances due to mixing during the first dredge-up.
There are fewer than 15 early-type galaxies with published values of NH3360 in the literature (Ponder et al., 1998; Boulade et al., 1988; Davidge & Clark, 1994), due in large part to the relative insensitivity of detectors in the near-UV. We present here observations of the NH feature in a sample of 35 early-type galaxies in the field, Virgo, and Coma clusters. We show that previous claims of correlations between nitrogen and velocity dispersion are incorrect and that the NH3360 index- relation is almost flat.
2. Observations and Data Reduction
Long slit spectroscopic data for 35 ellipticals were obtained at the 4.2m William Herschel Telescope at Roque de los Muchachos Observatory, using the ISIS spectrograph. The instrumental configuration provided and spectral coverage from 3140 to 4040Å in the blue arm with an spectral resolution of 2.3Å (FWHM) and a typical sigmal to noise per Å of 40. Our sample is a subset of those presented in SB06a, allowing us to supplement our near-UV data with the associated optical indices (35005250Å). We measure the NH3360 index in our new data, and the Serven, Worthey & Briley (2005, SWB05 hereafter) optical indices in our SB06a optical spectra.
In SB03, we claimed that galaxies in the Coma cluster had much lower CN and C4668 indices than those in lower-density environments. We were unable then to conclude whether the differences were due exclusively to differences in carbon or if nitrogen was also overabundant in galaxies in lower-density environments. With the aim of resolving this issue, we selected our sample to include field, Virgo and Coma ellipticals, spanning a range in velocity dispersions (130330 km s-1). Following the nomenclature of SB03, we denote our Coma cluster sample as High-Density Environment Galaxies (HDEG), while galaxies in the field and Virgo are denoted Low-Density Environment Galaxies (LDEG).
We have followed the standard reduction procedure for long-slit spectra, using REDucm E (Cardiel, 1999). Galaxy spectra were extracted within a central equivalent aperture of 4′′ at the distance of NGC 6703 (corresponding to a physical aperture of 0.76 kpc). We measured the NH3360 index using the definition of Davidge & Clark (1994)111A case could be made to amend the Davidge & Clark (1994) definition somewhat, in light of Carbon et al. (1992; Fig 13). Specifically, the NH3360 continua sit within the broad wings of the NH feature itself, reducing its optimal sensitivity to nitrogen. Redefining the red continuum to be 34803520Å would mitigate this effect to some degree, but for consistency with the canonical definition, we have not pursued this approach. and the CNO3862, CNO4175, and CO4685 indices, as defined by SWB05. All indices were measured at a dispersion of =200 km s-1 and corrected for the effects of velocity dispersion broadening using a combination of synthetic spectra from Bruzual & Charlot (2003, BC03 hereafter) and Vazdekis et al. (2008, V08 hereafter).
3. Results
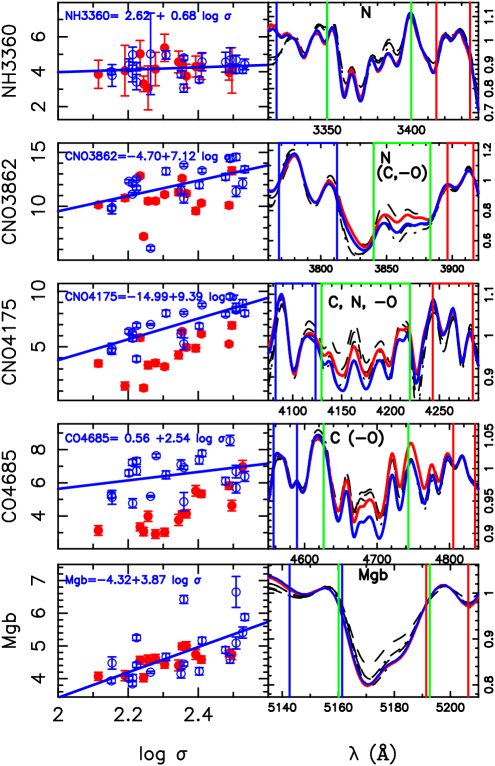
Figure 1 shows the co-added spectra in different wavelength regions of LDEG (blue) and HDEG (red), with velocity dispersions in the range 150250 km s-1. Before being added, the spectra were shifted to the same radial velocity and broadened to the maximum of all spectra (250 km s-1). The spectral regions correspond to the bands of four different indices: NH3360, CNO3862, CNO4175, and CO4685.
Overplotted in these diagrams are the models by BC03 for the NH3360 and the models of V08 for the remainder of the indices. We could not use V08 for the comparison of the NH index because the spectra start at 3500 Å. However, we prefer to use it for the other regions of the spectra as the stellar library used in the BC03 models suffers from wavelength calibration problems. Nevertheless, we have checked and ensured that the results obtained are independent of the models employed. All synthetic spectra were degraded to the same broadened resolution as the galactic spectra. We have plotted four models in each figure, with ages 6 and Gyr, and metallicities solar and supersolar ([M/H]=+0.4 for BC03 and [M/H]=+0.2 for V08).
Comparing the empirical spectra with the models in Fig. 1 and taking into account the element dependence of the indices (see inset of the figure) we can see: NH3360 is slightly overabundant with respect to the scaled-solar models; CNO3862 is compatible with the scaled-solar models at lower metallicities (for older ages) or higher metallicities (for younger ages); CNO4175 and CO4682 are overabundant in the field galaxies, but not for the cluster galaxies. In consort, these data require nitrogen-based indices be overabundant with respect to solar, carbon-based indices be overabundant with respect to solar only for LDEG, and oxygen be similarly overabundant.
3.1. The index-velocity dispersion relations
In Fig. 1 we present the behavior of the four indices analyzed, in addition to Mgb, as a function of the velocity dispersion of the galaxies. We distinguish between three different groups of plots, depending on the chemical element dominating the intensity of the index: N-based indices (CO3862 and NH3360), C-based indices (CNO4175 and CO4685), and Mgb. Indices dependent on C show a strong dependency upon velocity dispersion, in a similar way to Mgb. However, the trends between the N-sensitive indices and velocity dispersion are much flatter; indeed, they are even flatter than that found for Fe (see SB03).
Differences in the slope of the index- diagram could appear due to a different sensitivity of the indices to age and/or metallicity and do not necessarily reflect differences in the chemical abundance ratios. Figure 2 shows the variation of the indices with age for different metallicities. It can be seen that each of the SWB05 indices show a strong dependence on metallicity, particularly CO4685. The Lick/IDS index Mgb also shows a strong metallicity dependence. On the other hand, for metallicities relevant for elliptical galaxies (), NH3360 is essentially constant with age and overall metallicity. This behavior allows NH3360 to be used successfully to derive nitrogen abundances in integrated spectra, with Boulade et al. (1988) confirming its strong sensitivity to nitrogen abundance .
Can we explain the relations between the other indices and as the consequence only of a relation between the overall metallicity and/or age with ? To answer this question we have parametrized the models of BC03 and V08 as a function of age and metallicity, in the age and metallicity restricted to the range covered by our sample, 4-17 Gyrs and -0.70[M/H]0.40. If we allow for the same age variation with (from 5-12 Gyr in the range 125-350 kms-1) for all the indices, we need 0.13 dex more metallicity variation to explain the CNO4175- and CO4685- relations – the most C-sensitive indices – while and extra 0.3 dex variation in metallicity is needed to explain the relation of the Mgb- slope. At a face value, this would be indicating that [C/M], [Mg/M] and [Mg/C] increase with . The conclusions, however, remain very speculative until the oxygen abundance and its variation with is calculated in these galaxies. In addition, the indices strongly dependent on C show a systematic offset between LDEG and HDEG, with the indices for HDEG systematically weaker than those for LDEG. 222This behavior is also visible in the near-IR C-sensitive indices (Mármol-Queraltó, in preparation).
4. Discussion
We present here the NH3360 indices for a sample of 35 early-type galaxies. Unlike the ambiguities which exist when inferring nitrogen abundances from cyanogen indices in the optical (due to contamination from carbon and oxygen in the bands and associated continua), the near-UV molecular feature of NH isolates the nitrogen abundance. The main conclusions of this work are: (1) a flat relation exists between the NH3360 index and the velocity dispersion of the galaxies, contrary to what has been previously claimed by other authors from their analysis of the more ambiguous CN-index; (2) N is independent of local environment, whereas C appears stronger for LDEG relative to HDEG. In this sense, carbon and nitrogen production appear to be essentially decoupled from one another.
Our results can be useful for constraining the origin of C and N. Nitrogen is produced in both intermediate-mass and massive stars, and it can have a primary and secondary origin (Carigi et al., 2005; Chiappini et al., 2006). The abundance ratio of a secondary element is predicted to increase with metallicity. If elliptical galaxies show a mass-metallicity relation, as it has been claimed by many authors (eg., Kodama & Arimoto, 1998), then we should expect the secondary N to increase with the mass of the galaxies, as suggested in previous works based upon cyanogen-inferred nitrogen abundance determinations (eg., Kelson et al., 2006; Schiavon, 2007). However, we have shown here that when a more “pure” nitrogen-sensitive indicator is used, there is no relation between the nitrogen abundance and the mass of the galaxies. This lack of correlation may be indicating primary production of nitrogen.
Nucleosynthesis studies predict that primary N can be produced both in the third dredge-up along the Asymptotic Giant Branch (AGB) phase, if nuclear burning at the base of the convective envelope is efficient (Renzini & Voli, 1981, hot-bottom burning), and recent yields, including rotationally-induced mixing, also predict significant production of N in massive stars (Meynet & Maeder, 2002). Chiappini et al. (2003, 2006) has shown that the inclusion of these yields in a Galactic chemical evolution model of the Milky Way predicts an N/O gradient consistent with observations. Having said that, this primary nitrogen production pathway is apparently only significant at low metallicities and is not predicted to be particularly relevant for systems such as elliptical galaxies that can reach supersolar metallicities very rapidly. In a system more similar to elliptical galaxies – that of the bulge of our galaxy – Ballero et al. (2007) (see also Matteucci, 1986) need to include primary N from massive stars of all metallicities (and all masses), in order too explain the data from planetary nebulae.
In elliptical galaxies, the offsets between LDEG and HDEG favor massive stars as the main contributors to primary nitrogen, because for the elements produced by intermediate mass stars, no offsets are detected. However, if that is the case, then we would expect a similar correlation between N and , as seen for Mg and . As we have shown though, the N– correlation appears flat from our new data and analysis. A possible solution is that the contribution from both massive and intermediate mass stars is shaping the N– relation in ellipticals. The delay in the N release from intermediate mass (4M 8 M⊙) stars is 100 Myr, so even in a relatively short star formation burst, some contribution from these stars is expected. It is believed that the star formation in ellipticals is both more efficient and of a shorter timescale with increasing galactic mass. If this is the case, N would be produced increasingly more prominently by massive stars in the most massive galaxies, while the less-massive galaxies with their more protracted star formation history would have an additional contribution from intermediate mass stars. As mentioned, the delay in the release of N from intermediate mass stars is 100 Myrs (the lifetime of 56 M⊙ solar metallicity stars); intermediate mass stars do not release significant amounts of Mg at high metallicities 333note that significant contribution from AGB stars to the heavy isotopes 25Mg and 26Mg is predicted at metallicities lower than [Fe/H] (Fenner et al., 2003), which would explain the different behavior of the Mg relation compared with the N- relation.
Carbon is another controversial element. While some authors argue that it is mainly produced in intermediate mass stars (Chiappini et al., 2003) (with masses between 14 M⊙) others suggest that massive stars are the main contributors (eg., Carigi et al., 2005). The offset between galaxies in different environments that is not seen in other elements produced mainly in massive stars, such as Mg, favors the suggestion that C is produced mainly in lower mass stars. However, if low- and intermediate-mass stars are the main producers of C, it is difficult to explain the strong correlation between C and and the overabundance of C/Fe with respect to the Sun. One possibility is that C is produced in both, massive and lower mass stars in comparable proportions. The significant slope in the relation would be the consequence of C production in massive stars while the offset would come from a different production in lower mass stars. This latter C release would increase the C budget in LDEG while in the HDEG, star formation ceases before this can happen.
Of course these are very simplified scenarios. The relative importance of the different N-sites and the origin of C in elliptical galaxies will be explored in a future paper using our GEtool chemical evolution code (eg., Hughes et al. 2008).
In summary, we report the first determination of “pure” nitrogen abundances for a sample of early-type galaxies and compare these with stellar population models. Contrary to what has been claimed previously, the nitrogen abundances do not vary with the velocity dispersion of the galaxies. The environmental differences found for C and N abundances impose an important constraint on chemical evolution and galaxy formation models. It will be critical to independently constrain the oxygen abundance and its dependence upon galaxy mass, in part because of the obvious synergies between CNO in low- and intermediate-mass stars, and in part because oxygen is simply the most dominant component (50%) of global metallicity.
References
- Ballero et al. (2007) Ballero, S. K., Matteucci, F., Origlia, L., & Rich, R. M. 2007, A&A, 467, 123
- Bessell & Norris (1982) Bessell, M. S. & Norris, J. 1982, ApJ, 263, L29
- Boulade et al. (1988) Boulade, O., Rose, J. A., & Vigroux, L. 1988, AJ, 96, 1319
- Burstein (2003) Burstein, D. 2003, in Astronomical Society of the Pacific Conference Series, Vol. 297, Star Formation Through Time, ed. E. Perez, R. M. Gonzalez Delgado, & G. Tenorio-Tagle, 253–+
- Cardiel (1999) Cardiel, N. 1999, PhD thesis, Universidad Complutense de Madrid, Spain
- Carigi et al. (2005) Carigi, L., Peimbert, M., Esteban, C., & García-Rojas, J. 2005, ApJ, 623, 213
- Chiappini et al. (2006) Chiappini, C., Hirschi, R., Meynet, G., et al. 2006, A&A, 449, L27
- Chiappini et al. (2003) Chiappini, C., Romano, D., & Matteucci, F. 2003, MNRAS, 339, 63
- Clemens et al. (2006) Clemens, M. S., Bressan, A., Nikolic, B., et al. 2006, MNRAS, 370, 702
- Davidge & Clark (1994) Davidge, T. J. & Clark, C. C. 1994, AJ, 107, 946
- Fenner et al. (2003) Fenner, Y., Gibson, B. K., Lee, H.-c., et al. 2003, Publications of the Astronomical Society of Australia, 20, 340
- Graves & Schiavon (2008) Graves, G. J. & Schiavon, R. P. 2008, ApJS, 177, 446
- Kelson et al. (2006) Kelson, D. D., Illingworth, G. D., Franx, M., & van Dokkum, P. G. 2006, ApJ, 653, 159
- Kodama & Arimoto (1998) Kodama, T. & Arimoto, N. 1998, MNRAS, 300, 193
- Matteucci (1986) Matteucci, F. 1986, MNRAS, 221, 911
- Meynet & Maeder (2002) Meynet, G. & Maeder, A. 2002, A&A, 390, 561
- Norris et al. (2002) Norris, J. E., Ryan, S. G., Beers, T. C., Aoki, W., & Ando, H. 2002, ApJ, 569, L107
- Oconnell (1976) Oconnell, R. W. 1976, ApJ, 206, 370
- Ponder et al. (1998) Ponder, J. M., Burstein, D., O’Connell, R. W., et al. 1998, AJ, 116, 2297
- Renzini & Voli (1981) Renzini, A. & Voli, M. 1981, A&A, 94, 175
- Sánchez-Blázquez et al. (2003) Sánchez-Blázquez, P., Gorgas, J., Cardiel, N., Cenarro, J., & González, J. J. 2003, ApJ, 590, L91
- Sánchez-Blázquez et al. (2006) Sánchez-Blázquez, P., Gorgas, J., Cardiel, N., & González, J. J. 2006, A&A, 457, 787
- Schiavon (2007) Schiavon, R. P. 2007, ApJS, 171, 146
- Serven et al. (2005) Serven, J., Worthey, G., & Briley, M. M. 2005, ApJ, 627, 754
- Sneden (1973) Sneden, C. 1973, ApJ, 184, 839
- Tomkin & Lambert (1984) Tomkin, J. & Lambert, D. L. 1984, ApJ, 279, 220
- Worthey (1994) Worthey, G. 1994, ApJS, 95, 107
- Worthey (1998) Worthey, G. 1998, PASP, 110, 888