Extended Ly Nebulae at :
An Extremely Rare and Strongly Clustered Population? 11affiliation: Observations reported here were obtained at the MMT
Observatory, a joint facility of the University of Arizona and the
Smithsonian Institution.
Abstract
To obtain an unbiased sample of bright Ly blobs ( ergs s-1), we have undertaken a blind, wide-field, narrow-band imaging survey in the NOAO Deep Wide Field Survey Boötes field with the Steward Bok-2.3m telescope. After searching over 4.82 deg2 at , we discover four Ly blobs with = 1.6 – 5.3 ergs s-1, isophotal areas of 28 – 57 □″, and broad Ly line profiles ( = 900 – 1250 km s-1). In contrast with the extended Ly halos associated with high- radio galaxies, none of our four blobs are radio-loud. The X-ray luminosities and optical spectra of these blobs are diverse. Two blobs (3 and 4) are X-ray-detected with (27 keV) = 2–4 ergs s-1 and have broad optical emission lines (C IV) characteristic of AGN, implying that 50% of our sample blobs are associated with strong AGN. The other 50% of blobs (1 and 2) are not X-ray or optically-detected as AGN down to similar limits. The number density of the four blobs is 3 10-6 Mpc-3, comparable to that of galaxy clusters at similar redshifts and lower than that found in the SSA22 proto-cluster at , even after accounting for the over-density of that region. The two X-ray undetected blobs are separated by only 70″ (550 kpc) and have almost identical redshifts ( kpc along the line-of-sight), suggesting that they are part of the same system. Given the rarity of the blobs and our discovery of a close pair, we speculate that blobs occupy the highest density regions and thus may be precursors of today’s rich cluster galaxies.
Subject headings:
galaxies: formation — galaxies: high-redshift — intergalactic medium1. Introduction
The recent discovery of extended Ly nebulae, the so-called Ly blobs, may ultimately provide clues to how galaxies formed in early Universe ( 2 – 5). The most luminous Ly blobs have been discovered mostly by deep narrow-band imaging surveys and have typical sizes of 10″ ( 100 kpc) and Ly luminosities of ergs s-1 (e.g., Keel et al., 1999; Steidel et al., 2000; Francis et al., 2001; Palunas et al., 2004; Dey et al., 2005; Smith & Jarvis, 2007). However, what powers the blobs and what they will evolve into remains a mystery. To begin to answer these questions, we need first to constrain their basic properties, including how common they are, how they are spatially distributed, and how diverse their possible power sources may be.
Despite intense interest, these characteristics, for even the brightest Ly blobs, are poorly constrained due to the absence of an appropriate sample. Giant, luminous blobs (Steidel et al., 2000) appear to be rare (Saito et al., 2006) at , so an efficient, large-volume survey is required to detect any. Furthermore, the survey must be blind to be representative of blob statistics and must include ancillary data (in the X-ray, other optical bands, etc.) to better constrain possible sources of blob emission. To date most Ly blobs have been discovered by targeting two previously known over-dense regions (Steidel et al., 2000; Francis et al., 2001; Palunas et al., 2004; Matsuda et al., 2004). Matsuda et al. (2004) discovered 33 additional Ly blobs in the proto-cluster region at where the two giant Steidel et al. blobs reside, and spectroscopic follow-up confirms that the blobs are located in three filamentary structures traced by compact Ly-emitting galaxies (Matsuda et al., 2005). Palunas et al. (2004) report that four Ly blobs are associated with an over-dense region of Ly emitters around the galaxy cluster J2142-4420 at . The first and only study of the environment of a Ly blob found without any prior knowledge of its surroundings (Dey et al., 2005) shows it to lie in a over-dense region traced by Ly-emitting galaxies (Prescott et al., 2008). Although these results suggest that bright Ly blobs occupy higher density regions, we still lack an unbiased, statistical measurement of how frequent and clustered they truly are.
The origin of the blobs’ Ly emission is similarly murky. Proposed mechanisms include gravitational cooling radiation from accreting gas (Haiman, Spaans, & Quataert, 2000; Fardal et al., 2001), galactic superwinds driven by a starburst (Taniguchi & Shioya, 2000), photo-ionization by extended star formation (Matsuda et al., 2007), and a hidden AGN (Haiman & Rees, 2001). Smith & Jarvis (2007) report the discovery of a giant Ly blob that appears to have cooling origin, while others suggest that blobs are experiencing outflows (Wilman et al., 2005) or are static (Verhamme et al., 2006). It is also not clear what central sources the blobs harbor, e.g., what fraction of those central sources contain AGN? These ambiguities arise from the optically-thick nature of the Ly line (cf. Yang et al., 2006), which clouds the interpretation of the blob kinematics, and from the lack of multi-wavelength data, which, were it available for a representative blob sample, could reveal the nature of any central sources.
To obtain a unbiased sample of bright Ly blobs ideal for determining their properties and, ultimately, for resolving the origin of their extended emission, we are conducting a blind, wide-field, narrow-band imaging survey for the brightest ( ergs s-1) and most extended ( □″) objects, similar to those originally found by Steidel et al. (2000). To date, only five such blobs have been discovered among several surveys (Steidel et al., 2000; Francis et al., 2001; Dey et al., 2005; Smith & Jarvis, 2007). We select the NOAO Deep Wide Field Survey (NDWFS) Boötes and Cetus fields (Jannuzi & Dey, 1999), as well as the Cosmic Evolution Survey (COSMOS) field (Scoville et al., 2007) as our targets, given the complementary, multi-wavelength data available for these fields. We choose as our survey redshift so that the optically thin H emission line from the surrounding gas falls in a relatively clean region of the NIR sky spectrum. The comparison between H and Ly, as well as analysis of other lines including [O II] , [O III] , and Civ, will enable us in future papers to study the kinematics of the surrounding gas in more detail (Dijkstra et al., 2006) and to better constrain the nature of any central sources.
In this paper, we present the initial results from our Ly blob survey in the NOAO Deep Wide Field Survey (NDWFS) Boötes field. In §2, we describe our narrow-band imaging survey design, observations, and selection of Ly blob candidates. In §3, we present the first results from the survey and its spectroscopic follow-up. We also discuss the number density and environment of the Ly blobs in comparison with previous studies. In §4, we summarize the results. Throughout this paper, we adopt cosmological parameters: = 70 , , and . All magnitudes are in the AB system (Oke, 1974).
2. Observations
2.1. Survey Design
Using the 90Prime one-degree field imager (Williams et al., 2004) mounted on the Steward Observatory Bok 2.3m telescope on Kitt Peak, we carry out our narrow-band imaging survey with a custom narrow-band filter (hereafter NB403 or NB). This narrow-band filter has a central wavelength of Å, designed for selecting Ly-emitting sources at , and a band-width of Å that provides a line of sight depth of corresponding to 46.8 Mpc at in the comoving frame. The 90Prime camera consists of a mosaic of four 4k 4k blue sensitive CCDs with a plate scale of 045 per pixel. The detector field-of-view is 0.8 deg2 after accounting for cosmetic defects in two of the CCDs. This wide field-of-view is ideal for our survey as the large area coverage compensates for the narrowness of the filter, producing a survey comparable in volume to the largest intermediate band filter survey (Saito et al., 2006).
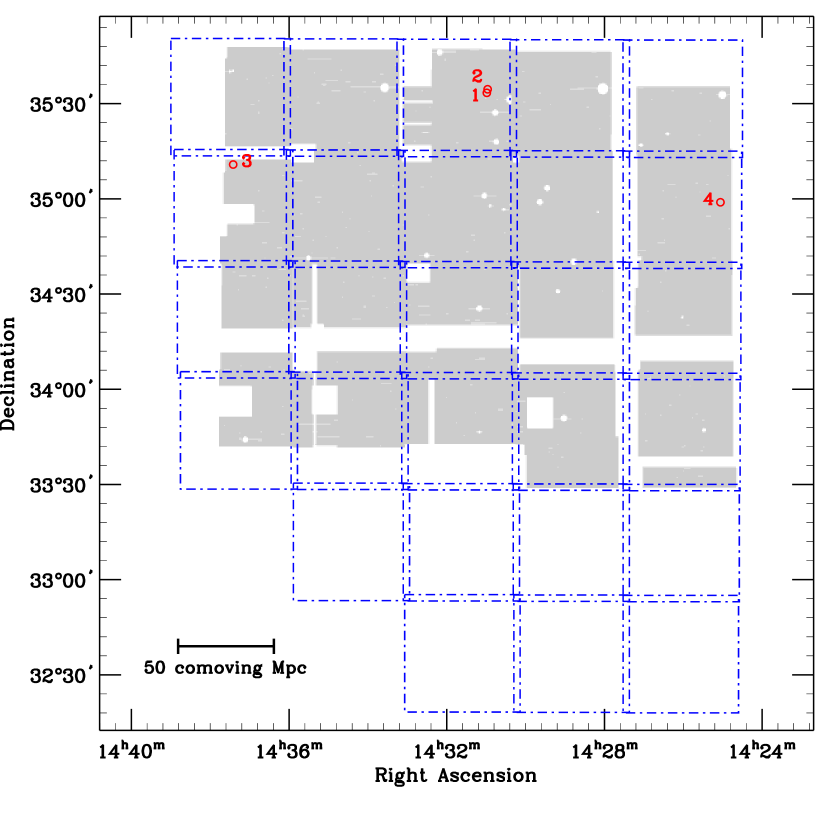
To date, we have finished narrow-band imaging observations with a total sky coverage of 12 deg2 in three fields where extensive ancillary data sets are publicly available: the NOAO Deep Wide Field Survey Boötes and Cetus fields (NDWFS; Jannuzi & Dey, 1999) and the Cosmic Evolution Survey field (COSMOS; Scoville et al., 2007). In this paper, we present the initial results from the survey within the NDWFS Boötes region centered at = 14h 32m 057, = +34° 16′ 475 (J2000). We carried out these observations from April to June 2007 over 16 dark nights. Figure 1 shows our sky coverage overlayed with the NDWFS field layout. After excluding regions with artifacts and bright stars, we achieve a total sky coverage of 4.82 deg2. Although the exposure times range from 6 to 20 hours, all the Ly blobs in our final sample would have been detected even in the shallowest sub-fields (§2.2), suggesting that trading solid angle for depth will improve constraints on the demographics of Ly blobs in future surveys. The sky coverage corresponds to a comoving survey volume of 2.1 Mpc3, which is 16 larger than the area covered by the deepest narrow-band Ly blob survey to date (Matsuda et al., 2004).
We reduce the data with the IRAF mscred mosaic data reduction package (Valdes, 1998). The data are corrected for cross-talk between amplifiers, bias-subtracted, and dark-subtracted. For flat-fielding, we use twilight flats together with night-sky flats, which are median-combined from object frames without the bright stars each night. Satellite trails, CCD edges, bad pixels, and saturated pixels are masked. The astrometry is calibrated with the USNO-B1.0 catalog (Monet et al., 2003) using the IRAF ccmap task. The images are scaled using common stars in each frame and stacked to remove cosmic rays. Finally, the images are transformed into the same world coordinate systems as the NDWFS BW band images, which are resampled with a coarse 90Prime pixel scale (045 pixel-1). We observed 3–5 spectro-photometric standard stars in each night to derive extinction coefficients and zero points for the NB403 magnitudes. The major drawback is the poor seeing, which, in the final combined images, ranges from 15 to 2″ with a median of 17. However, as we discuss in §2.2, the seeing does not impact our ability to identify the blobs with sizes greater than 25 □″.
To identify blob candidates requires that we subtract the continuum emission within the NB403 bandpass. We estimate the continuum using archival, deep, broad-band BW images from the NOAO Deep Wide Field Survey data set (BWRIJK; Jannuzi & Dey, 1999). The wide BW filter ( 4135Å and 1278Å) encompasses our NB403 filter near the central wavelength. The 5- limiting magnitude of the BW images is 26.6 mag for a 2″ diameter aperture. The seeing of the NDWFS BW images ranges from 08 to 147 with a median of 12. A total of 20 NDWFS tiles cover our narrow-band imaging fields as shown Figure 1.
2.2. Selection of Ly Blob Candidates
To find Ly blob candidates, we construct photometric catalogs in the NB403 and BW bands using SExtractor (Bertin & Arnouts, 1996). Because our narrow-band images are much shallower and typically have worse seeing than the broad-band images, we make “detection” images (NB+BW) by adding the NB403 and BW images after scaling them according to their signal-to-noise ratios (S/N). After identifying sources in the “detection” images that have least 5 pixels that are 1.5 above the local sky, we run SExtractor in double-image mode on the NB403 and BW images with these detection images. In other words, we first find the sources in the detection images and then obtain photometry at their position in the NB403 and BW images to make two separate (narrow- and broad-band) catalogs. We adopt Kron-like elliptical aperture magnitudes (i.e., MAG_AUTO in SExtractor) to derive photometric properties. Our use of the “detection” images ensures that 1) all the sources detected in either the NB or BW band are included in our catalog and 2) the elliptical apertures determined by the more extended sources in (NB+BW) are large enough to include all the light from both the NB and BW images. This last point is critical because we do not attempt to match the seeing between the two bands at this stage.
The selection of Ly blob candidates from the NB and BW photometry catalogs consists of two steps: 1) selection for line (hopefully, Ly) emitting objects with large line equivalent widths and 2) selection for spatially extended objects with a larger angular extent in line emission than in the broad-band.
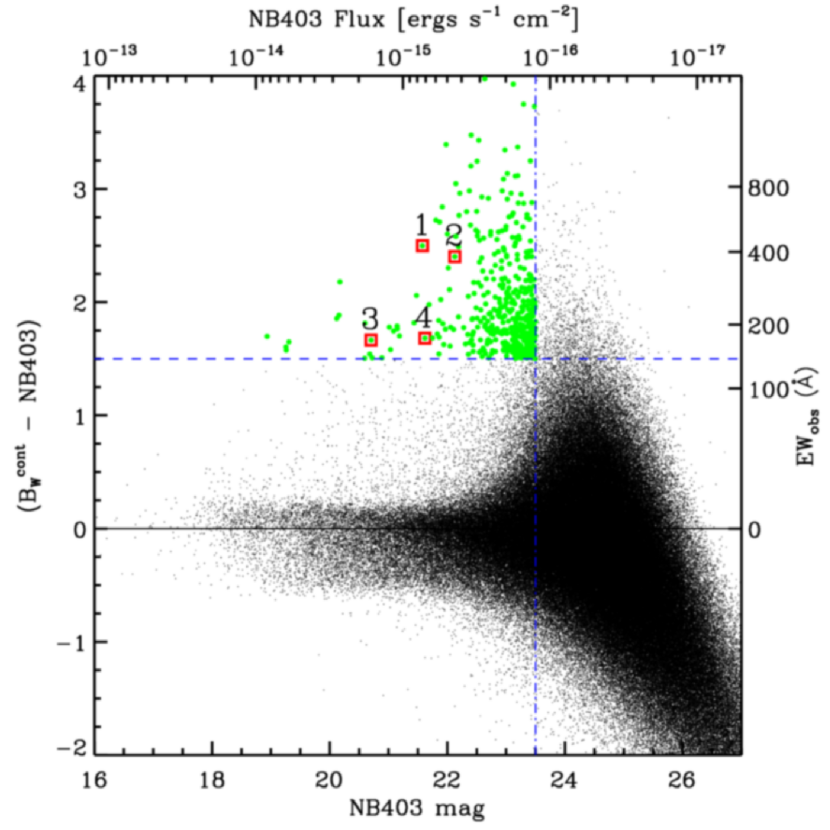
First, we choose candidates by requiring that they are detected above the completeness limits of the NB403 images (NB403 mag).111The completeness limit varies by mag depending on the sub-field due to seeing variations and different exposure times. However, our final blob sample does not depend on the choice of completeness limit because all the blobs are at least 1.5 mag brighter than this cut (§3). We also require that candidates have observed-frame equivalent widths larger than 140Å (Å) corresponding to (vertical and horizontal lines in Fig. 2). Candidates must be extended (SExtractor CLASS_STAR 0.95 in both the NB and BW bands). There are a total of 450 objects over 4.82 deg2 satisfying these criteria. Because most of the Ly blobs (30/35) discovered by Matsuda et al. (2004) have 200Å ( 50Å), our selection criteria would include them if blob properties remain the same between and .
We estimate the continuum flux density, , and continuum-subtracted line flux, , of these objects using the following relations:
| (1) | |||||
where and are the total flux in each filter derived from the BW and NB403 magnitudes, respectively. and represent the band-widths of the BW and NB filters, respectively. Figure 2 shows the (B NB) color excess as a function of NB magnitude for all objects detected in either the NB and BW bands within our survey area. Here, B represents the broad-band continuum magnitude corrected for the emission line: B = .
At our survey redshift, the only possible interlopers are nearby [O II] 3727 emitters at . However, such objects rarely have equivalent widths larger than 100Å in the rest frame (Hogg et al., 1998). Therefore, the contamination of our Ly source catalog by nearby star forming galaxies is expected to be minimal. Even if we reduce our selection limit to 65Å, we end up with the same final Ly blob sample and none of our conclusions in this paper change.
Second, we identify those line-emission selected objects that are more spatially extended in Ly than their continuum counterparts (Fig. 3).222Saito et al. (2006) selected spatially extended objects by requiring the FWHM in their intermediate-band to be larger than that in the broad-band image, but the large seeing difference between our NB403 images (17) and the NDWFS BW images ( 12) prevents us from adopting this approach. We measure the spatial extents of the Ly emission in the continuum-subtracted images. After registering the NB403 and BW images at the sub-pixel level and matching their seeing, we construct continuum-subtracted NB403 images by applying the relations in Eq. (2.2) in 2–D. We measure the isophotal area of the emission region by running SExtractor with a threshold of ergs s-1 cm-2 arcsec-2. This measurement threshold is 2.3 higher than that adopted by Matsuda et al. (2004), but because our survey redshift () is lower than theirs (), we gain a factor of 2.4 in surface brightness. Although this measurement threshold is comparable to the rms noise of the continuum-subtracted NB403 images ( 0.5 – 1 ergs s-1 cm-2 arcsec-2 depending on the field), we are still able to measure the sizes over this measurement limit because the bright central parts of the objects were already detected with high S/Ns.
One of the potential problems in detecting a blob is the contamination of our extended Ly candidate sample by point sources, especially given the poor seeing of the narrow-band images. To quantify this effect, we first place artificial point-sources with a range of luminosities ( = 1042 – 1045 ergs s-1) into the sky regions over the whole NDWFS field and measure their sizes and fluxes in the same manner as for the extended sources. We then determine isophotal area and line luminosity limits above which extended and point sources can be differentiated.
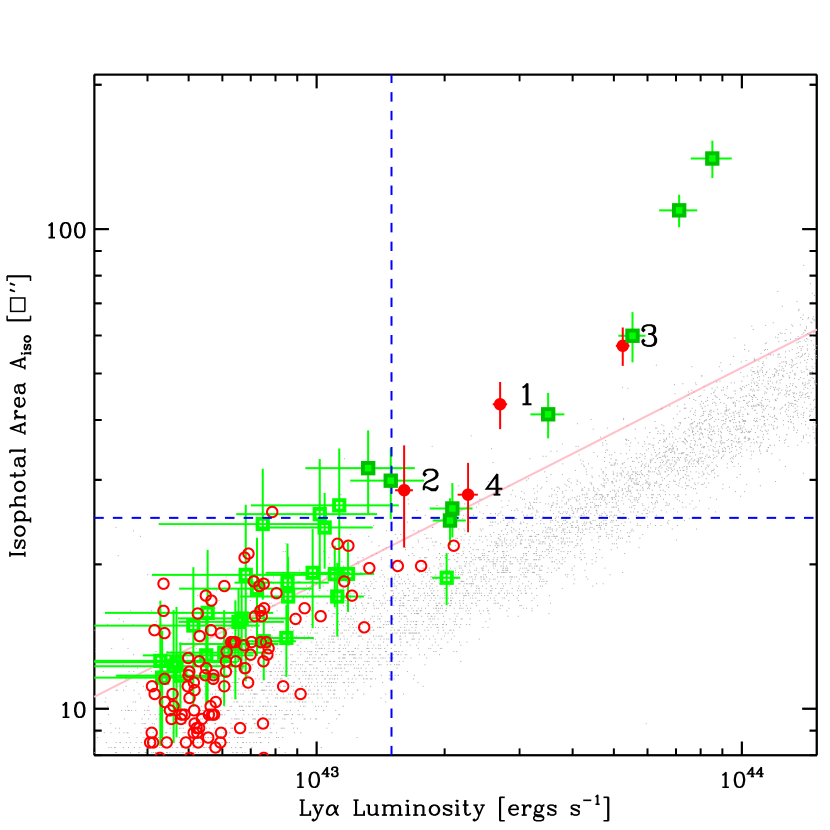
Figure 3 shows the distribution of the angular sizes and line luminosities of the 185 Ly-emitting candidates assuming that they are all located at . The open and filled circles represent the line-emitting objects selected using the line-emission criteria (Fig. 2), and the gray dots show the relation between the sizes and brightnesses for the artificial point sources. As final blob candidates, we select objects with isophotal areas larger than 25 □″ and line luminosities brighter than ergs s-1. Below these limits, extended and point sources mix, and the sizes of blobs cannot be measured reliably as explained below.
Because the chosen isophotal threshold is comparable to the rms sky noise, we test how reliably we can measure the spatial extent of the blob candidates. We cut out a small (5151 pixels) section around each blob candidate from the (NB BW) image, filter it with a smoothing kernel,333We use a 33 pixel convolution mask with a FWHM = 2 pixel, which is a default kernel in SExtractor. place each postage stamp into 300 – 1000 empty sky regions in each of the 20 NDWFS sub-fields in Figure 1, and extract the sources with SExtractor in the same way as for the real data. Then we check how often and accurately their sizes are recovered from these simulated images. This procedure tests how the detectability of a given blob candidate changes across the fields due to the seeing and exposure time variations.
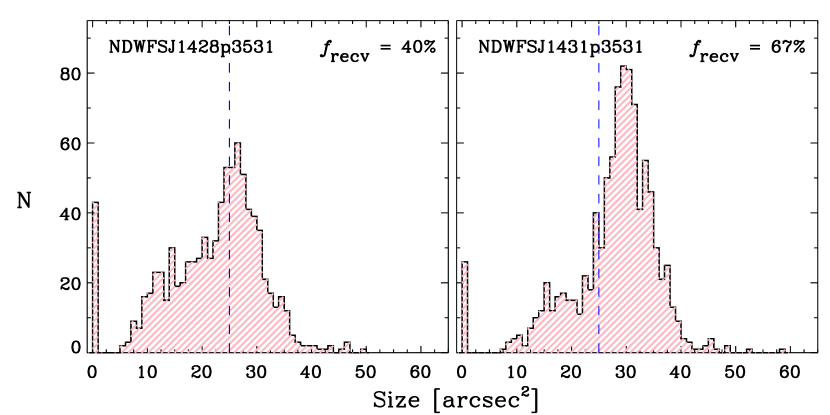
Figure 4 shows an example of this recovery test for the faintest blob in our final sample (blob 2, see §3). We show the distribution of the recovered isophotal sizes of the artificial blob for two sub-fields. While most (95%) of time, the artificial blob is detected, its size is measured with a large spread because of non-uniform sky background noise. We adopt this spread of the recovered size distributions as the error in the blob size, .
A recovery fraction of a blob () in a sub-field is defined as the fraction of time that the artificial blob is recovered with a size larger than 25 □″. These recovery fractions are averaged over the whole field to obtain the final recovery fraction of the blob for this survey. The size error becomes comparable to the measured size below our sample selection criteria and the recovery fraction drops from 90% to 50% at the selection boundary for the brightest blob candidates. The recovery fractions are used to correct the incompleteness of our survey in calculating the blob number density in §3.3.
3. Results and Discussion
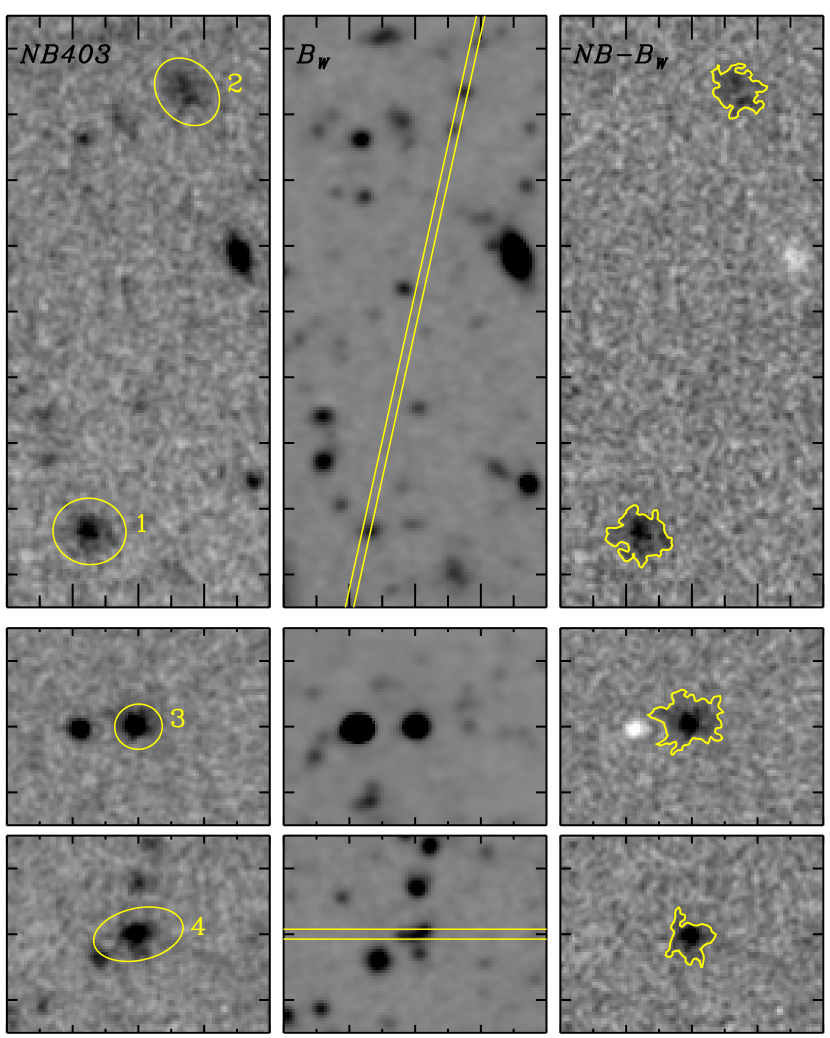
The selection criteria, 140Å, 25 □″, and 1.5 ergs s-1, yield four extended Ly candidates at with sizes of 28 – 57 □″, Ly luminosities of 1.6 – 5.3 1043 ergs s-1, and of 170 – 420Å (Table 1). Figure 5 shows the NB403, BW, and continuum-subtracted (NBBW) images for these candidates. Except for Blob 4, which appears to have more than two continuum counterparts, we are able to identify single host galaxies in the BW bands for the other three blob candidates. Although these continuum sources are barely resolved in BW, the line-emission regions are extended over 5–10″ in the (NB BW) images. It is noteworthy that all four blob candidates have obvious continuum counterparts in the deep broadband images. To date, all Ly blobs at , except the blob discovered by Nilsson et al. (2006), have continuum counterparts within the extended emission or nearby. We also show the locations of the blob candidates on the sky in Figure 1. Because blobs 1 and 2 are separated by only 70″ ( 550 physical kpc at ), they are shown in the same panel in Figure 5.
3.1. Spectroscopic Confirmation
We spectroscopically confirm the redshifts of all four blob candidates using spectra taken with the 6.5m “Multiple Mirror” Telescope (MMT) Blue Channel Spectrograph and an existing optical spectrum from the AGN and Galaxy Evolution Survey (AGES; Kochanek et al. in prep., Cool et al., 2006). For blobs 1, 2 and 4, we obtained low-resolution long-slit spectra on UT 2008 February 13, April 29, and June 7. We used the 500 gpm grating with a 15 180″ slit, which provides a dispersion of 1.2Å per pixel and a spectral resolution of 5.4Å over the wavelength range 3400 – 6400Å (1000 – 1900Å in the rest frame). Because blobs 1 and 2 are separated by only 70″, we observed them simultaneously for a total of 6 hours with the slit position (P.A. = 12.1°) shown in Figure 5. Blob 4 is the most ambiguous object in our sample as its continuum counterpart is not clear due to the blending in the BW image. Therefore, we put a slit at P.A. = 90.0° to include all the continuum components seen in the BW band images. The spectra were reduced, extracted, and flux-calibrated in the standard manner with IRAF.
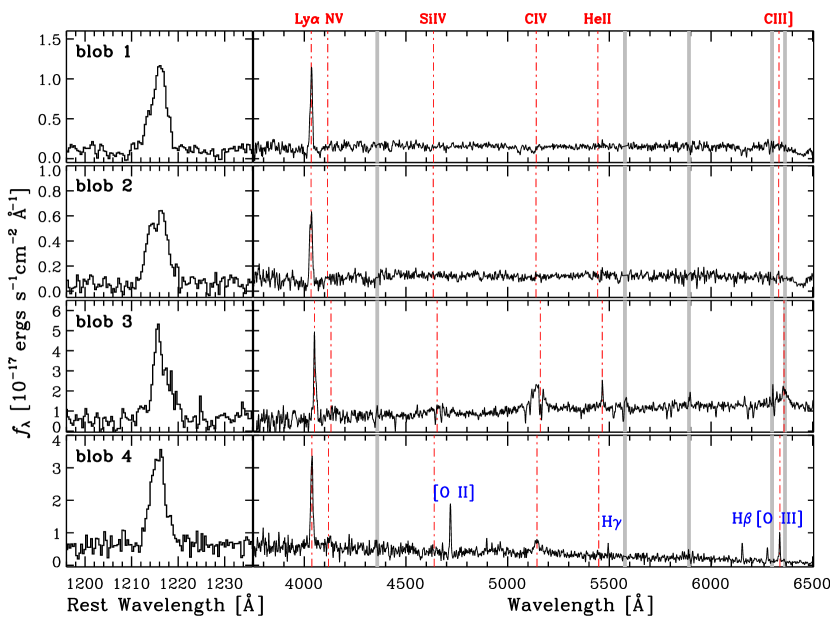
The MMT spectra confirm that blobs 1, 2 and 4 are indeed Ly blobs. We show the extracted spectra of these three blobs in Figure 6. In each case, there is an emission line at 4030Å, which agrees well with the central wavelength of the NB403 filter. For blobs 1 and 2, there are no other emission lines over the entire wavelength range, which covers the redshifted [O II] 3727, H 4868, and [O III] 5007 lines from any star-forming galaxies. The Ly lines have large velocity widths of 900 and 1250 km s-1, and observed-frame equivalent widths of 150Å and 190Å, respectively. The broad line profile and the absence of other emission features in blobs 1 and 2 indicate that the emission line is Ly. The stellar continuum of blobs 1 and 2 bears a strong resemblance to the UV spectra of Lyman break galaxies (e.g., Shapley et al., 2003). Notably, there is no evidence of broad emission at the wavelengths of Si IV and C IV, so the presence of an unobscured AGN is ruled out with confidence. A detailed analysis of the continuum and spectral features of these blobs will be presented in a future paper. For blob 4, we identify two continuum sources, an [O II] emitter at and a QSO that produces broad Ly and C IV lines at . The Ly line has a velocity width of 950 km s-1 and an observed-frame equivalent width of 85Å. Note that the EWs measured from the long-slit spectra are lower than those estimated from the narrow-band imaging due to slit-loss.
For blob 3, we obtain a spectrum from AGES, which has extensive optical spectroscopy for all the X-ray detected galaxies with IAB 22.0 mag in the Boötes field. This spectrum shows that blob 3 is at and contains a QSO with strong, broad Ly emission (Figure 6). Blob 3 is perhaps similar to the diffuse Ly halos associated with some QSOs (e.g., Bunker et al., 2003; Weidinger et al., 2005).
3.2. Multi-Wavelength Properties of Confirmed Ly Blobs
Are any of the four blobs associated with strong radio or X-ray sources? None is detected in the VLA FIRST survey (White et al., 1997) at 1.4 GHz at the detection limit of 1 mJy. Assuming a power-law spectral energy distribution of , this limit corresponds to a rest-frame 1.4 GHz luminosity density of 3.2 ergs s-1Hz-1, which is two orders of magnitude fainter than the powerful radio galaxies associated with Ly halos (e.g., Reuland et al., 2003). However, in X-rays, the properties of these blobs vary wildly. Blobs 3 and 4, whose optical spectra have broad QSO lines, are detected in the Chandra XBoötes survey (Kenter et al., 2005; Brand et al., 2006) with (2–7 keV) = 1.6 – 4.1 10ergs s-1. Blobs 1 and 2 are not detected at a similar depth and have upper limits of (2–7 keV) 0.63 and 0.18 10ergs s-1, respectively. Therefore, at least two of the blobs (50%) are associated with AGN. Table 1 lists the optical and X-ray properties of the four blobs.
It is unknown what powers the copious Ly emission of blobs. Previous observational studies suggest diverse mechanisms, e.g., a central AGN (Dey et al., 2005), galactic superwind (e.g., Wilman et al., 2005), extended star formation (Matsuda et al., 2007), and cooling radiation (Nilsson et al., 2006; Smith & Jarvis, 2007; Smith et al., 2008), yet there is no smoking gun. Due to its blind strategy, large volume, follow-up optical spectroscopy, and overlap with wide Chandra X-ray imaging coverage, our work here is the first to place unbiased limits on the fraction of blobs with luminous AGN (50%). The diversity of the blob optical and X-ray properties is also interesting, suggesting that AGN like those detected in half the blobs are not necessary to power the others.
3.3. Rarity of Ly Blobs
Our survey indicates that extended Ly nebulae are extremely rare at a redshift of . Based on the completeness (recovery) test in §2.2, we estimate the number of Ly blobs within the survey volume as , where is the recovery fraction (Table 1). The discovery of only four Ly blobs over 4.82 deg2 yields a number density of 10-6 Mpc-3 for blobs with and ergs s-1. Note that this number density is comparable to those of galaxy clusters in the nearby and high- Universe, Mpc-3(e.g., Bahcall et al., 2003; Papovich, 2008). Because our survey fails to find blobs as bright ( ergs s-1) and large ( □″) as the brightest and largest in the Steidel et al. (2000) sample (their Blobs 1 and 2), we conclude that the Steidel et al. (2000) blobs are even rarer objects with a number density of 0.5 10-6 Mpc-3.
To compare our blob number density with those from previous surveys (Matsuda et al., 2004; Saito et al., 2006), we determine how many of the Matsuda et al. (2004) blobs would be detected in our survey if they were located at . Using the continuum subtracted NBcorr images of the 35 blobs from Matsuda et al. (2004), we scale the blob surface brightnesses and sizes to according to the adopted cosmology and assuming that their physical sizes and Ly luminosities do not change from to . These images are convolved with Gaussian kernels to match our poor seeing, rebinned to the 90Prime pixel scale, and given Poisson noise. We do not account for the difference between the filter (NB403 vs. NB497) band-widths, because the resolving power of two filters is similar. We place the simulated images into our continuum-subtracted NB403 images and measure their sizes and luminosities in the same way as described in §2.2. We repeat this process 500–1000 times to derive the range of recovered luminosities and sizes.
We show the distribution of sizes and Ly luminosities ( – ) in Figure 3. Based on this test, we expect that 6 – 8 of the 35 Matsuda et al. (2004) blobs444In the detectability simulation, the average values of extracted and for six Matsuda et al. (2004) blobs (their LAB 1, 2, 3, 4, 8, 10) satisfy our selection criteria. Two other blobs (their LAB 6 and 15) are located on our selection boundary, but satisfy the selection criteria more than 50% of the time in the simulation. are detectable given our luminosity-size criteria, yielding an effective blob number density of 4.6–6.2 10-5 Mpc-3. Considering the recovery rate of each Matsuda blob, which is 100% for (Ly) 5 1043 and drops to 50% at our selection boundary, we expect to detect on average 6.0 of their blobs with our survey criteria. Once we factor in the difference between our survey volume and Matsuda et al.’s, we should have detected 98 blobs — not four — provided that the blob number density at and , and between the two survey fields, is the same.
The comparison of our results with those of Saito et al. (2006) is more difficult because we do not have high S/N measurements of their blob surface brightness profiles. Therefore, we estimate the blob number density for (Ly) 1.5 ergs s-1 from the brightest bin in their Figure 13. We consider the resulting number density of 6.7 10-6 Mpc-3 an upper limit at –5, given that some fraction of their blobs might not have been detected with our survey criteria.
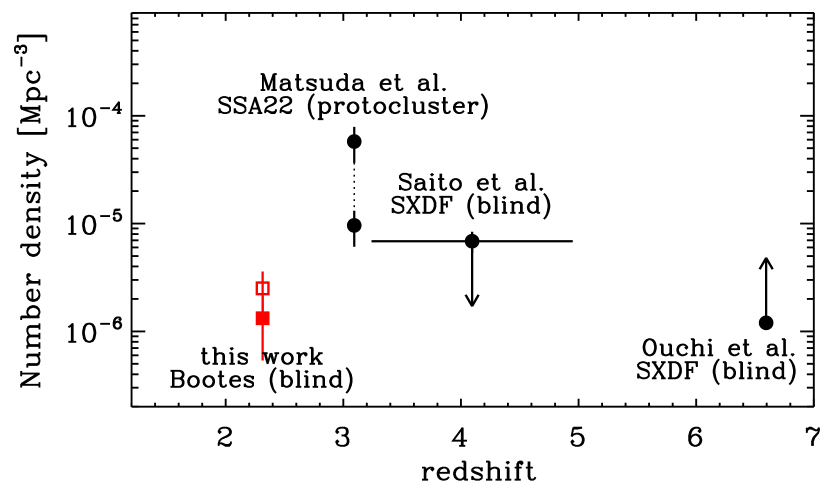
We show the number density of Ly blobs from the different samples and at different redshifts in Figure 7 after applying the same luminosity–size limits as our survey. Open and filled squares represent the number density estimates from our survey with and without the two X-ray detected blobs. For the Matsuda et al. sample, we show both the measured number density and that scaled down to compensate for the known over-density of the SSA22 field ( 6; Steidel et al., 2000). For Saito et al.’s survey, we show the upper-limit discussed above and the redshift range (horizontal error bar). We also show a lower limit on the number density at derived from the recent discovery of a Ly blob in the Subaru/XMM-Newton Deep Survey field (Ouchi et al., 2008).
At face value, Ly blobs within the proto-cluster from the Matsuda et al. (2004) survey are 20 – 30 times more numerous than blobs in our blind field survey. Even if we account for the galaxy over-density in the proto-cluster, the blob number density in our survey is still by a factor of 3 lower, suggesting that extended Ly emission is closely related to (or enhanced by) a clustered environment. However, we cannot rule out that this discrepancy might reflect real evolution between and .
3.4. A Close Pair of Ly Blobs
One of our most interesting results is the discovery of the pair of blobs (1 and 2) separated by only 70″, which corresponds to 550 physical kpc at . To estimate how unlikely it is to find two blobs within 70″ of each other, we calculate the expected number of galaxy pairs assuming that the spatial distribution of Ly blobs can be represented by a two-point correlation function, , where is the scale length of galaxy clustering at the redshift . By projecting this correlation function onto the sky (Limber, 1953), we derive the angular correlation function , which measures the excess probability above random of finding a galaxy at an angle from another galaxy. For a given power-law correlation function, one can derive (Peebles, 1980; Efstathiou et al., 1991) such that
| (2) |
where is comoving distance at , is the number of galaxies per unit redshift interval, is the Hubble parameter at , and . We adopt as a top-hat function for our survey redshift interval and assume a fiducial value of .
From this angular correlation function, we estimate the number of galaxy pairs within using:
| (3) |
where is the survey area, and is the number of blobs found in our survey. For the typical galaxy correlation length, 7 Mpc in the comoving frame (e.g., Maddox et al., 1990), we predict a negligible pair count, 0.005. The expected number of close pairs does not increase dramatically as the correlation length increases. Even for the correlation length of the richest galaxy clusters, 30 Mpc (e.g., Bahcall et al., 2003; Papovich, 2008) for redshifts out to , only 0.05 pairs are expected. Therefore, we conclude that the observed close pair of Ly blobs is unlikely to occur for a reasonable range of clustering strengths if we assume that the two Ly blobs belong to individual dark matter halos.
Increasing the size of our blob sample (Yang et al. 2008, in prep.) will better constrain the clustering of Ly blobs. For the time being, it is intriguing that we do discover a close pair. Our MMT spectra confirm that the two blobs have almost the same redshifts within 0.001 and a corresponding line-of-sight separation of 360 physical kpc assuming no peculiar velocity. The similarity of their redshifts, as well as their small separation on the sky (corresponding to 550 physical kpc), leads us to speculate that these two blobs might lie within a single dark matter halo, i.e., within a massive proto-group or cluster of galaxies. Note that the analytic CDM model predicts a virial radius () of 430 kpc at for a dark matter halo with a mass of (Mo & White, 2002). Previous studies also suggest that Ly blobs are phenomena that favor dense environments (Matsuda et al., 2005; Prescott et al., 2008). This hypothesis could be tested by using a deeper narrow-band imaging survey to characterize the environment of this blob pair with the spatial distribution of fainter, smaller blobs and/or faint, compact Ly emitters.
4. Conclusion
In this paper, we present initial results from our blind, wide-field, narrow-band imaging survey in the NOAO Deep Wide Field Survey Boötes field to constrain the number density, environment, and multi-wavelength properties of extended Ly nebulae (“Ly blobs”) at . After searching over 4.82 deg2, we discover four Ly blobs with = 1.6 – 5.3 ergs s-1, isophotal areas of 28 – 57 □″, and broad Ly line profiles ( = 900 – 1250 km s-1). We confirm the redshifts of all four blobs spectroscopically. In contrast with the extended Ly halos associated with high- radio galaxies, none of our four blobs are radio-loud. The X-ray luminosities and optical spectra of these blobs are diverse. Two blobs (3 and 4) are X-ray-detected with (27 keV) = 2–4 ergs s-1 and have broad optical emission lines (C IV and C III]) characteristic of AGN, implying that 50% of our sample blobs are associated with strong AGN. The other 50% of blobs (1 and 2) are not X-ray or optically-detected as AGN down to similar limits, suggesting that AGN like those in blobs 3 and 4 are not necessary to power them. The number density of the four blobs is 3 10-6 Mpc-3, comparable to that of galaxy clusters at similar redshifts and lower than that found in the SSA22 proto-cluster at , even after accounting for the over-density of that region. The two X-ray undetected blobs (1 and 2) are separated by only 70″ (550 physical kpc) and have almost identical redshifts (corresponding to 360 physical kpc along the line-of-sight), suggesting that they are part of the same system. Given the rarity of the blobs and our discovery of a close pair, we speculate that blobs occupy the highest density regions and thus may be precursors of today’s rich cluster galaxies.
References
- Bahcall et al. (2003) Bahcall, N. A., Dong, F., Hao, L., Bode, P., Annis, J., Gunn, J. E., & Schneider, D. P. 2003, ApJ, 599, 814
- Bertin & Arnouts (1996) Bertin, E., & Arnouts, S. 1996, A&AS, 117, 393
- Brand et al. (2006) Brand, K., et al. 2006, ApJ, 641, 140
- Bunker et al. (2003) Bunker, A., Smith, J., Spinrad, H., Stern, D., & Warren, S. 2003, Ap&SS, 284, 357
- Cool et al. (2006) Cool, R. J., et al. 2006, AJ, 132, 823
- Dey et al. (2005) Dey, A., et al. 2005, ApJ, 629, 654
- Dijkstra et al. (2006) Dijkstra, M., Haiman, Z., & Spaans, M. 2006, ApJ, 649, 37
- Efstathiou et al. (1991) Efstathiou, G., Bernstein, G., Tyson, J. A., Katz, N., & Guhathakurta, P. 1991, ApJ, 380, L47
- Fardal et al. (2001) Fardal, M. A., Katz, N., Gardner, J. P., Hernquist, L., Weinberg, D. H., & Davé, R. 2001, ApJ, 562, 605
- Francis et al. (2001) Francis, P. J., et al. 2001, ApJ, 554, 1001
- Haiman & Rees (2001) Haiman, Z., & Rees, M. J. 2001, ApJ, 556, 87
- Haiman, Spaans, & Quataert (2000) Haiman, Z., Spaans, M., & Quataert, E. 2000, ApJ, 537, L5
- Hogg et al. (1998) Hogg, D. W., Cohen, J. G., Blandford, R., & Pahre, M. A. 1998, ApJ, 504, 622
- Jannuzi & Dey (1999) Jannuzi, B. T., & Dey, A. 1999, Photometric Redshifts and the Detection of High Redshift Galaxies, 191, 111
- Keel et al. (1999) Keel, W. C., Cohen, S. H., Windhorst, R. A., & Waddington, I. 1999, AJ, 118, 2547
- Kenter et al. (2005) Kenter, A., et al. 2005, ApJS, 161, 9
- Limber (1953) Limber, D. N. 1953, ApJ, 117, 134
- Maddox et al. (1990) Maddox, S. J., Efstathiou, G., Sutherland, W. J., & Loveday, J. 1990, MNRAS, 242, 43P
- Matsuda et al. (2004) Matsuda, Y., et al. 2004, AJ, 128, 569
- Matsuda et al. (2005) Matsuda, Y., et al. 2005, ApJ, 634, L125
- Matsuda et al. (2007) Matsuda, Y., Iono, D., Ohta, K., Yamada, T., Kawabe, R., Hayashino, T., Peck, A. B., & Petitpas, G. R. 2007, ApJ, 667, 667
- Mo & White (2002) Mo, H. J., & White, S. D. M. 2002, MNRAS, 336, 112
- Monet et al. (2003) Monet, D. G., et al. 2003, AJ, 125, 984
- Nilsson et al. (2006) Nilsson, K. K., Fynbo, J. P. U., Møller, P., Sommer-Larsen, J., & Ledoux, C. 2006, A&A, 452, L23
- Oke (1974) Oke, J. B. 1974, ApJS, 27, 21
- Ouchi et al. (2008) Ouchi, M., et al. 2008, ArXiv e-prints, 807, arXiv:0807.4174
- Palunas et al. (2004) Palunas, P., Teplitz, H. I., Francis, P. J., Williger, G. M., & Woodgate, B. E. 2004, ApJ, 602, 545
- Papovich (2008) Papovich, C. 2008, ApJ, 676, 206
- Peebles (1980) Peebles, P. J. E. 1980, The Large-Scale Structure of the Universe, (Princeton: Princeton University Press)
- Prescott et al. (2008) Prescott, M. K. M., Kashikawa, N., Dey, A., & Matsuda, Y. 2008, ArXiv e-prints, 803, arXiv:0803.4230
- Reuland et al. (2003) Reuland, M., et al. 2003, ApJ, 592, 755
- Saito et al. (2006) Saito, T., Shimasaku, K., Okamura, S., Ouchi, M., Akiyama, M., & Yoshida, M. 2006, ApJ, 648, 54
- Scoville et al. (2007) Scoville, N., et al. 2007, ApJS, 172, 1
- Shapley et al. (2003) Shapley, A. E., Steidel, C. C., Pettini, M., & Adelberger, K. L. 2003, ApJ, 588, 65
- Smith et al. (2008) Smith, D. J. B., Jarvis, M. J., Lacy, M., & Martínez-Sansigre, A. 2008, ArXiv e-prints, 806, arXiv:0806.4384
- Smith & Jarvis (2007) Smith, D. J. B., & Jarvis, M. J. 2007, MNRAS, 378, L49
- Steidel et al. (2000) Steidel, C. C., Adelberger, K. L., Shapley, A. E., Pettini, M., Dickinson, M., & Giavalisco, M. 2000, ApJ, 532, 170
- Taniguchi & Shioya (2000) Taniguchi, Y. & Shioya, Y. 2000, ApJ, 532, L13
- Valdes (1998) Valdes, F. G. 1998, Astronomical Data Analysis Software and Systems VII, 145, 53
- Verhamme et al. (2006) Verhamme, A., Schaerer, D., & Maselli, A. 2006, A&A, 460, 397
- Weidinger et al. (2005) Weidinger, M., Møller, P., Fynbo, J. P. U., & Thomsen, B. 2005, A&A, 436, 825
- White et al. (1997) White, R. L., Becker, R. H., Helfand, D. J., & Gregg, M. D. 1997, ApJ, 475, 479
- Williams et al. (2004) Williams, G. G., Olszewski, E., Lesser, M. P., & Burge, J. H. 2004, Proc. SPIE, 5492, 787
- Wilman et al. (2005) Wilman, R. J., Gerssen, J., Bower, R. G., Morris, S. L., Bacon, R., de Zeeuw, P. T., & Davies, R. L. 2005, Nature, 436, 227
- Yang et al. (2006) Yang, Y., Zabludoff, A. I., Davé, R., Eisenstein, D. J., Pinto, P. A., Katz, N., Weinberg, D. H., & Barton, E. J. 2006, ApJ, 640, 539
| ID | R.A. | Dec. | (Ly) | Size |
(2-7keV)aaX-ray luminosities are derived from the observed flux
in the 0.5–2 keV band assuming a power-law spectrum with
and a Galactic absorption .
|
NDWFS Name | NDWFS magnitudesbbVega magnitudes from the NDWFS DR3 catalog.
|
||||||
|---|---|---|---|---|---|---|---|---|---|---|---|---|---|
| (J2000) | (J2000) | (ergs s-1) | (□″) | (Å) | (ergs s-1) | Bw | R | I | K | ||||
| Blob 1 | 14 30 59.0 | +35 33 24.7 | 2.3186 | 2.70 0.10 | 43 4.8 | 0.93 | 422 20.8 |
0.63ccThe upper limits are derived from the combined Chandra
ACIS-I images (Obs-ID 3608,6993).
|
NDWFS J143059.0+353324 | 23.63 | 22.91 | 22.69 | |
| Blob 2 | 14 30 57.8 | +35 34 31.6 | 2.3178 | 1.61 0.08 | 29 6.9 | 0.57 | 383 22.2 |
0.18ccThe upper limits are derived from the combined Chandra
ACIS-I images (Obs-ID 3608,6993).
|
NDWFS J143057.8+353431 | 24.05 | 22.92 | 22.53 | |
| Blob 3 | 14 37 25.1 | +35 10 48.8 | 2.3321 | 5.25 0.19 | 57 5.2 | 0.97 | 171 7.3 | 4.11 1.86 | NDWFS J143725.0+351048 | 22.11 | 20.67 | 19.93 | 16.74 |
| Blob 4 | 14 25 03.5 | +34 58 55.1 | 2.3211 | 2.27 0.12 | 28 4.6 | 0.67 | 174 10.4 | 1.63 1.40 | NDWFS J142503.4+345854ddIt is not clear which of two galaxies is associated
with the blob 4 and the X-ray source.
|
23.06 | 23.70 | 22.13 | |
| NDWFS J142503.3+345855ddIt is not clear which of two galaxies is associated
with the blob 4 and the X-ray source.
|
23.66 | 23.24 | |||||||||||