NEAR-INFRARED IMAGING POLARIMETRY OF S106 CLUSTER-FORMING REGION WITH SIRPOL
Abstract
We present the results of wide-field polarimetry toward the H II region S106 using the IRSF (Infrared Survey Facility) telescope. Our polarimetry data revealed an extended (up to ) polarized nebula over S106. We confirmed the position of the illuminating source of most of the nebula as consistent with S106 IRS 4 through an analysis of polarization vectors. The bright portion of the polarized intensity is consistent with the red wing component of the molecular gas. Diffuse polarized intensity emission is distributed along the north–south molecular gas lanes. We found the interaction region between the radiation from S106 IRS 4 and the dense gas. In addition, we also discovered two small polarization nebulae, SIRN 1 and SIRN 2, associated with a young stellar objects (YSO). Aperture polarimetry of point-like sources in this region was carried out for the first time. The regional magnetic field structures were derived using point-like source aperture polarimetry, and the magnetic field structure position angle around the cluster region in S106 was found to be . The magnetic fields in the cluster region, however, have three type position angles: , , and . The present magnetic field structures are consistent with results obtained by submillimeter continuum observations. We found that the magnetic field direction in the dense gas region is not consistent with that of the low density gas region.
1 Introduction
Sharpless 106 (S106, Sh-2-106, or G 76.4-0.6) in Cygnus is a massive star-forming region associated with a bright bipolar nebula and a H II region (Sharpless 1959). The first near-infrared observations of S106 were reported by Sibille et al. (1975), who found a near-infrared source and suggested that it could be the exciting star of the H II region S106. A bright infrared source, IRS 4 (Gehrz et al. 1982), rests at the center of the bipolar structure, also designated as S106 IR (Sibille et al. 1982), IRS 3 (Pipher et al. 1976), or PS (Felli et al. 1984). The spectral type and luminosity of S106 IRS 4 are estimated to be O8.5–O7 and –, respectively (Eiroa et al. 1979; Harvey et al. 1982; Mozurkewich et al. 1986; Martins et al. 2005). Submillimeter continuum observations revealed a bright FIR source, referred to as S106 FIR, located to the west of S106 IRS 4 (Richer et al. 1993). S106 FIR has been explained as a heavily embedded, luminous class 0 young stellar object (YSO), as this source was not detected at 20 (Gehrz et al. 1982; Richer et al. 1993). In addition, Hodapp & Rayner (1991) detected a cluster of 160 stars within the central 0.3 pc radius of -band ( mag) imaging observations. Oasa et al. (2006) detected 600 embedded YSO candidates with near-infrared excesses within using the Subaru Telescope survey.
The distance to S106 has been estimated as 0.5 – 1.8 kpc by various methods. The distance estimated by a photometric study based on photometry of field stars is pc (Staude et al. 1982). However, that study essentially measured the distance to the first dust cloud in the direction of S106, not necessarily the distance to the object itself. Recently, comparison between MSX mid-infrared images and CO molecular line data (Schneider et al. 2007) determined that the molecular cloud associated with S106 is a part of the Cygnus X molecular clouds and directly influenced by the UV radiation from Cyg OB1. The distance of this cluster has been estimated to be 1.25 – 1.83 kpc (Uyaniker et al. 2001), implying that S106 lies at the same distance. They suggested that the obscuration leading to the closer photometric distance estimate is due to a tenuous foreground molecular cloud unrelated to S106. We use the rough average value of the obtained distances of kpc as the distance to S106.
The molecular cloud in which S106 is embedded was found by Lucas et al. (1978). The total mass of the cloud was estimated to be – at a distance of 1.7 kpc (Bally & Scoville 1982; Schneider et al. 2007). The cloud is rotating around an axis at a position angle of , i.e., with the rotation axis in roughly the same orientation as the polar axis of the S106 bipolar nebula. In addition, the southern lobe of S106 is brighter than the northern lobe in the optical, although their radio fluxes are comparable (Bally et al. 1983; Felli et al. 1984). This suggests that the northern lobe is more deeply embedded in the cloud and that the axis of the lobes is inclined with the northern lobe away from the observer.
The magnetic field in S106 was studied with optical polarimetry and linearly polarized thermal emission from aligned dust grains. Aperture polarimetry of 12 stars inside or near the bright nebula S106 within field of view was conducted by Hodapp & Rayner (1991) using -band images. The polarization degree and polarization angle are estimated to be 0.65 – 11.8% and 20 – , respectively. In addition, Vallée & Fiege (2005) studied the magnetic field within or near the bright nebula S106 based on the 850 continuum observations. They revealed that the magnetic field in the warm dense gas of the bipolar nebula away from the central dust lane appears roughly parallel along the bipolar nebula polar axis, but the magnetic field in the central dust lane appears horizontal and elongated along the lane. Note that the fields of view in these maps were too small () to reveal the magnetic field structure across the entire S106 cloud. Polarized emission in S106 was studied with K-band polarimetry. Although Aspin et al. (1990) and McLean et al. (1987) revealed that the polarization vector pattern is centrosymmetric about S106 IRS 4, the result obtained by Aspin et al. (1990) has a small field of view, though a high resolution (); the result obtained by McLean et al. (1987) has a large field of view () but a low resolution ().
In this paper, we present polarization images of the H II region S106, part of our ongoing project of polarimetry of star-forming regions. Our observations were sufficiently deep ( = mag at S/N = 10) and wide (), and of sufficiently high resolution (), covering a large extent of S106. Our wide-field polarization images can reveal large-scale infrared reflection nebulae (IRNe) and delineate the magnetic field structure through measurements of point source polarizations.
2 Observations and Data Reduction
The observations of S106 were carried out on 2006 June 15 with the imaging polarimeter SIRPOL, the polarimetry mode of the SIRIUS camera (Simultaneous-3color Infrared Imager Unbiase Survey : Nagashima et al. 1999; Nagayama et al. 2003) for Kandori et al. (2006), on the 1.4 m telescope IRSF at the South Africa Astronomical Observatory (SAAO). SIRPOL is composed of an achromatic (1–2.5 ) wave plate rotator and a high extinction ratio wiregrid analyzer unit located on the upstream side of the -simultaneous imaging camera SIRIUS. The imaging scale of the array is pixel-1, giving a field of view of .
The polarization was measured by stepping the half-wave plate to four angular positions (, , , ). We made 10-s exposures per wave plate position at 10 dithered positions (1 set), and we repeated the same set four times for each object. Sky frames were taken using the same method. The total integrated time was 400 s per wave plate angle. The typical seeing during the observations was (3.7 pixels) at .
We reduced the observed data using standard infrared image reduction method (flat-field correction, median sky subtraction, and frame registration). Stokes parameters were obtained using /2, , and . The degree of polarization, , and the polarization angle, , were estimated using and , respectively. Since the polarization degree, , is a positive quantity, the polarization degree would be overestimated by the error in . Therefore, we calculated the debiased polarization degree, , to remove the effect of the error using , where is the error in (Wardle & Kronberg 1974). Hereafter, we regard the debiased polarization degree as the polarization degree. We calibrated the sky level using 2MASS111The Two Micron All Sky Survey (2MASS) is a joint project of the University of Massachusetts and the Infrared Processing and Analysis Center/California Institute of Technology, funded by the National Aeronautics and Space Administration and the National Science Foundation (http://pegasus.phast.umass.edu). images covering a much larger field of view. The 10 limiting magnitudes for the surface brightness of were 19.2, 18.9, and 18.0 mag arcsec-2 for , , and , respectively.
For source detection and photometry on the Stokes I image, we used the IRAF222IRAF is distributed by the US National Optical Astronomy Observatories, which are operated by the Association of Universities of Research in Astronomy, Inc., under cooperative agreement with the National Science Foundation. DAOPHOT package (Stetson 1987). We detected stars with a peak intensity greater than 5 above the local background and measured the instrumental magnitudes of the stars using aperture photometry with an aperture radius of 3.7 pixels. The number of stars detected with a photometric error of less than 0.1 mag were 627, 1228, and 1376, respectively. In addition, 583 stars were detected in all three bands. The limiting magnitudes in this case were 18.0, 17.5, and 16.5 mag, respectively. Next, we performed a photometric calibration using the 2MASS point source catalog. The magnitude and color of our photometry were transformed into the 2MASS system using
| (1) |
| (2) |
where the coefficients are , , and for , , and , respectively. The coefficients are and for and , respectively. Note that the coefficients and include both the zero point and aperture correction.
3 Results
3.1 Large-Scale Intensity and Polarized Properties in S106
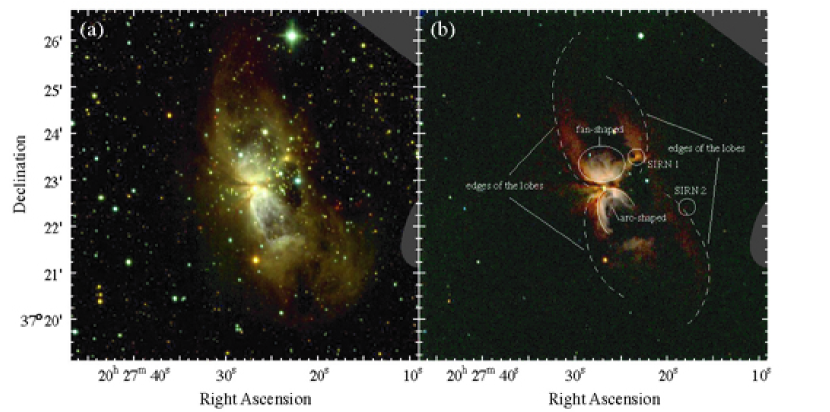
Although a high-resolution () intensity image of S106 taken with Subaru was reported previously (Oasa et al. 2006), no wide-field polarimetry observations toward S106 have been performed. Our observations with SIRPOL revealed the near-infrared polarization distribution in S106 for the first time. Figures 1a and 1b show the color-composite intensity (Stokes ) image and the color-composite polarized intensity () image, respectively.
In Figure 1a, the diffuse emission of the northern and southern lobes are extended more than the field of view of the Subaru images, and Figure 1b shows the first characteristic polarization nebulosity over the S106 region. Ridges of polarized intensity exist on the eastern and western edges of nebula S106. In addition, the southern edge of the southern lobe of S106 has a relatively strong polarized intensity. The northern and southern parts of the strong polarized intensity around the exciting source of S106, S106 IRS 4, have fan-shaped and arc-edge structures, respectively. In addition, a dark spot in size, is located to the northeast of S106 IRS 4.
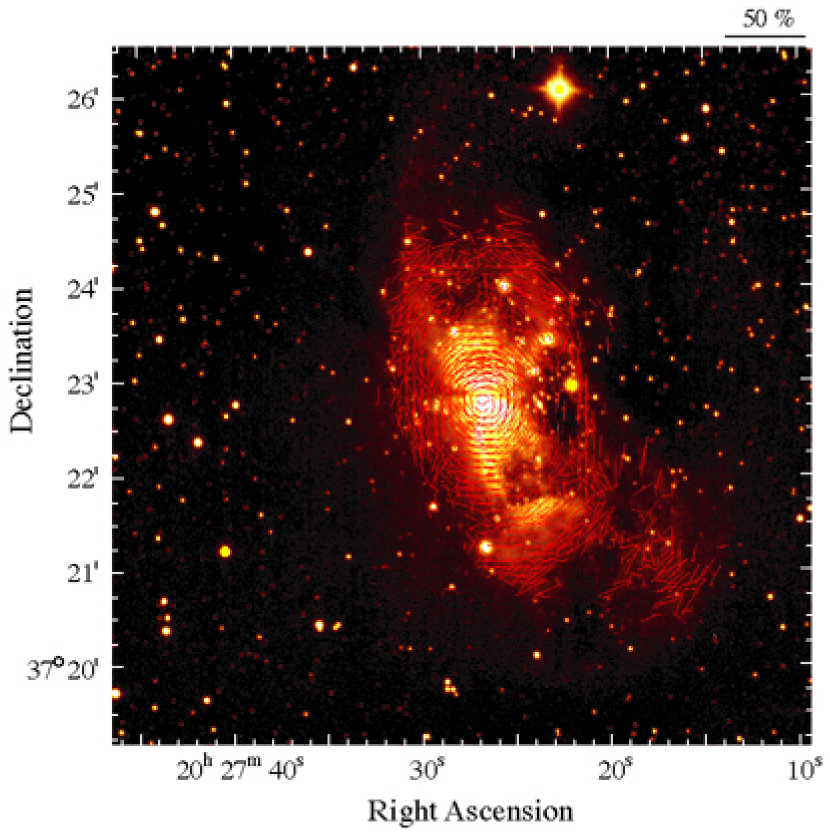
Next, we present a polarization vector map in Figure 2 to identify the location of the illuminating source(s) of the infrared reflection nebula. We found that the vector patterns of the high-intensity part of the nebula appear clearly centrosymmetric and the perpendicular lines of each vector point to a position at the exciting star of S106, S106 IRS 4, although the vector patterns of the low-intensity part (north and southeast part of the nebula) fall into disorder. This indicates that the exciting star, S106 IRS 4, is the illuminating star of the nebula.
3.2 Small-Scale Infrared Reflection Nebulae in S106
We found two small-scale infrared reflection nebulae (SIRNe 1 and 2), shown in Figure 1b. One of them, SIRN 1, is associated with a bright star classified into PMS type using our bands data (see Section 3.3). Although the other nebula, SIRN 2, has no clear point sources in our observations, this nebula is associated with one class I like object, No. 258, which was identified by Oasa et al. (2006).
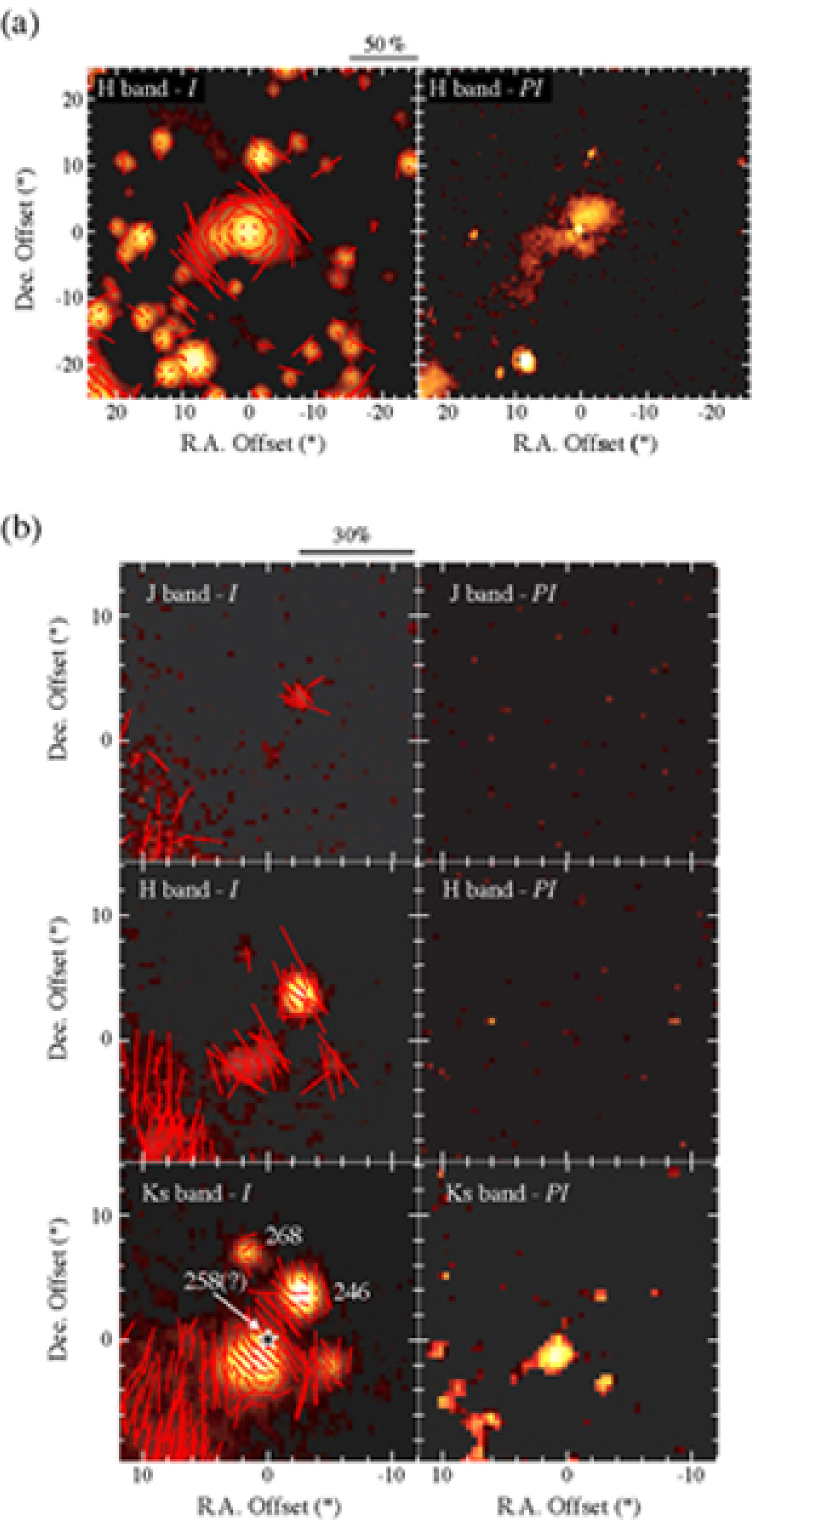
and the vector maps of SIRN 1 are shown in Figure 3a. Note that these images are formed by subtracting the extended component of the large reflection nebula formed by S106 IRS 4 from the original images. The pattern of the polarization vector clearly appears centrosymmetric and the perpendicular lines of each vector roughly point to the central star. These indicate that the nebulosity is illuminated by the central star. In addition, the image of SIRN is clearly butterfly-shaped, with the dark lane extending perpendicular to the bright region. This characteristic agrees with the polarization picture of the disk-envelope system around young stars (e.g., Nagata et al. 1983).
and the vector maps of SIRN 2 are shown in Figure 3b. The SIRN exhibits an extended emission pattern and the polarization vector is perpendicular to the elongated direction of the emission pattern. This feature agrees with the polarization picture of a monopolar outflow lobe. From the results of Oasa et al. (2006), the faint source No. 258, classified as a class I like object, is associated with the north edge of the nebula, and the perpendicular lines of each vector roughly point to source No. 258. From this result, we suggest that this reflection nebula is a bipolar nebula driven by the class I like object, source No. 258.
3.3 Infrared Colors of Stars
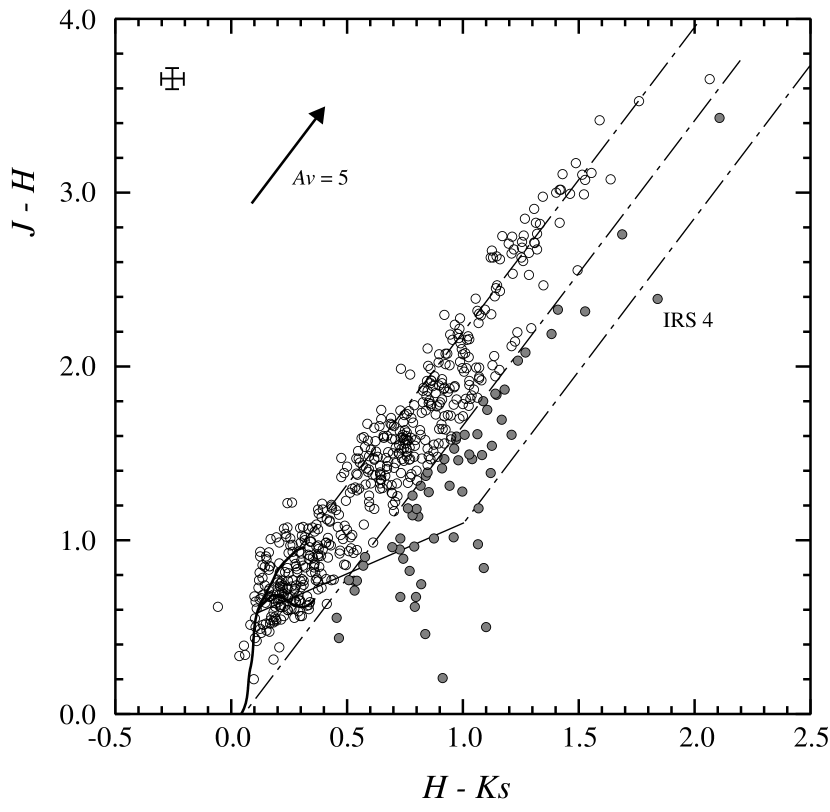
The NIR photometry of the stars provides information on large embedded populations in the cloud. Figure 4 shows the versus color-color diagram for the identified sources. We employ the reddening law of = 1.7 (Koornneef 1983). This diagram provides a good tool for discriminate between the interstellar reddening and intrinsic color excess. We used this diagram for all sources detected in the bands to classify sources into two groups (MS star/dwarf+giant and PMS star/protostar). We found 69 stars in the PMS star/protostar regions (filled circles) and 514 stars in the MS stars/dwarf+giant region (open circles). In addition, the stars in the MS stars/dwarf+giant region are divided into two groups, stars with high reddening and those with no reddening. The stars with no reddening are the foreground stars (FG stars). Thus, we found that the 363 stars with high reddening are the stars in the S106 region and background stars (S106 stars).
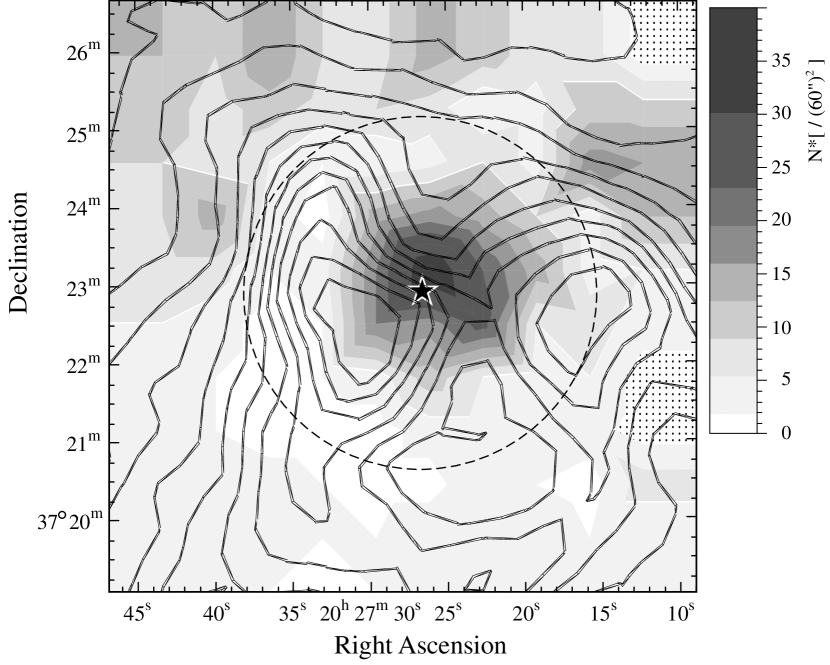
Next, we checked the surface stellar density of S106 stars to reveal the effect of the background stars. Figure 5 shows the distribution of the surface stellar density of S106 stars superposed on the distribution of the 13CO integrated intensity obtained by Schneider et al. (2007). The distribution of the surface stellar density dramatically decreases with distance from S106 IRS 4 and reaches a minimum near . In the region at , the surface stellar density gently increases with distance, particularly for the north region. This feature suggests that the number of background stars increases with distance from S106 IRS 4 in the north region. The distribution of the molecular gas in S106 region has a sharp edge north of S106, and in the north region, we see an anti-correlation between the surface stellar density and the molecular gas distribution. Therefore, we could have detected many background stars in the north region because the H2 column density dramatically decreases with distance from S106 IRS 4. This indicates that stars at distances of from S106 IRS 4 are mixed with many background stars. Thus, we regard the stars at from S106 IRS 4 as members of the cluster in S106 (CL stars) and regard the other stars at as both stars around S106 and background stars (field stars).
3.4 Aperture Polarimetry
We need to perform interstellar polarimetry to determine the magnetic field structure on the parsec scale. Therefore, we measured software aperture polarizations of point-like sources detected in the field of view. We rejected the sources with photometric errors greater than 0.1 mag and the polarization degree to error ratios smaller than 2. In addition, we rejected bright saturated sources. Note that the position angle error of each vector is less than .
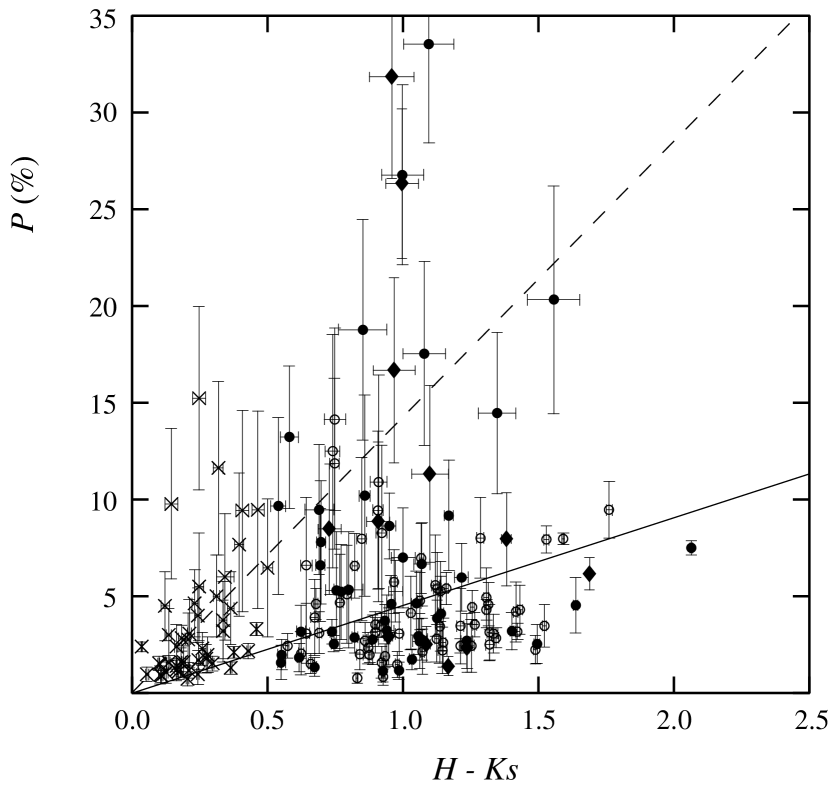
We measured the polarization degree and polarization angle of 162 source (43 FG stars, 55 CL stars, and 64 field stars). These sources include 8 of 12 sources with estimated polarization degree and angle from Hodapp & Rayner (1991). The polarization angles obtained by the present study were roughly consistent with those previous values. We plotted these sources in the versus diagram shown in Figure 6. A linear fit to the relationship is approximately obtained as = , except for the YSO candidates. This is smaller than the slopes () of the relationships in the M42 and NGC 2071 regions (Tamura et al. 2007; Kusakabe et al. 2008). The observational upper limit of the relationship was obtained by Jones (1989), and we represent this upper limit with a dashed line in Figure 6. In addition, we see no clear difference in index between the relationships for CL stars () and field stars (). Therefore, although the polarization efficiencies have similar values in the whole molecular clump, little difference exists in the polarization efficiency among the star-forming regions.
4 Discussion
4.1 Comparison of the Polarized Intensity and Molecular Gas Distribution
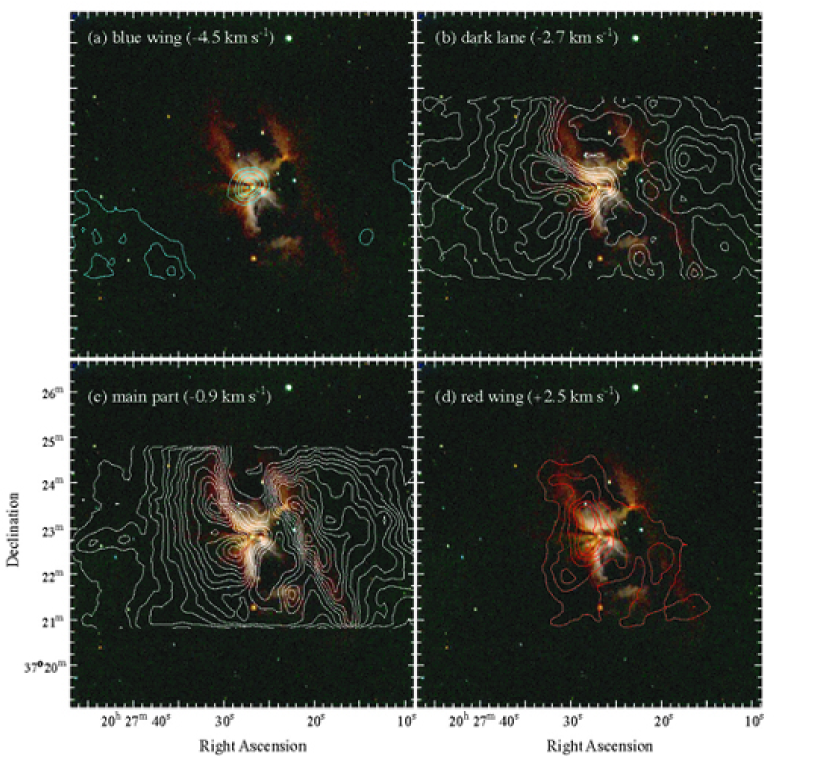
To reveal an interaction between the radiation from the massive star S106 IRS 4 and the molecular gas, we compared the infrared polarized emission and CO emission distributions. Schneider et al. (2007) revealed the full extent of the S106 molecular cloud, which has a mass of 7600 at a distance of 1.7 kpc using the 13CO (–) line. In addition, Schneider et al. (2002) revealed the structure of the dense gas around S106 with a high resolution of using CO (–) lines. Figure 7 shows the image superposed on the distributions of four velocity planes of the 13CO (–) obtained by Schneider et al. (2002). Figures 7a and 7d are the CO distributions with typical velocities for the blue wing and the red wing, respectively. Figures 7b and 7c are the velocity component corresponding to the dark lane in the infrared emission and the central velocity of the S106 molecular cloud, respectively.
The blue wing emission of the outflow component in Figure 7a is compact and located at S106 IRS 4. The red wing emission in Figure 7d extends father around S106 IRS 4 with a size of . In particular, the strong part of the red wing emission is located at the bright part of the image.
Next, the dark lane component of the molecular cloud in Figure 7b corresponds to the upper side of the dark lanes in the polarized infrared emission. The main component of the molecular cloud in Figure 7c shows an elongated north–south distribution along both sides of the near-infrared cavity walls. The diffuse emission in the image is well correlated with the north–south lanes of the CO main component, and this feature indicates the possibility of interaction between radiation from S106 IRS 4 and the dense molecular gas. In particular, the polarized emission associated with the east side lane is bright and the emission boundary is entirely consistent with that of the east side lane. In contrast, the polarized emission of the west side lane CO distribution boundary is much weaker than that of the east side lane. In the west of S106 IRS 4, a dark spot in the polarized emission exists at offsets (,) from H2O masers/S106 FIR (e.g., Furuya et al. 1999), and a compact molecular core, identified by CS and 13CO lines (e.g., Barsony et al. 1989), is located at the dark spot. In addition, a large dark bubble in the (polarized) infrared emission rests on the west side of the dark spot.
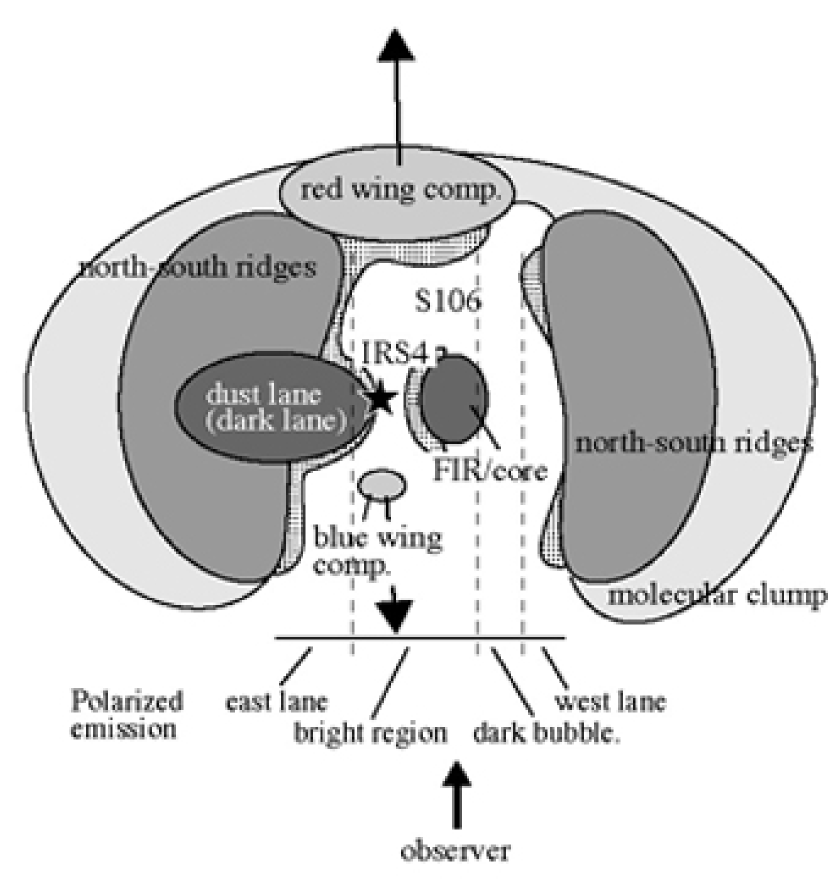
From these features, we show the relationship between the gas structure and polarization intensity in Figure 8. First, a bright in the central region of S106 appears probably due to the dense part of the outflow lobes existing on the far side of S106 but not near side. Basically, to generate bright polarized emission, starlight must be reflected by the material. In addition, for us to detect the bright polarized emission, the dense gas must not be located at the near side of the reflected area. Next, the difference in polarized emission brightness between the east and west lanes could be caused by the core near S106 IRS 4 blocking radiation from S106 IRS 4. Therefore, we suggest that the polarized emission is weak because almost all of the radiation from S106 IRS 4 fails to reach the front of the west side lane.
From these features, we suggest that the molecular gas in the west lane would not be remarkable affected by the radiation from the massive star. As to star formation activity, Motte et al. (2007) and Oasa et al. (2006) revealed the YSOs and dense cores distributions, and they found that the distributions have no clearly different between these lanes. Thus, although the influence of the radiation from the massive star to the molecular gas would be clearly different between the east and west lanes, it is not clear difference in star formation activity between these lanes. These results suggest that the influence of the radiation from the central star on star formation and core formation is not large.
4.2 Magnetic Field Structures
The aperture polarimetry of stars provides important information on the magnetic field structure. If the grains are aligned by magnetic fields, we can infer the direction of the magnetic fields projected onto the sky from the direction of the stellar polarization vectors (e.g., Weintraub et al. 2000). Although a grain alignment mechanism caused by the streaming motion of the gas around sources with molecular outflows may be the important process, our assumption is plausible because such grain alignment was observed in a molecular core without star formation (Kandori et al. 2008).
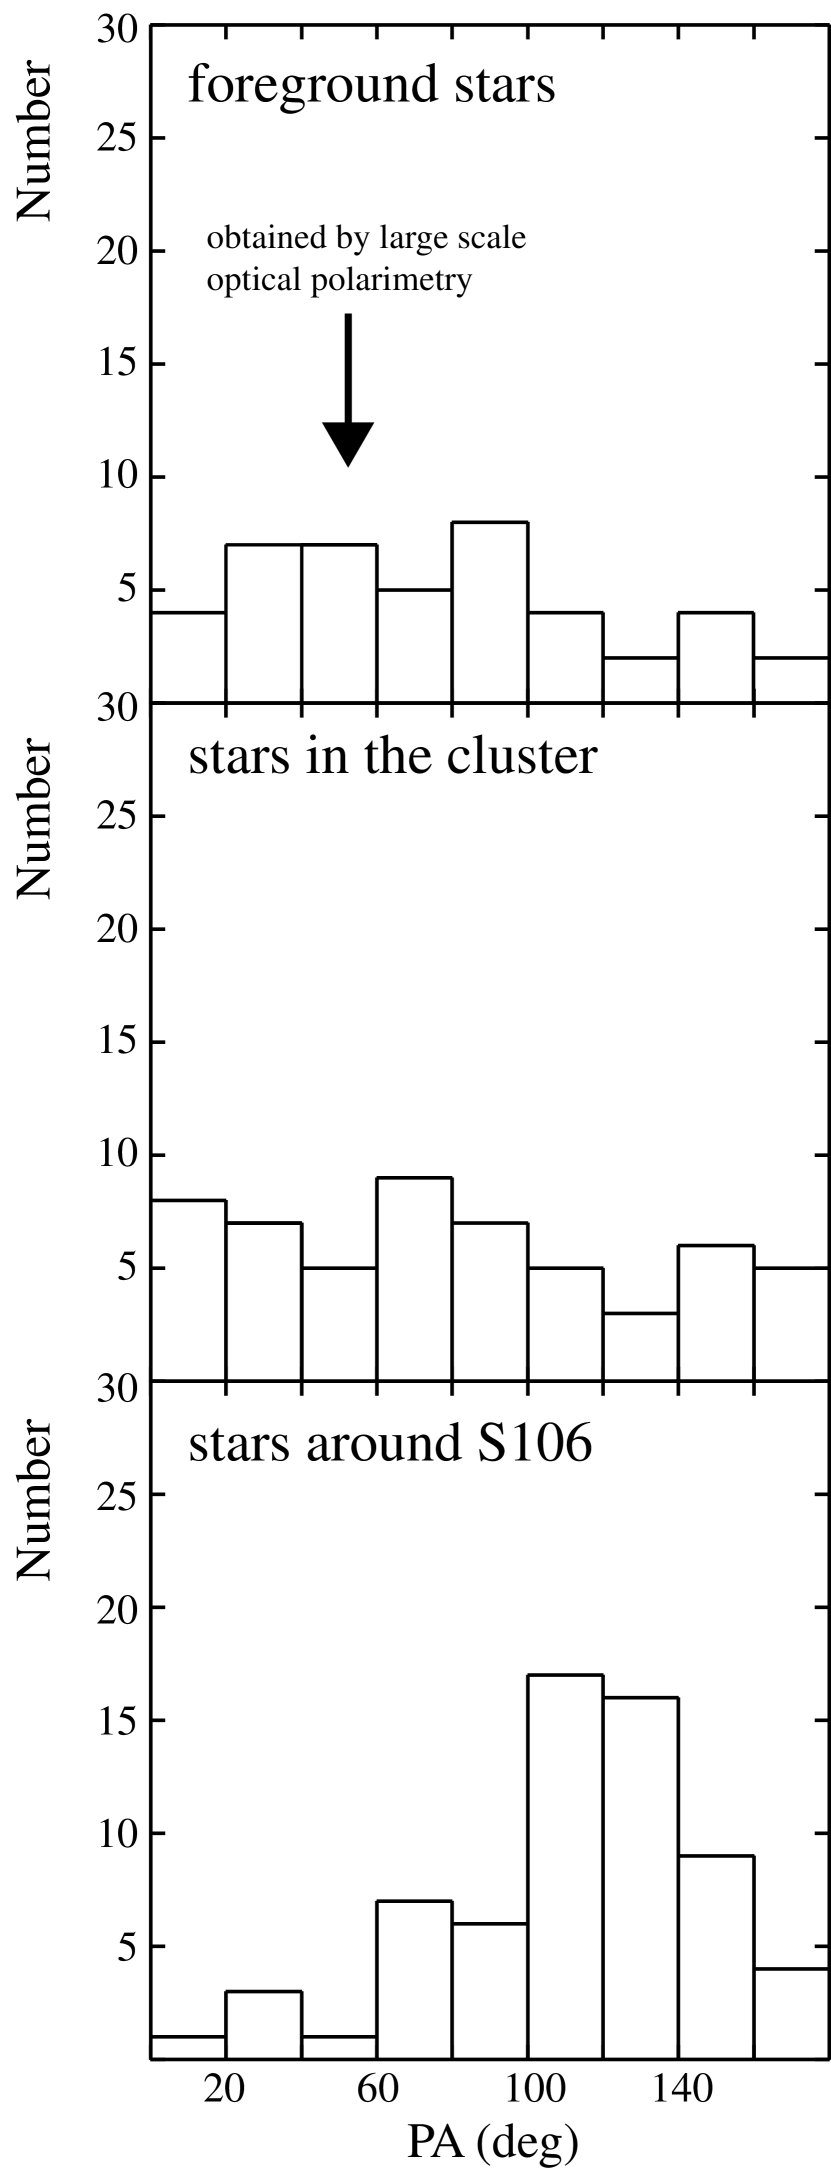
The histograms of the polarization position angles of the FG stars, CL stars, and field stars in S106 region are shown in Figure 9. Although the position angles of both FG stars and CL stars are distributed randomly, the field star angles clearly peak at . The field stars record interstellar polarization by the S106 molecular cloud because the field stars include many background stars. Thus, the large-scale distribution of the magnetic field in the S106 molecular cloud is expected to be in the direction of . Note that although the magnetic field position angle of the surrounding the S106 molecular cloud was estimated to be by optical polarimetry (Staude et al. 1982), all the stars which estimated the position angle by optical polarimetry are included in the area of foreground stars in Section 3.3 according to the 2MASS point source catalog.
Although CL stars have to exist in the S106 molecular cloud, the distribution of CL star position angles has no clear peak. The main cause of this feature would be an absence of dense gas on the near side of the cluster, or the influence of molecular outflow. Most of the dense gas on the near side of CL stars would be ionized by UV radiation from S106 IRS 4 or scattered by molecular outflows, or else the grain alignment would be disturbed by the molecular outflow. Indeed, as the 13CO intensity of the optical lobe of S106 nebula is weaker than the north-south walls (Schneider et al. 2002), most CL stars in the S106 nebula would not match the interstellar polarization.
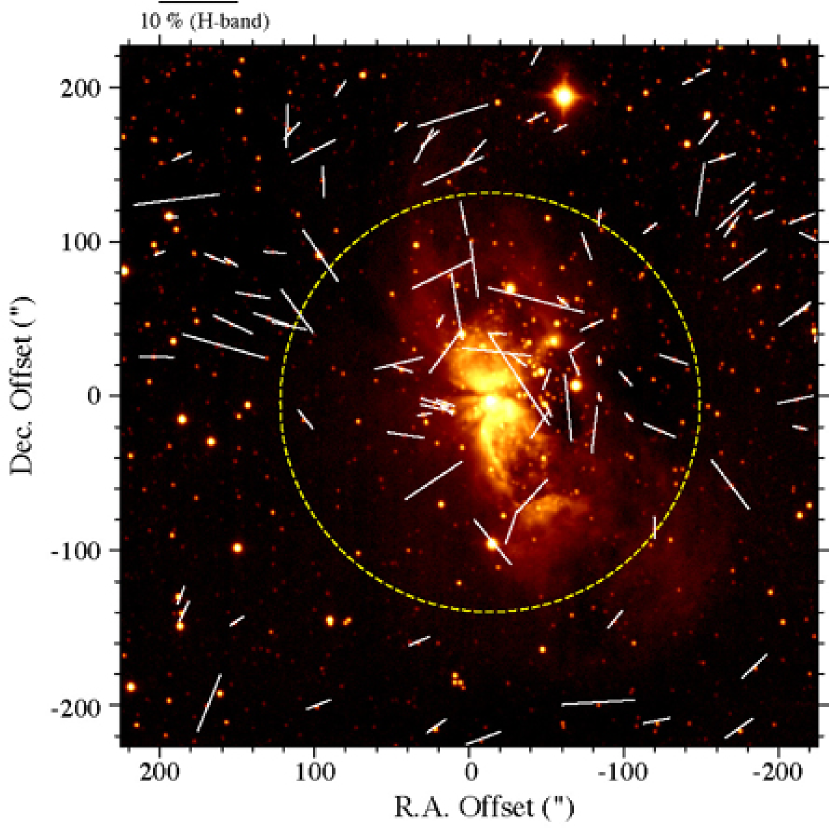
The aperture polarization vector map of point-like sources in the -band superposed on the intensity image is shown in Figure 10. Although the dispersion of the polarization vector directions is large, the overall polarization angle distribution of the outside the cluster area (the area outside the dashed circle in Figure 10) is – . In addition, the polarization angle distribution in the west–northwest region of the S106 nebula is . The region with the polarization angle lies just east of the 13CO component corresponding to the dark lane in Figure 7b. The polarization angle in the cluster area (the area inside the dashed circle in Figure 10) is complicated. Although the angle in the area corresponding to the dark lane is , most of the polarization angle inside or near the bright nebula is and roughly parallel to the bipolar nebula polar axis.
Vallée & Fiege (2005) studied the warm dense gas outside the hot gas through the 850 continuum observations. They found that the magnetic field in the bipolar nebula away from the central dust lane, corresponding to the dark lane component, is roughly parallel to the polar axis of the bipolar nebula. This result is roughly consistent with our finding. The magnetic field in the central dust lane, however, appears horizontal and elongated along the lane. The dust lane detected by Vallée & Fiege (2005) is sandwiched between the center region of the bipolar nebula and the west–northwest region with the polarization angle. Thus, the magnetic field in the dark lane region, corresponding to the warm dense gas region except for the region inside or near the nebula, has the same direction all over. From these results, we found that the magnetic field direction of the high dense gas region of the S106 cloud disagrees with that of the low dense gas region. We thus conclude that dichroic polarization at near-infrared wavelengths is a good tracer of magnetic fields in regions with wide density and scale range.
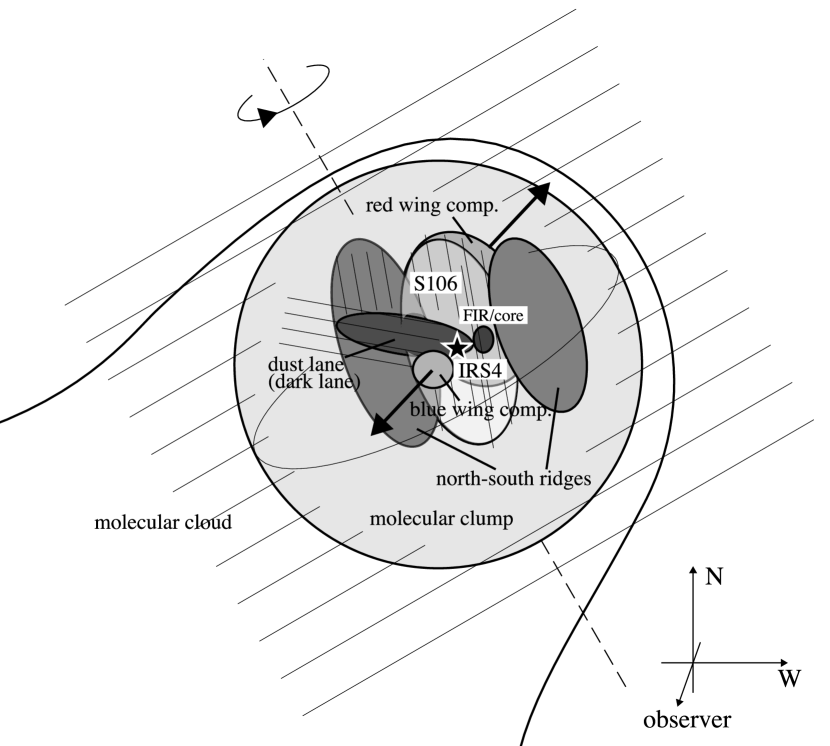
Finally, we discuss the relationship between the gas structure and the magnetic field structures in the S106 cloud. Figure 11 shows the relationship between the gas structure and the magnetic field structure. The head of the cloud exhibits a spherical structure with an axial rotation direction of . The direction of the magnetic field in the whole cloud is roughly vertical along the rotation axis. In contrast, the direction of the magnetic field in the dense gas (e.g., dust lane) is roughly parallel to the dust lane with an offset of from the magnetic field of the whole cloud. From these results, we suggest that such magnetic fields would be formed by contraction while the gas/dust coupled with a magnetic field rotates in the cloud. For a detailed discussion on such a magnetic field evolution, we must consider the relationship between the magnetic field in various clouds with star formation and the gas structure observed at high resolution, such as is obtainable with ALMA (Atacama Large Millimeter/submillimeter Array).
5 Conclusion
We conducted deep, wide-field imaging polarimetry toward S106, a large bipolar nebula. This is the first imaging polarimetry covering the entire bright bipolar nebula including a young cluster. The main results of the present study are summarized as follows:
1. We found a clear and extended infrared reflection nebula (IRN) over S106 on our polarization image. We confirmed that the illumination source of the nebula is the central massive star, S106 IRS 4 through an analysis of the polarization vectors.
2. We discovered two small-scale IRNe (SIRNe) associated with a YSO in our polarization images. The pattern of the polarization vector around the star appears to be centrosymmetric, which indicates that the SIRNe are illuminated by the associated YSO.
3. We classified 583 point-like sources into three categories: foreground stars, members of the S106 cluster and stars around S106. In addition, we measured the polarization degree and polarization angle of 250 of the point-like sources detected on the intensity images at .
4. We found that the east boundary of the polarization image is consistent with the boundary of the east side lane of the molecular gas. In addition, the west boundary of the polarization image is very weak, as almost all of the radiation from S106 IRS 4 fails to reach the front of the west side lane because the core located at the dark spot near S106 IRS 4 blocks the radiation from S106 IRS 4.
5. The magnetic fields of the area around the bright nebula S106 derived from the dichroic polarization run at a position angle of projected on the sky. The magnetic fields of the area near or inside the bright nebula S106 run at a position angle of projected on the sky.
We are grateful to the referee and Tomoyuki Kudo for their helpful comments and suggestions. We thank Satoshi Mayama for his valuable advice on the analysis. We thank N. Schneider for kindly providing the 13CO data in FITS format. This study made use of the SIMBAD database. The IRSF/SIRIUS project was initiated and supported by Nagoya University, the National Astronomical Observatory of Japan, and the University of Tokyo in collaboration with the South African Astronomical Observatory under a financial support of Grants-in-Aid for Scientific Research on Priority Areas (A) No. 10147207 and No. 10147214, and Grants-in-Aid No. 13573001 and No. 16340061 of the Ministry of Education, Culture, Sports, Science and Technology, Japan.
References
- Aspin (1990) Aspin, C., Rayner, J. T., McLean, I. S., & Hayashi, S. S. 1990, MNRAS, 246, 565
- Bally (1982) Bally, J., & Scoville, N. Z. 1982, ApJ, 255, 497
- Bally et al. (1983) Bally, J., Snell, R. L., & Predmore, R. 1983, ApJ, 272, 154
- Barsony et al. (1989) Barsony, M., Scoville, N. Z., Bally, J., & Claussen, M. J. 1989, ApJ, 343, 212
- Eiroa (1979) Eiroa, C., Elasser, H., & Lahulla, J. F. 1979, A&A, 74, 89
- Felli (1984) Felli, M. et al. 1984, A&A, 135, 261
- Furuya et al. (1999) Furuya, R. S., Kitamura, Y., Saito, M., Kawabe, R., & Wootten, H. A. 1999, ApJ, 525, 821
- Gehrz (1982) Gehrz, R. D., Grasdalen, G. L., Castelaz, M., Gullixson, C., Mozurkewich, D., & Hackwell, J. A. 1982, ApJ, 254, 550
- Harvey (1982) Harvey, P. M., Gatley, I., Thronson, H. A., Jr., & Werner, M. W. 1982, ApJ, 258, 568
- Hodapp (1991) Hodapp, K. W., & Rayner, J. 1991, AJ, 102, 1108
- Kandori et al. (2006) Kandori, R., et al. 2006, Proc. SPIE, 6269, 159
- Kandori et al. (2008) Kandori, R., submitted
- Koornneef (1983) Koornneef, J. 1983, A&A, 128, 84
- Kusakabe (2008) Kusakabe, N. et al. 2008, AJin press (astro-ph/08071424)
- Lucas et al. (1978) Lucas, R., Le Squeren, A. M., Kazes, J., & Encrenaz, P. J. 1978, A&A, 66, 155
- Martins et al. (2005) Martins, F., Schaerer, D., & Hillier, D. J. 2006, A&A, 436, 1049
- McLean et al. (1987) McLean, I. S. et al. 1987, MNRAS, 225, 393
- Mozurkewich et al. (1986) Mozurkewich, D., Schwartz, P. R., & Smith, H. A. 1986, ApJ, 311, 371
- Motte et al. (2007) Motte, F., Bontemps, S., Schilke, P., Schneider, N., Menten, K. M., & Broguière, D. 2007, A&A, 476, 1243
- Nagashima et al. (1999) Nagashima, C., et al. 1999, in Star Formation 1999, ed. T. Nakamoto (Nobeyama: Nobeyama Radio Observatory), 397
- Nagata et al. (1983) Nagata, T., Sato, S., & Kobayashi, Y. 1983, A&A, 119, 1
- Nagayama et al. (2003) Nagayama, T., et al. 2003, Proc. SPIE, 4841, 459
- Oasa et al. (2006) Oasa, Y. et al. 2006, AJ, 131, 1608
- Pipher et al. (1976) Pipher, J. L., Sharpless, S., Kerridge, S. J., Krassner, J., Schurmann, S., Merrill, K. M., Savedoff, M. P., & Soifer, B. T. 1976, A&A, 51, 255
- Richer et al. (1993) Richer, J. S., Padman, R., Ward-Thompson, D. Hills, R. E., & Harris, A. I. 1993, MNRAS, 262, 839
- Schneider et al. (2002) Schneider, N., Simon, R., Kramer, C., Stutzki, J., & Bontemps, S. 2002, A&A, 384, 225
- Schneider et al. (2007) Schneider, N., Simon, R., Bontemps, S., Comerón, F., & Motte, F. 2007, A&A, 474, 873
- Sharpless (1959) Sharpless, S. 1959, ApJS, 4, 257
- Sibille et al. (1975) Sibille, F., Bergeat, J., Lunel, M., & Kandel, R. 1975, A&A, 40, 441
- Staude et al. (1982) Staude, H. J., Lenzen, R., Dyck, H. M., & Schmidt, G. D. 1982, ApJ, 255, 95
- Stetson (1987) Stetson, P. B. 1987, PASP, 99, 191
- Tamura (2007) Tamura, M. et al. 2007, PASJ, 59, 467
- Uyaniker et al. (2001) Uyaniker, B., Fürst, E., Reich, W., Aschenbach, B., & Wielebinski, R. 2001, A&A, 371, 675
- Vallee (2005) Vallée, J. P., & Fiege, J. D. 2005, ApJ, 627 263
- Wardle & Kronberg (1974) Wardle, J. F. C, & Kronberg, P. P. 1974, ApJ, 194 249
- Weintraub et al. (2000) Weintraub, D. A., Goodman, A. A., & Akeson, R. L. 2000, in Protostars and Planets IV, ed. V. Mannings, A. P. Boss, & S. S. Russell (Tucson: Univ. Arizona Press), 247