A critical re-examination of resonant soft x-ray Bragg forbidden reflections in magnetite.
Abstract
Magnetite, Fe3O4, displays a highly complex low temperature crystal structure that may be charge and orbitally ordered. Many of the recent experimental claims of such ordering rely on resonant soft x-ray diffraction at the oxygen K and iron L edges. We have re-examined this system and undertaken soft x-ray diffraction experiments on a high-quality single crystal. Contrary to previous claims in the literature, we show that the intensity observed at the Bragg forbidden (00)c reflection can be explained purely in terms of the low-temperature structural displacements around the resonant atoms. This does not necessarily mean that magnetite is not charge or orbitally ordered, but rather that the present sensitivity of resonant soft x-ray experiments does not allow conclusive demonstration of such ordering.
In many transition-metal oxides, the spatial localization of electrons on certain sites, so-called charge ordering, has been used to explain some of their more intriguing ground-state properties. For example, charge ordering has been invoked to describe phase transitions in some magnetoresistive manganites,Mori et al. (1998) and the dynamic fluctuations of charge-ordered stripesTranquada et al. (1995) have been proposed as a mechanism of high temperature superconductivitySalkola et al. (1996). Magnetite, Fe3O4, was the first material in which such a charge ordering transition was proposed, in connection with the metal-insulator transition discovered by VerweyVerwey et al. (1947), and it has long been interpreted as the classic example of mixed-valence compound with formula unit Fe3+[Fe2+Fe3+]O4 [Refs. Verwey et al., 1947; Coey, 2004]. In this interpretation, magnetite, which at room temperature crystallises into the cubic inverted spinel structure AB2O4, with space group Fdm, has formally Fe3+ ions at the tetrahedral A sites and formally Fe2+ and Fe3+ ions at the octahedral B sites. Unfortunately, this simple picture is deceptive as the crystal structure below TV is extraordinarily complicated: the most recently reported structureWright et al. (2001) consists of a complex P2/c monoclinic cell containing 56 atoms in which the A and B Fe ions are split between two and six inequivalent sites respectively. Based on the P2/c structure, LSDA+U band structure calculations have reported both charge ordering (CO) (0.16 electrons) and an associated t2g orbital ordering (OO) on the octahedral sublattice Leonov et al. (2004); Jeng et al. (2004). Seemingly arguing against this, however, are the results of resonant x-ray scattering (RXS) experiments at the iron K-edge, have been interpreted as providing evidence either against any charge ordering Garcia et al. (2000); Subias et al. (2004); Garcia and Subias (2004), or in favor of a 0.12 electrons charge disproportionation Nazarenko et al. (2006) between the formally Fe2+ and Fe3+ sites than predicted in Refs. Leonov et al. (2004); Jeng et al. (2004). Very recently two further papers have appeared in which soft-x-ray diffraction measurements at the O K-edgeHuang et al. (2006) and the Fe L-edgesSchlappa et al. (2007) were interpreted as providing evidence for both charge and orbital ordering. We not that in the monoclinic cell the iron B sites are no longer equivalent by symmetry and there is therefore no requirement that they have the same charge density surrounding the atomic site. It is thus most likely that they will not have the same charge density. The question is therefore: what is the smallest charge difference, about which one would reasonably claimed that the material is charge ordered?
Resonant x-ray scattering occurs when a photon excites a core electron into an excited state and is subsequently re-emitted when the electron and core hole combineHANNON et al. (1988). On resonance the x-ray scattering amplitude is anisotropic and is sensitive to the anisotropic charge distribution of the resonating ion. The anisotropic charge distribution can be intrinsic to the scattering ion due to orbital occupation or can be intrinsic to the lattice as in the case of Templeton-Templeton scatteringTempleton and Templeton (1982, 1980); Dmitrienko (1983). The characteristic of Templeton-Templeton scattering is that a reflection which is Bragg-forbidden because of a compound symmetry operation, such as a glide plane or screw axis, becomes allowed when the incident photon energy is tuned to a resonance. On resonance the x-rays are sensitive to the quadrupolar term in the charge distribution, of the resonating atom, , and the difference between the two electric quadrupole moments, related by the symmetry operation, sum to zero and a resonant peak is observed arising from the crystal structure.
We have chosen to revisit magnetite and report here on resonant soft x-ray experiments that confirm the resonant enhancement of the (00)c reflection at both the oxygen K- and iron L3 edges. However, we have carried out a careful analysis of this superlattice reflection focussing on a detailed investigation of the effects of the distorted crystal structure below the Verwey transition, without invoking any charge or orbital ordering. We find that we can model our data well by considering only Templeton-Templeton scattering arising due to the structural distortions below the Verwey transition, without the need to resort to charge order or orbital order. This is contrary to the claims of Refs. Huang et al., 2006; Schlappa et al., 2007.
The experiments were conducted on high-quality synthetic magnetite crystals prepared in an arc-image furnace using the floating-zone technique. The purity of the sample was verified by heat capacity measurements, which gave a maximum heat capacity value of 120.6 K and an entropy change of 5.77 at the Verwey transition. These results give for Fe3-δO4 a value showing that the stochiometry of our sample is very close to the ideal case. Soft x-ray diffraction experiments were conducted on the ID08 beamline at the ESRF, Grenoble, France. In what follows we index the sample in the approximate low temperature Pmca orthorhombic structure (No. 57) with lattice parameters Å, Å and ÅWright et al. (2001). This structure is related to the P2/c (No. 13) structure by only a slight monoclinic distortion (). In this orthorhombic setting, the cubic (00)c reflection becomes the orthorhombic (001)o. The sample of Fe3O4 was cut with a surface normal and polished with 0.1 µ m diamond paste. It was then mounted on a SmCo magnet, providing a field at the sample surface of T, parallel to the surface normal. This field defines a unique -axis so that on cooling through the transition the number of crystallographic domains are minimized. The sample was then to a base temperature of 30 K and a resonant signal was observed at the (001)o position in reciprocal space in the vicinity of the iron and oxygen K-edges.
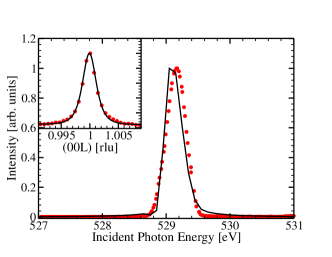
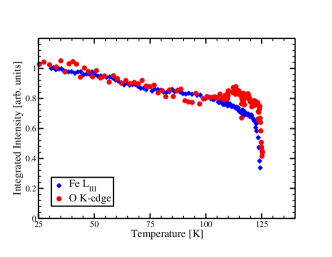
Figure 1 shows an incident photon energy scan at constant wavevector of (001)o as the is tuned in the vicinity of the oxygen K-edge. The scattering is observed to peak at 529.1 eV, about 10 eV below the main oxygen K-edge. The insert shows a scan along the [001]o direction through the (001)o reflection at eV, with a fit to a Lorentzian squared lineshape. The correlation length obtained from this fit is Å. This represents a lower bound on the penetration depth of the x-rays and thus this value indicates that the resonant signal is not surface sensitive even at the maximum of the resonance. The (001)o reflection was also visible in the vicinity of the iron L3 edge (Fig. 2). The bottom panel of Fig. 2 shows the incident photon energy dependence of the integrated intensity of the (001)o reflection. The experimental signal is only visible at the L3 threshold, with a maximum at an energy of 706.5 eV and is found to be suppressed above 708 eV. Such behavior arises from the very large self-absorption caused by the strong Fe L3 resonance, leading to a total loss in the observed signal. The width of the diffraction peak as a function of energy as shown in the top panel of Fig. 2 confirms this. The peak width is broader than that found at the oxygen K-edge and tracks the calculated absorption (dashed line) indicating that the change in width arrises from the increased absorption and consequently reduced penetration depth. Finally, Fig. 3 shows the temperature dependence of the integrated intensity of the (001)o reflection measured at both the iron L3 and oxygen K edges. The data were collected by performing rocking scans of the sample angle, , at each temperature. The signal at both edges was found to be virtually constant up until a temperature of K above which no intensity is observed.
We now turn to our resonant scattering simulation. We have used the FDMNES programJoly (2001) in the multiple scattering mode. *** The results of these sumulations are shown in Fig. 1 and Fig. 2 for the oxygen K and iron L edges respectively. In order to calibrate to the experimentally obtained data with the FDMNES simulations, the calculated absorption was compared with the sample absorption measured by total electron yield at the oxygen K-edge. Our simulation reproduces well the main experimental features, including the energy gap of about 10 eV between the RXS signal and the main oxygen absorption edge, as well as the energy width of the peak.
In this specific case, there are eight in-equivalent oxygen sites of Wyckoff symmetry in the Pmca space group. Considering only the oxygen atoms which dominate at this energy, the structure factor of the (001)o reflection is:
| (1) |
where is the atomic scattering amplitude, ( labels the inequivalent sites), is the fractional coordinate of the th oxygen atom in the direction and is the mirror plane in the direction of the Pmca setting Wright et al. (2001). Using the local mirror symmetry of the sites, we find that , the electric quadrupole matrix element. In the monoclinic P2/c setting, the symmetry is lost and a further contribution appears. This can be shown to be negligible, since it is proportional to the small angular distortion, , from the orthorhombic Pmca structure. Upon evaluating the structure factor we can conclude that almost all the scattered intensity comes from the sum of the quadrupoles at oxygen sites O1 and O2 only. That is In the high-temperature phase , due to the screw axis of the high temperature Fdm space group, and therefore their sum is zero. Below the Verwey transition, the unequal atomic displacements of the O1 and O2 oxygen sites from their high temperature positions, gives a finite signal even if . However, this signal is tiny because of the very small displacement, and has an expected amplitude of . In contrast, a much bigger amplitude might be expected if the surrounding iron tetrahedra are distorted making .
To investigate which of these contributes to be the most significant we have performed several numerical calculations in which the tetrahedral or octahedrally coordinated iron atoms, and/or the oxygens were in turn placed in their high-temperature positions, with the rest of the cluster held in their low-temperature positions. By this method, we found that the main contribution to the signal comes from the O2 position ( of the total): in fact does not change much when the iron sites move from the high-temperature to the low-temperature positions, while varies by about 100 . This dominant change is due in particular to the displacement of the octahedral iron atoms surrounding the O2 cite, The iron sites belong to the Fe sites, in the notation of Ref. Wright et al., 2002 and undergo the strongest distortion when passing from the high-temperature to the low-temperature phase: the FeB3-O2 distance changes from Å to Å, about a contraction. Therefore the O K-edge signal is mainly determined by the hybridization of oxygen orbitals at O2 sites with iron orbitals belonging to octahedral Fe sites.
The fact that we can explain the signal through these atomic displacements contradicts the interpretation of the signal at (001)o in Ref. Huang et al., 2006, that explicitly excluded a structural origin to the (001)o reflection at the oxygen K-edge. In particular, the arguments made by the authors of Ref. Huang et al., 2006, for the assignment of their signal to charge and orbital order due to its polarization dependence, are reproduced in our calculations based solely on structural distortions. This makes clear that invoking charge or orbital ordering to explain the detection of this superlattice reflection is unnecessary, and potentially misleading.
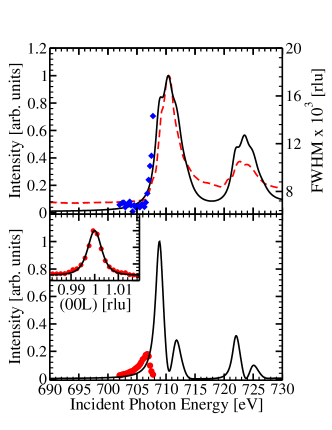
This same procedure was then used to evaluate the resonant signal of the (001)o reflection at Fe L2,3d-edges, as shown in Fig. 2. The calibration between our experimental data and the FDMNES simulation was set by comparison of the calculated absorption with the absorption as measured by total electron yield.
We can repeat the same analysis as performed at the oxygen K-edge for the data at the iron L2,3 edges. The results of the FDMNES simulation are shown in Figure 2. In the top panel a comparison between the measured and calculated absorption are shown, while the bottom panel shows the comparison between the integrated intensity of the (001)o reflection as a function of incident photon energy and our simulation.
In the Pmca setting there are 6 inequivalent groups of iron atoms, with two groups of tetrahedral iron-sites ( and , following the notation of Ref. [Wright et al., 2002]), and 4 groups of octahedral iron-sites (, , , and ), each group containing 4 iron atoms. , , , and sites have a local -symmetry ( Wyckoff site), so that the same considerations discussed above for the structure factor at the oxygen K edge are still valid. The only signal that can be measured for these ions is due to the , this time projected on the corresponding iron-sites . The site has a local symmetry ( Wyckoff site) and the two groups of two ions that contribute in antiphase at the (001)o are related by inversion symmetry, so their total contribution equal to zero. Finally the sites, with local inversion symmetry ( Wyckoff site), also contribute with the quadrupole component . When we numerically compare the separate contributions of the , , , and sites, we find that the intensity from the site is smaller by a factor of 500 relative to the contribution from the site. We can conclude therefore, that the dominant contribution of the intense low-energy peak seen in the calculations at 708.5 eV is from the iron atoms sitting at the sites. The tetrahedral sites and the octahedral site contribute mainly to the smaller shoulder at higher energy, and the fact that they have opposite amplitudes gives rise to the local minimum at 710 eV. Therefore all the experimentally detected signal comes from the sites (nominally Fe2+). This is in keeping with some previous results obtained with rather different approaches which concluded that the low-energy part of L3 spectrum (around 707 eV) is mainly determined by the states of the nominally divalent iron ions Leonov et al. (2004); Kuiper et al. (1997). However there is an important difference between the work presented here and atomic-multiplet-based calculations such as those reported in Refs. Schlappa et al., 2007; Kuiper et al., 1997. By focussing on the orbital occupancy in a ionic model, these latter authors have neglected the important structural differences that exist between sites like and (that are otherwise equivalent where formal charge is concerned, both being formally Fe2+). The fact that we calculated their relative contribution to the total signal in the ratio 1:500 proves such a difference.
The similar temperature dependence shown in Fig. 3 can now be explained as a natural consequence of the signals at the oxygen K-edge and iron L-edges both measuring the same order parameter. As discussed above we argue that this order parameter is structural distortions associated with the structural phase transition from the Fdm high temperature structure to the low temperature P2/c structure and not that of any charge or orbital order.
In conclusion, we have shown that the (001)o reflection of Fe3O4 is sensitive to the local displacements around the resonant ion at both the oxygen K and iron L edges. The electronic anisotropy arising from the crystal distortions are sufficient to explain the origin of the scattered signals, and any invocation of charge ordering and/or orbital ordering is not necessary to reproduce the data. At the oxygen K-edge, the signal is determined by the hybridization of O orbitals of the four O2 atoms with the Fe orbitals (nominally Fe3+). At the iron L3 edge, in contrast, the resonant x-ray scattering is mainly sensitive to the contribution of Fe orbitals from sites (nominally Fe2+).
Work at Brookhaven was supported by the U.S. Department of Energy under contract DE-AC02-98CH1-886. SBW would like to thank J.P. Hill for critical reading of the manuscript and S.R. Bland for helpful discussions.
References
- Mori et al. (1998) S. Mori, C. Chen, and S.-W. Cheong, Nature 392, 473 (1998), 10.1038/33105 Paper:fe3o4, URL http://dx.doi.org/10.1038/33105.
- Tranquada et al. (1995) J. Tranquada, B. Sternlieb, J. Axe, Y. Nakamura, and S. Uchida, Nature 375, 561 (1995), 10.1038/375561a0 Paper:fe3o4, URL http://dx.doi.org/10.1038/375561a0.
- Salkola et al. (1996) M. Salkola, V. Emery, and S. Kivelson, Phys Rev Lett 77, 155 (1996), notes Paper:fe3o4.
- Verwey et al. (1947) E. Verwey, P. Haayman, and F. Romeijn, J. Chem. Phys. 15, 181 (1947), notes Paper:fe3o4, URL http://link.aip.org/link/?JCP/15/181/1.
- Coey (2004) M. Coey, Nature 430, 155 (2004), 10.1038/430155a Paper:fe3o4, URL http://dx.doi.org/10.1038/430155a.
- Wright et al. (2001) J. Wright, J. Attfield, and P. Radaelli, Phys Rev Lett 87, (2001), notes Paper:fe3o4.
- Leonov et al. (2004) I. Leonov, A. Yaresko, V. Antonov, M. Korotin, and V. Anisimov, Phys. Rev. Lett. 93, 146404 (2004), notes Paper:fe3o4, URL http://link.aps.org/abstract/PRL/v93/e146404.
- Jeng et al. (2004) H.-T. Jeng, G. Guo, and D. Huang, Phys. Rev. Lett. 93, 156403 (2004), notes Paper:fe3o4, URL http://link.aps.org/abstract/PRL/v93/e156403.
- Garcia et al. (2000) J. Garcia, G. Subias, M. Proietti, H. Renevier, Y. Joly, J. Hodeau, J. Blasco, M. Sánchez, and J. Bérar, Phys. Rev. Lett. 85, 578 (2000), notes Paper:fe3o4, URL http://link.aps.org/abstract/PRL/v85/p578.
- Subias et al. (2004) G. Subias, J. Garcia, J. Blasco, M. Proietti, H. Renevier, and M. Sánchez, Phys. Rev. Lett. 93, 156408 (2004), notes Paper:fe3o4, URL http://link.aps.org/abstract/PRL/v93/e156408.
- Garcia and Subias (2004) J. Garcia and G. Subias, JOURNAL OF PHYSICS-CONDENSED MATTER 16, R145 (2004), notes Paper:fe3o4.
- Nazarenko et al. (2006) E. Nazarenko, J. E. Lorenzo, Y. Joly, J. L. Hodeau, D. Mannix, and C. Marin, Phys Rev Lett 97, (2006), notes Paper:fe3o4, URL http://scitation.aip.org/getabs/servlet/GetabsServlet?prog=no%rmal&id=PRLTAO000097000005056403000001&idtype=cvips&gifs=yes.
- Huang et al. (2006) D. Huang, H. Lin, J. Okamoto, K. Chao, H. Jeng, and et al., PHYSICAL REVIEW LETTERS (2006), notes Paper:fe3o4, URL http://link.aps.org/doi/10.1103/PhysRevLett.96.096401.
- Schlappa et al. (2007) J. Schlappa, C. Schuessler-Langeheine, C. F. Chang, H. Ott, A. Tanaka, Z. Hu, M. W. Haverkort, E. Schierle, E. Weschke, G. Kaindl, et al., cond-mat pp. arXiv:cond–mat/0605096v2 (2007), notes Paper:fe3o4, URL http://xxx.arxiv.org/abs/cond-mat/0605096v2.
- HANNON et al. (1988) J. HANNON, G. TRAMMELL, M. BLUME, and D. Gibbs, Phys Rev Lett 61, 1245 (1988), notes paper:fe3o4.
- Templeton and Templeton (1982) D. Templeton and L. Templeton, Acta Crystallographica Section A 38, 62 (1982), doi:10.1107/S0567739482000114 Paper:fe3o4, URL http://dx.doi.org/10.1107/S0567739482000114.
- Templeton and Templeton (1980) D. Templeton and L. Templeton, Acta Crystallographica Section A 36, 237 (1980), doi:10.1107/S0567739480000472 Paper:fe3o4, URL http://dx.doi.org/10.1107/S0567739480000472.
- Dmitrienko (1983) V. Dmitrienko, Acta Crystallographica Section A 39, 29 (1983), paper:fe3o4, URL http://dx.doi.org/10.1107/S0108767383000057.
- Joly (2001) Y. Joly, Phys Rev B 63, 125120 (2001), notes Paper:fe3o4, URL http://link.aps.org/abstract/PRB/v63/e125120.
- Wright et al. (2002) J. Wright, J. Attfield, and P. Radaelli, Phys Rev B 66, (2002), notes Paper:fe3o4, URL http://prola.aps.org/abstract/PRB/v66/i21/e214422.
- Kuiper et al. (1997) P. Kuiper, B. Searle, L. Duda, R. Wolf, and P. vanderZaag, J Electron Spectrosc 86, 107 (1997), notes Paper:fe3o4.