Correlated volume-energy fluctuations of phospholipid membranes:
A simulation study
Abstract
This paper reports all-atom computer simulations of five phospholipid membranes (DMPC, DPPC, DMPG, DMPS, and DMPSH) with focus on the thermal equilibrium fluctuations of volume, energy, area, thickness, and chain order. At constant temperature and pressure, volume and energy exhibit strong correlations of their slow fluctuations (defined by averaging over 0.5 nanosecond). These quantities, on the other hand, do not correlate significantly with area, thickness, or chain order. The correlations are mainly reported for the fluid phase, but we also give some results for the ordered (gel) phase of two membranes, showing a similar picture. The cause of the observed strong correlations is identified by splitting volume and energy into contributions from tails, heads, and water, and showing that the slow volume-energy fluctuations derive from van der Waals interactions of the tail region; they are thus analogous to the similar strong correlations recently observed in computer simulations of the Lennard-Jones and other simple van der Waals type liquids [U. R. Pedersen et al., Phys. Rev. Lett. 2008, 100, 015701]. The strong correlations reported here confirm one crucial assumption of a recent theory for nerve signal propagation proposed by Heimburg and Jackson [T. Heimburg and A. D. Jackson, Proc. Natl. Acad. Sci. 2005, 102, 9790-9795].
In 2005 Heimburg and Jackson showed that biomembranes may carry solitonic sound waves whose maximum amplitude and minimum velocity are close to the propagation velocity in myelinated nerves Heimburg2005 . Their paper concluded: “It would be surprising if nature did not exploit these features.” Subsequent works by the same authors argue directly that nerve signals are not primarily electrical, but solitonic sound waves carried by the nerve cell membrane Heimburg2007A ; Andersen2009 . The conventional wisdom is that nerve signals propagate via electrical current as formulated in the Hodgkin-Huxley theory Hodgkin1952 . The Heimburg-Jackson theory explains anaesthesia as a straightforward effect of melting-point depression of the order-disorder transition. This can in turn explain why biomembranes have a transition temperatures close to physiological temperatures Nielsen2007 .
The Heimburg-Jackson nerve-signal theory motivated this study. One element of the theory is the assumption that volume and enthalpy correlate strongly in their thermal equilibrium fluctuations, at least as it regards the slow parts of these fluctuations. This assumption was justified by experimental observations that membranes specific heat and compressibility are proportional in their temperature dependence across the phase transition Heimburg1998 ; Ebel2001 . Also, a correlation between lipid area and enthalpy has been proposed Heimburg1998 based on experimental observationsdimova2000 . If so, both volume, membrane area and enthalpy are controlled by a single parameter. Below, we present first results from extensive computer simulations of different phospholipid membranes performed in order to investigate whether strong volume-energy and/or area-energy correlations are observed and, if so, what causes them.
Recently, we studied equilibrium thermodynamic fluctuations of much simpler systems, namely various model liquids like the standard Lennard-Jones (LJ) liquid and similar systems Pedersen2008PhysRev ; Pedersen2008PhysRevE ; Bailey2008A ; Bailey2008B ; bailey2008_jpcm . In many such simple liquids one finds a strong correlation between the equilibrium fluctuations of virial and potential energy , when fluctuations are studied at constant particle number , constant volume , and constant temperature (the so-called ensemble Feller1995 ). RecallAllen1989 , that the virial gives the non-ideal contribution to the instantaneous pressure via the defining equation: where is the instantaneous temperature defined via the instantaneous kinetic energy. The virial is a function of the particle positions Allen1989 . For the LJ liquid, as well as for a united-atom toluene model, a dumbbell model, the Kob-Andersen binary LJ liquid Kob1994 , and other van der Waals liquids, and correlate better than 90% in their equilibrium fluctuations Pedersen2008PhysRev . This reflects an effective inverse power-law potential dominating fluctuations, as discussed in details in Refs. Bailey2008A, ; Bailey2008B, . Liquids with poor correlation include water and methanol Pedersen2008PhysRev ; Bailey2008A . In these cases the correlations are ruined by the hydrogen bonds, which are conventionally modelled via Coulomb forces – the existence of competing interactions prevents strong correlation in hydrogen-bonded liquids.
For liquids with time-scale separation, like highly viscous liquids, strong correlations are particularly significant: Viscous liquids with strong correlations are close to being ”single-order-parameter liquids” in the classical Prigogine-Defay prigogine1954 ; Davies1952 sensePedersen2008PhysRevE ; Ellegaard2007 ; bailey2008_jpcm . This implies that complex frequency-dependent thermoviscoelastic response functions like the isobaric/isochoric dynamic specific heat, the dynamic thermal expansion coefficient, the dynamic compressibility, etc, are all given by a single function Ellegaard2007 . In particular, these cannot “decouple” Angell1991 from one another – they must all exhibit relaxations in the same frequency range. It has also been shown that strongly correlating viscous liquids obey density scaling, i.e., that if the relaxation time is measured at different temperatures and density , is a unique function Roland2005 of where the exponent may be determined from studies of correlations at a single state point Schroder2008 . Finally, it was recently found that strongly correlating viscous liquids have much simpler aging properties than viscous liquids in general schroder2009 .
Fluctuations are ensemble dependent, of course, and one may ask what happens if fluctuations are studied instead in the ensemble of constant temperature and pressure ( ensemble). In this ensemble virial fluctuations are not interesting, but there are strong correlations for simple liquids between the fluctuations of volume and potential energy Pedersen2008PhysRevE . This is the ensemble used below for studying biomembrane thermodynamic fluctuations.
Motivated by the findings for simple model liquids and the Heimburg-Jackson theory, we decided to focus on phospholipid membranes in order to investigate whether the Heimburg-Jackson assumption of strong volume-enthalpy correlations is confirmed. A phospholipid has van der Waals interactions between its acyl chains and hydrogen bonds in the head region. Similarities to simple van der Waals liquids are not at all obvious, and the microscopic origin of the volume-enthalpy correlation tentatively derived from experiments Heimburg1998 ; Ebel2001 is not trivial. Thermodynamic fluctuations of simulated membranes have been studied in the past jeu2003 ; bolterauer1991 ; feller1996 ; baron2006 , however, not with a focus on volume-energy correlations.
Because of the large amount of water in the system and the hydrophilic head groups, one does not expect strong instantaneous correlations of phospholipid membrane thermodynamic fluctuations Pedersen2008PhysRev ; Bailey2008A . The Heimburg-Jackson theory, however, relates to strong correlations of slow degrees of freedom of the biomembrane (on millisecond time scales), and so do the experiments they quote indicating strong correlations Heimburg1998 ; Ebel2001 . This is analogous to the situation for highly viscous liquids where time-scale separation between the fast, vibrational degrees of freedom and the much slower configurational ones is also e.g. essential for viscous flow or visco-elastic responses. Phospholipids are the major constituent of biological membranes heimburg2007book . Close to physiological temperature these membranes undergo a transition from an ordered phase (Lβ) to a disordered phase (Lα) jeu2003 ; nagle1980 ; Nielsen2007 ; Zhang1995 ; jin1997 . Below, we evaluate the strength of correlations for both the disordered and ordered phases with main focus on the disordered phase. The correlation strengths are calculated for a range of time scales. We show that fluctuations correlate strongly, but only on long time scales pedersen2008aip . We also investigate how well membrane area as well as chain order-parameter fluctuations correlate with and fluctuations; such correlations are generally weak. Finally, the cause of the correlations is identified by splitting volume and energy into contributions from the tail-, the head-, and the water region: The slow, strongly correlating fluctuations are shown to derive from the tails which are dominated by van der Waals interactions, thus establishing a conceptual link to the strong correlations of the slow pressure-energy fluctuations – the virial/potential energy correlations – of simple van der Waals liquids Pedersen2008PhysRev .
I Simulation details
| (A) System (phase) | [ns] | [ns] | [K] | [K] | ||
|---|---|---|---|---|---|---|
| DMPC-f (fluid) | 151 | 121 | 128 | 330.0 | 329.01.6 | 33 |
| DMPC-g (ordered) | 65 | 36 | 64 | 286.0 | 285.32.0 | 33 |
| DPPC-f (fluid) | 180 | 124 | 72 | 325.0 | 324.02.1 | 29 |
| DPPC-g (ordered) | 78 | 48 | 64 | 304.0 | 303.22.1 | 33 |
| DMPG (fluid) | 149 | 49 | 128 | 330.0 | 329.01.6 | 33 |
| DMPS (fluid) | 139 | 49 | 128 | 340.0 | 339.01.7 | 36 |
| DMPSH (fluid) | 136 | 35 | 128 | 340.0 | 339.11.6 | 37 |
| (B) System (phase) | ||||||||
|---|---|---|---|---|---|---|---|---|
| DMPC-f (fluid) | 0.77 | 9.6 | 0.82 | 0.50 | 0.57 | -0.75 | -0.49 | -0.54 |
| DMPC-g (ordered) | 0.47 | 6.1 | 0.31 | 0.02 | 0.05 | -0.64 | 0.12 | 0.14 |
| DPPC-f (fluid) | 0.87 | 10.2 | 0.89 | -0.29 | -0.36 | 0.00 | -0.61 | -0.71 |
| DPPC-g (ordered) | 0.75 | 6.6 | 0.71 | -0.16 | 0.12 | -0.67 | 0.09 | -0.07 |
| DMPG (fluid) | 0.82 | 8.5 | 0.80 | 0.41 | 0.40 | -0.76 | 0.01 | 0.08 |
| DMPS (fluid) | 0.59 | 7.6 | 0.64 | 0.30 | 0.28 | -0.71 | 0.04 | 0.20 |
| DMPSH (fluid) | 0.78 | 13.2 | 0.84 | 0.43 | 0.51 | -0.50 | 0.05 | 0.14 |
(A) : Total simulation time in nanoseconds. : Length of production run in nanoseconds (only membranes in quasi-equilibrium, i.e., with no detectable drift in the area per molecule, were included in the data analysis); : Number of lipid molecules; : Thermostat temperature in Kelvin; : Average temperature and standart diviation of fluctuations; : Number of water molecules per lipid molecule. (B) : Energy-Volume correlation coefficient (see Equation 1). The bar indicated a 0.5 ns average. The uncertainty is estimated from the DMPC-f and DPPC-f trajectories as described in the text (67% confidence interval); : Energy-volume scaling factor in units of mL/J (see Equation 11); : Energy-“Energy of tail region” correlation coefficient. : Energy-Area correlation coefficient; : Volume-Area correlation coefficient. : Area-“chain order-parameter” correlation coefficient; : Energy-“chain order-parameter” correlation coefficient; : Volume-“chain order-parameter” correlation coefficient.
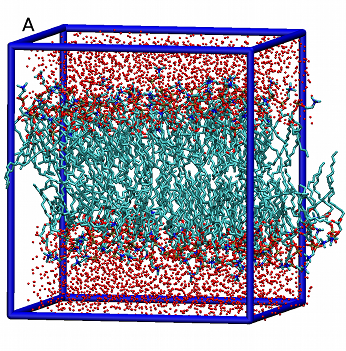
Details of the seven membrane simulations performed are listed in Table 1. The following abbreviations are used: DMPC-f and DMPC-g: fully hydrated di-myristoyl-phosphatidyl-choline membrane in the fluid and ordered phases, respectively Pedersen2006 . Figure 1A show a configuration of the DMPC-f membrane. DPPC-f and DPPC-g: fully hydrated di-palmitoyl-phosphatidyl-choline membrane in the fluid and ordered phases, respectively Sonne2007 . DPPG: a fully hydrated di-palmitoyl-phosphatidyl-glycerol membrane in the fluid phase with calcium counter ions Pedersen2007 . DPPS: a fully hydrated di-myristoyl-phosphatidyl-serine membrane in the fluid phase with calcium counter ions Pedersen2007 . DMPSH: a fully hydrated and protonated di-myristoyl-phosphatidyl-serine membrane in the fluid phase Pedersen2007 . Phospholipids (and counter ions) were modeled using the all-atom CHARMM27 force-field macKerell1998-charmm with modified charges of the head group as described in detail elsewhere Pedersen2006 . Membranes were hydrated using explicit water represented by the TIP3 model jorgensen1983-TIP3 .
Simulations were carried out using the NAMD software package Phillips2005 . In all simulations a time step of 1.0 fs was used. Temperature and pressure were controlled by a Langevin thermostat (damping coefficient: 5 ps-1) and a Nosé-Hoover Langevin barostat (anisotropic regulation; piston oscillation time: 100 fs; damping time: 50 fs) Feller1995 . Electrostatic interactions were evaluated using the Particle-Mesh-Ewald method Darden1993 ; Essmann1995 with grid spacing of about 1Å updated every 4 fs. Lennard-Jones potentials were brought smoothly to zero by multiplying a switching function ; for , for and for with Å and Å. Periodic boundary conditions were applied in all three dimensions.
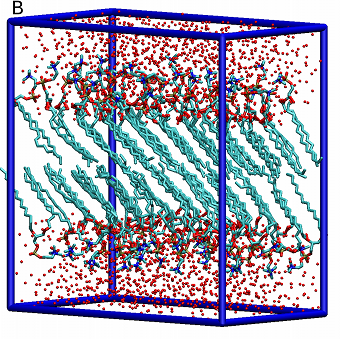
Initial configurations of DMPC-f, DPPC-f, DPPG, DPPS, DMPS and DMPSH are taken from Refs. Pedersen2006, ; Pedersen2007, ; Sonne2007, . Initial configurations of the ordered membranes, DMPC-g and DPPC-g, were build from a membrane simulated by Venable and co-workers Venable2000 . Throughout the simulation the acyl chains remain in an ordered structure as shown in Figure 1B jin1997 . Thermal equilibrium was ensured by monitoring the membrane area; only trajectories with no drift (compared to the thermal fluctuations) were used in the data analysis. Lengths of equilibrium trajectories are listed in Table 1A in the column under . The importance of firmly establishing that the systems is in equilibrium should be emphasized, since an apparent strong correlation would appear if volume and energy relax from some (arbitrary) out-of-equilibrium state. Only small finite size effects are expected at the simulated system sizes vries2005 .
II Results
The following collective quantities were evaluated every 0.5 ps: Potential energy , simulation box volume (where , and are the box dimensions), projected membrane area , box thickness , and average chain order parameter . The latter quantity characterizes the overall order of acyl chains Tieleman1996 and is defined by where is the angle between the membrane normal () and the C-H bond of a given methylene group, and denotes an average over all methylene groups in all chains.
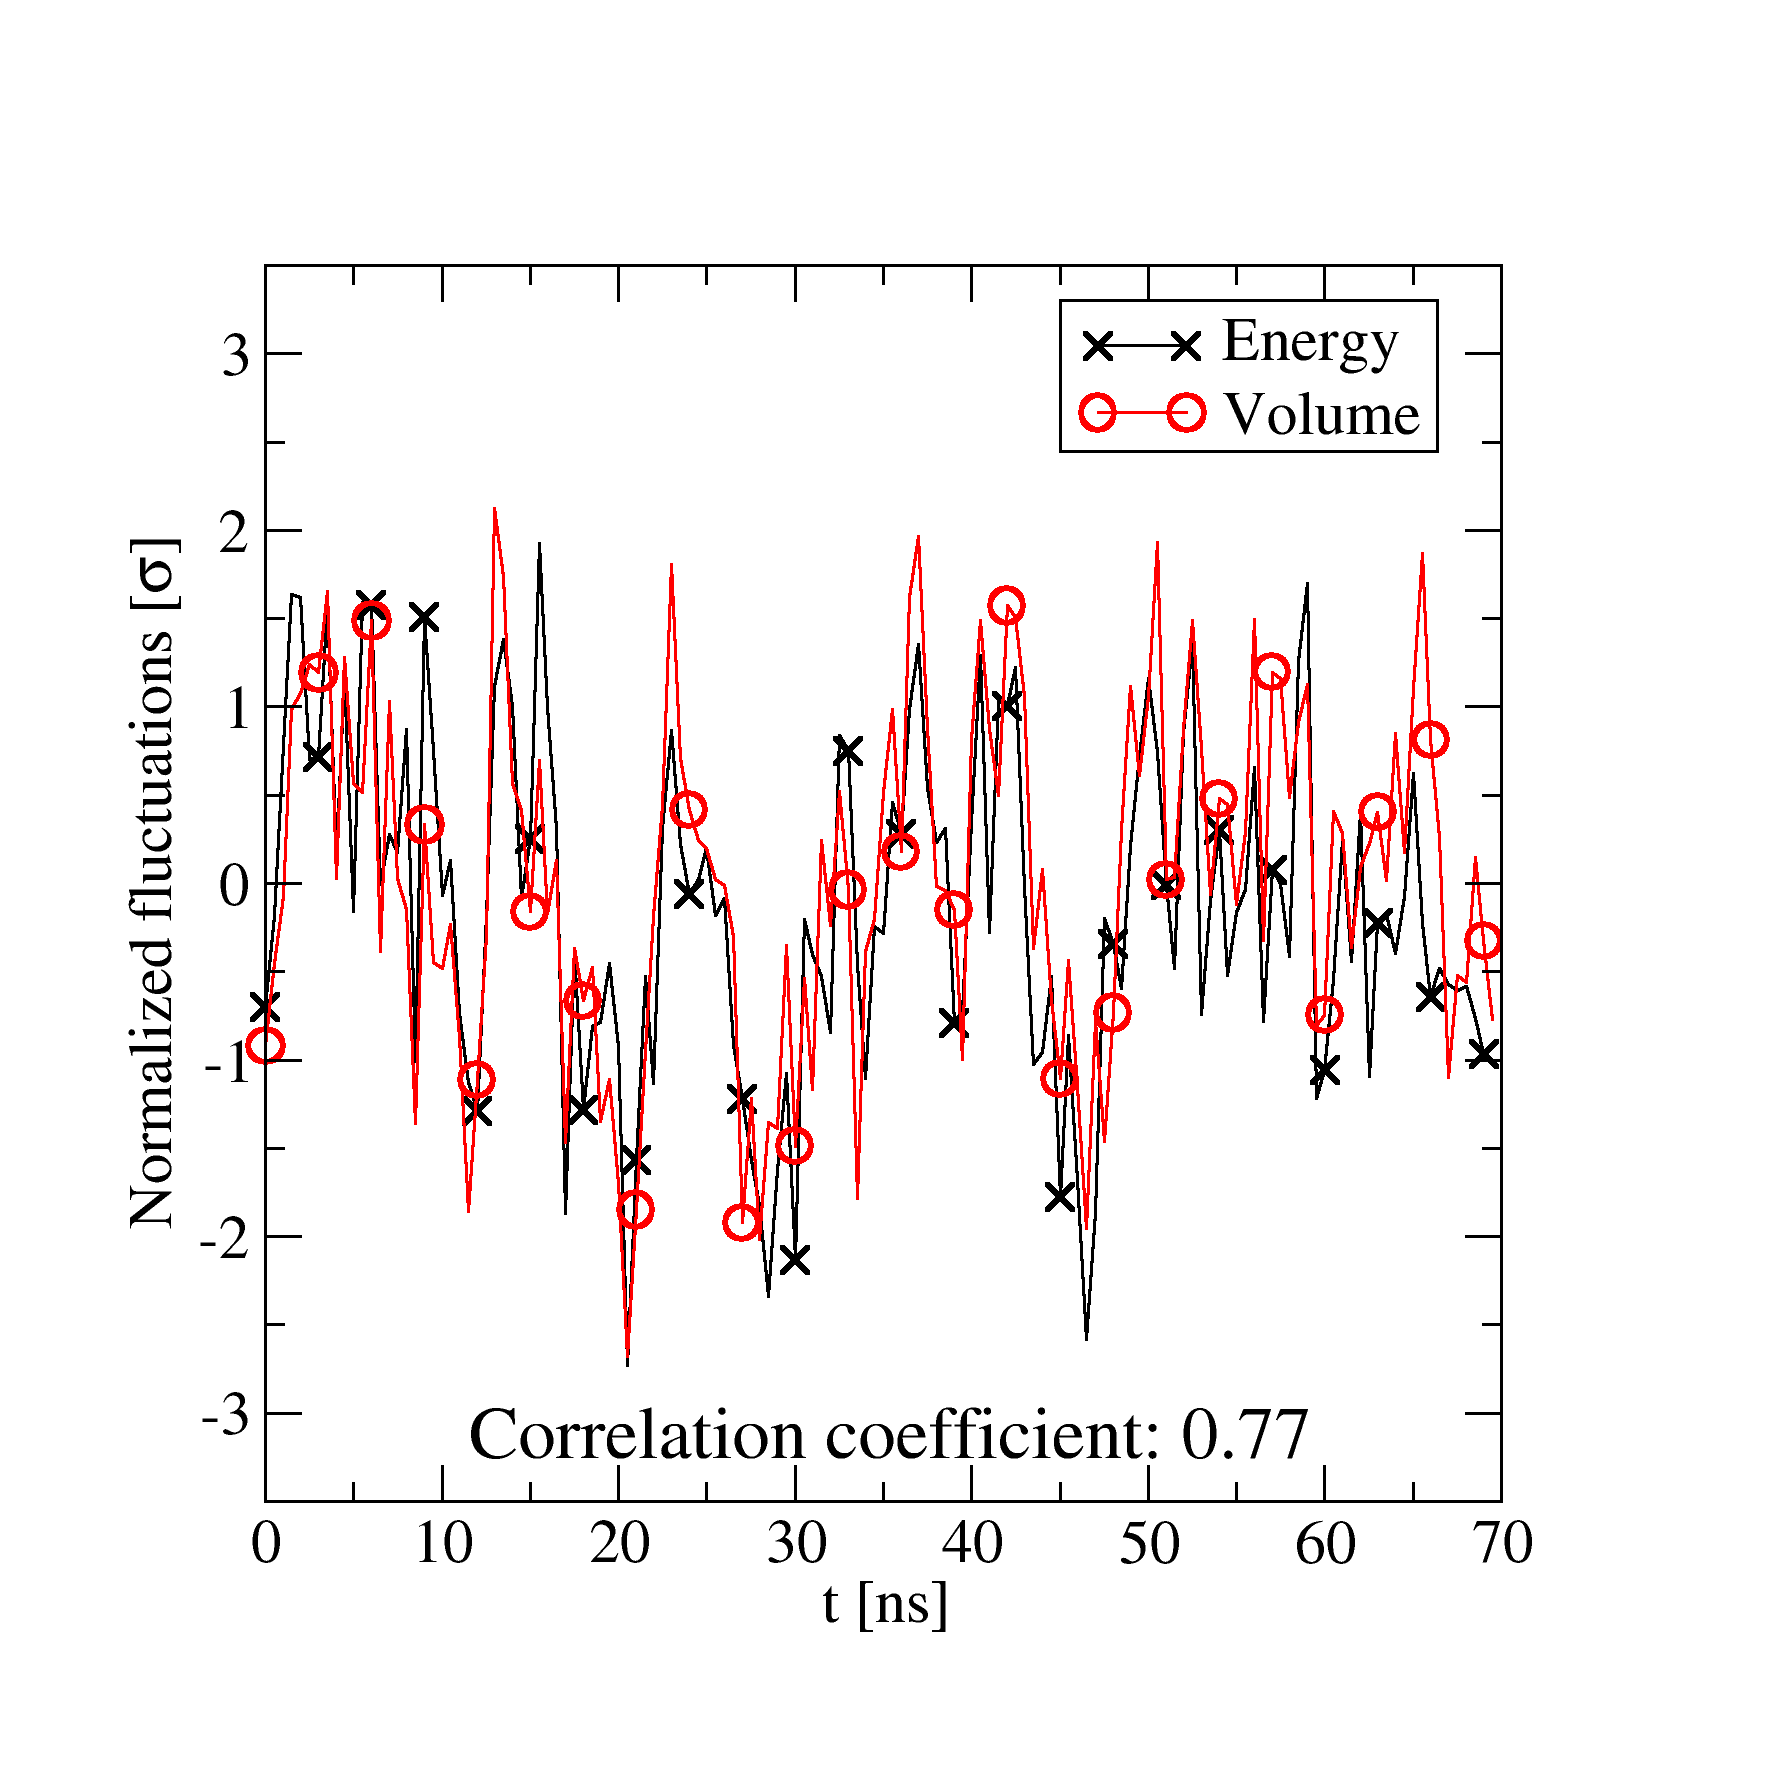
First, we consider the fluid DMPC-f membrane shown in Figure 1A. Instantaneous fluctuations of volume and energy do not show any significant correlation (data not shown). This is not surprising, since a significant part of the simulation box is water, and water is known not to correlate Pedersen2008PhysRev . However, if fluctuations are averaged over time windows of 0.5 nanosecond, volume and energy correlate strongly as shown in Figure 2A. This is quantified by the correlation coefficient,
| (1) |
where the bar here and henceforth indicates a 0.5 ns average. corresponds to no correlation, whereas corresponds to perfect correlation. We will refer to as strong correlation. For comparison, the correlation coefficient without averaging () is 0.35.
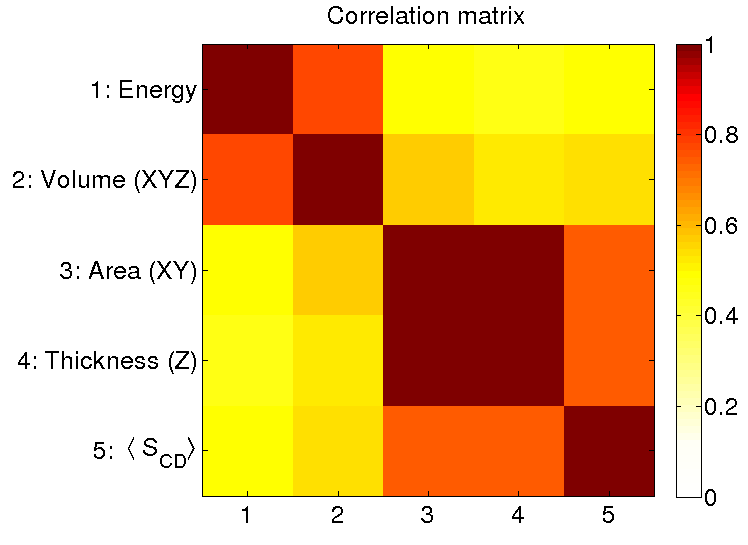
It is an appealing idea to establish a direct connection between thermodynamic properties and microscopic structures, and several studies have focused on the ordering of the acyl chains as the important microscopic structure nagle1980 ; baron2006 . Following this philosophy, one possible explanation for the observed strong correlation is that the order of the acyl chains is the single parameter controlling the fluctuations: If chains, as a result of a thermal fluctuation, become more ordered, one expects: decrease of energy, , volume, , and area, , but increase of thickness, , and . We find and . Thus, the correlation has the expected sign, but it is significantly weaker than . The same is the case for and . Figure 2B shows the full correlation matrix. Clearly, a single parameter description is not sufficient. We need two parameters to describe the fluctuations: one parameter controlling and and one “geometrical” parameter controlling , , and .
Table 1B shows that DMPC-f, DPPC-g, DPPC-g, DMPG, DMPS, and DMPSH all have strong volume-energy correlation (). The volumes of DMPC-g and DMPS show weaker correlation with energy. To show that this finding is not due to uncertainty from random noise, we estimated the error bar as follows: Two of the simulations, DMPC-f and DPPC-f, are about three times longer than the remaining five simulations. We used these two long simulations to estimate the error bar of the calculated correlation coefficients by dividing them into three blocks of 40 ns (regarded as uncorrelated blocks) flyvbjerg1989 . The standard deviation of the correlation coefficient is 0.03 and 0.10 for DMPC-f and DPPC-f, respectively – or about 0.07 on average. Each of the five short runs corresponds to a single block, and thus we estimate the error bar of these to be about 0.07 (within a 67% confidence interval). For the two longer runs we use the rule and estimate an error bar of 0.07/=0.04. Thus, the uncertainty is smaller than the spread amongst ’s, and the weak - correlation of the DMPC-g and DMPS membranes is genuine – a point returned to later.
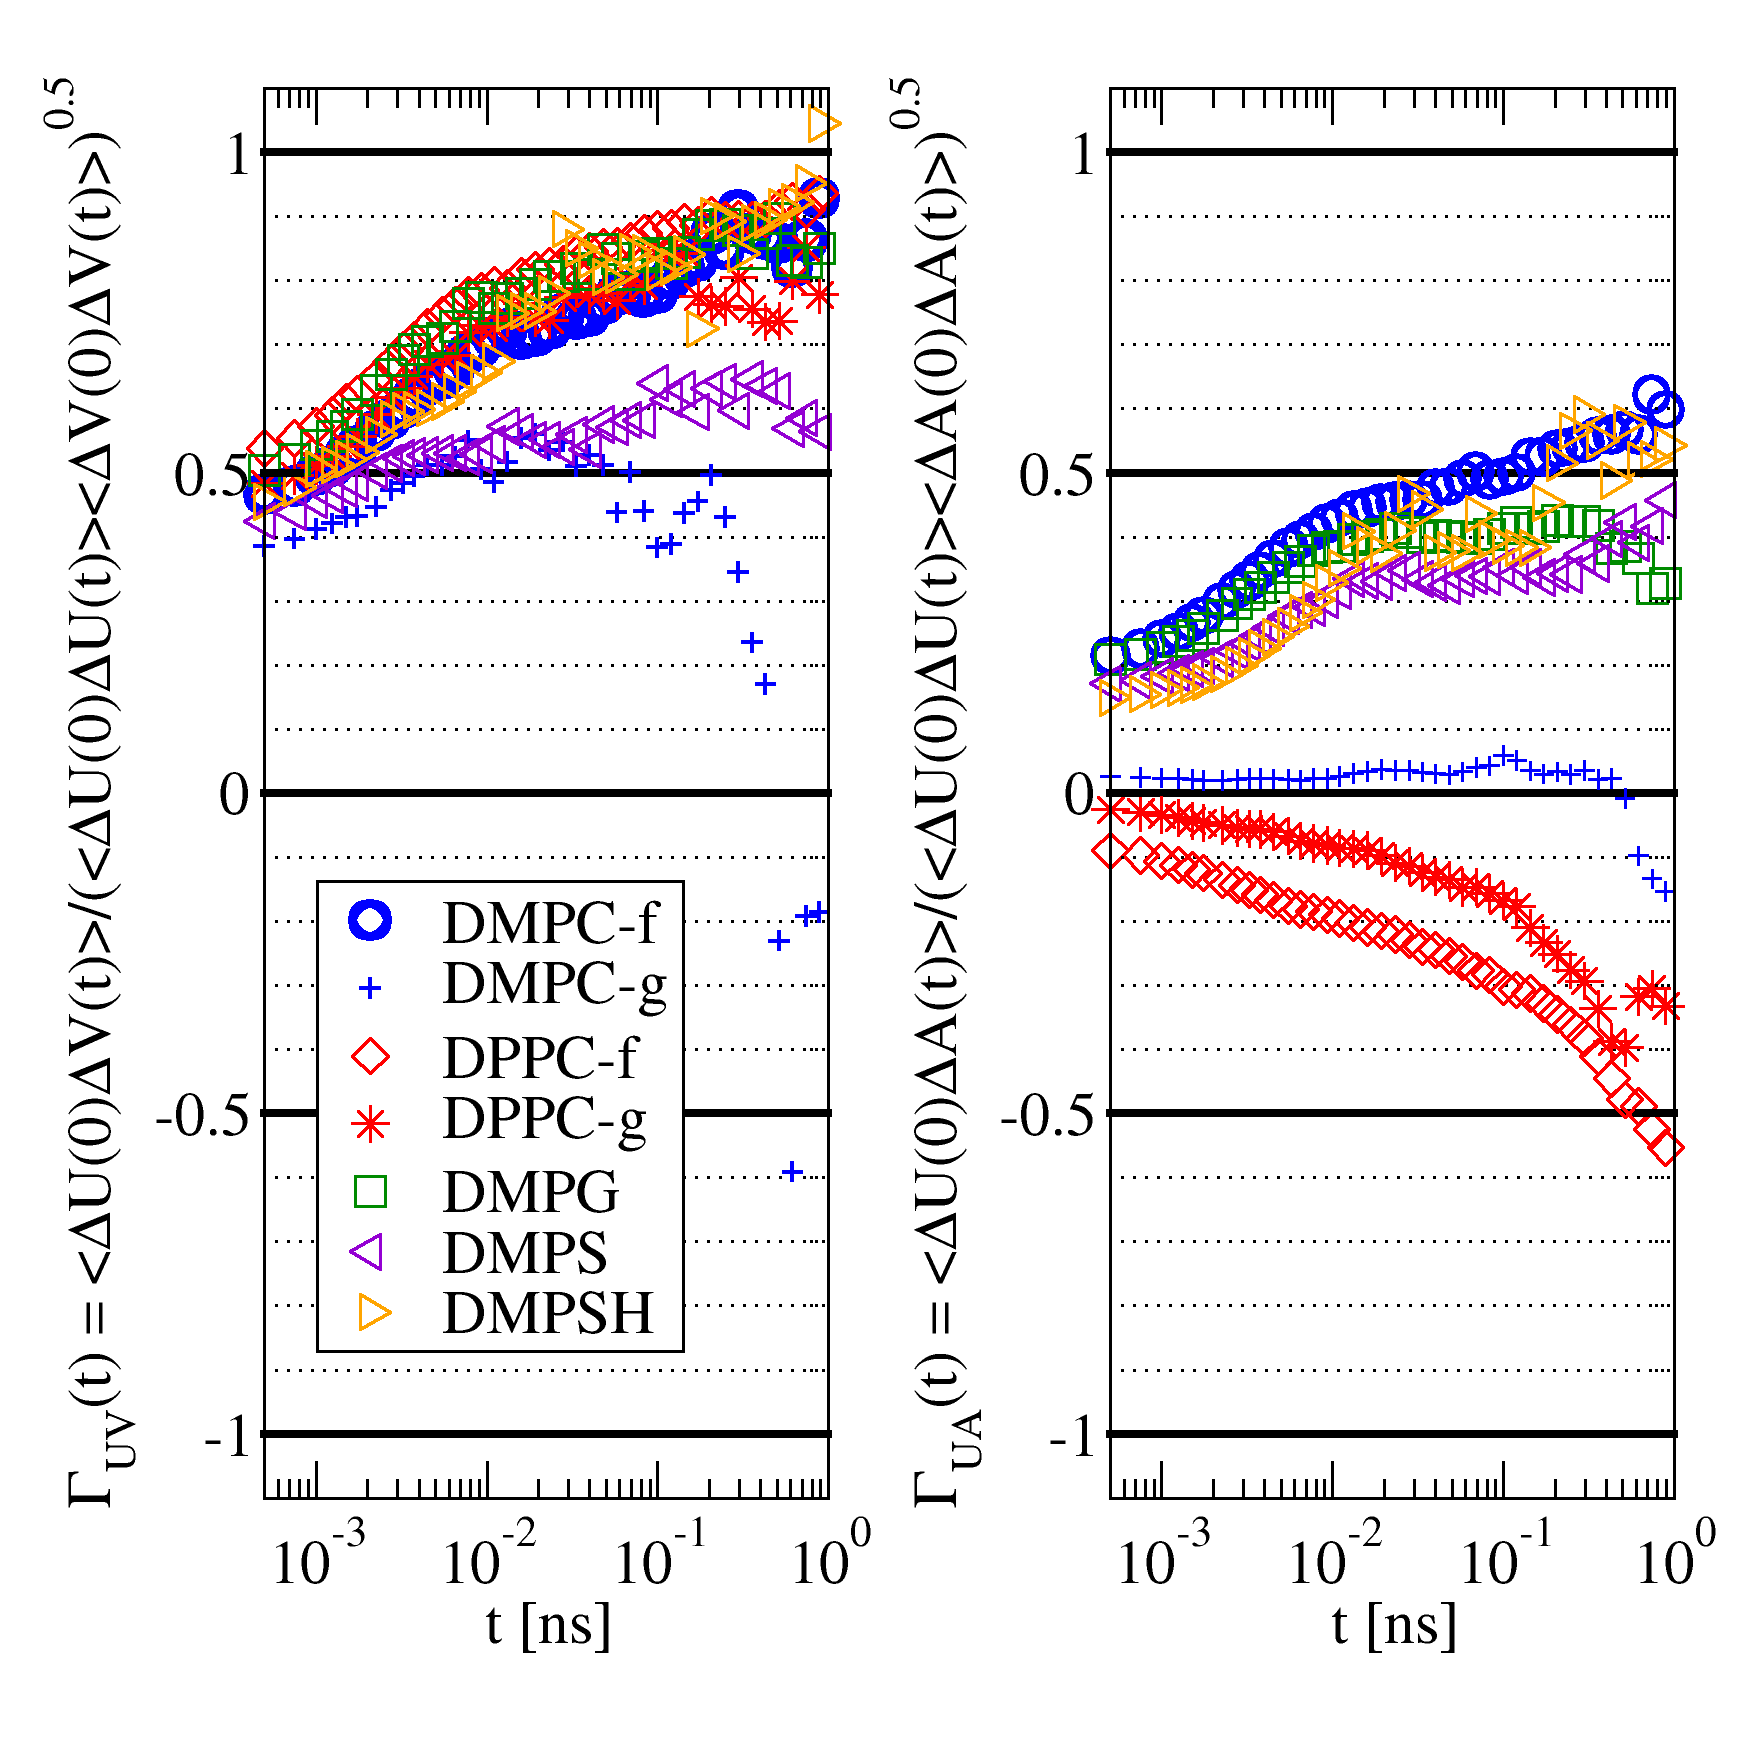
The term “slow fluctuations” has so far been defined via the 0.5 ns averaging time window (indicated with a bar). A more general approach is to investigate the following time-dependent correlation coefficient
| (2) |
Similarly, one defines the time-dependent energy-area correlation coefficient . Figure 3 shows and for all seven investigated system. In contrast to , we observe strong correlation on long time scales for () for the five membranes where slow fluctuations of and correlate strongly consistent with (Table 1B). In the following section, the slow parts of the volume and energy fluctuations are investigated via the autocorrelation functions and .
II.1 Locating the slow volume and energy fluctuations
A membrane is a highly heterogeneous system heimburg2007book , and it is reasonable to divide it into regions baron2006 . In the following three regions are defined: , , and , where (tail) refers to the hydrophobic acyl-chain atoms (i.e., atoms of methylene- and methyl groups in the acyl chain), (head) refers to the hydrophilic lipid atoms (the remaining of the lipid atoms), and refers to the water atoms (and counter ions). To identify the origin of the slow volume fluctuations, we construct Voronoi polyhedra Voronoi1908 of heavy atoms (i.e., ignoring hydrogen) and sum the Voronoi volumes for the regions , and . In this way, the total volume of the simulation box is divided into three terms,
| (3) |
The auto-correlation function of the volume in Equation 2 can now be split into a sum of three auto- and three cross-correlation functions,
| (4) | |||||
Figure 4A shows these six functions for the DMPC-f membrane. The only nonvanishing function at long times (responsible for the slow fluctuations) is the auto-correlation function of the hydrophobic (tail) part of the membrane, . This is quantified by being close to unity.
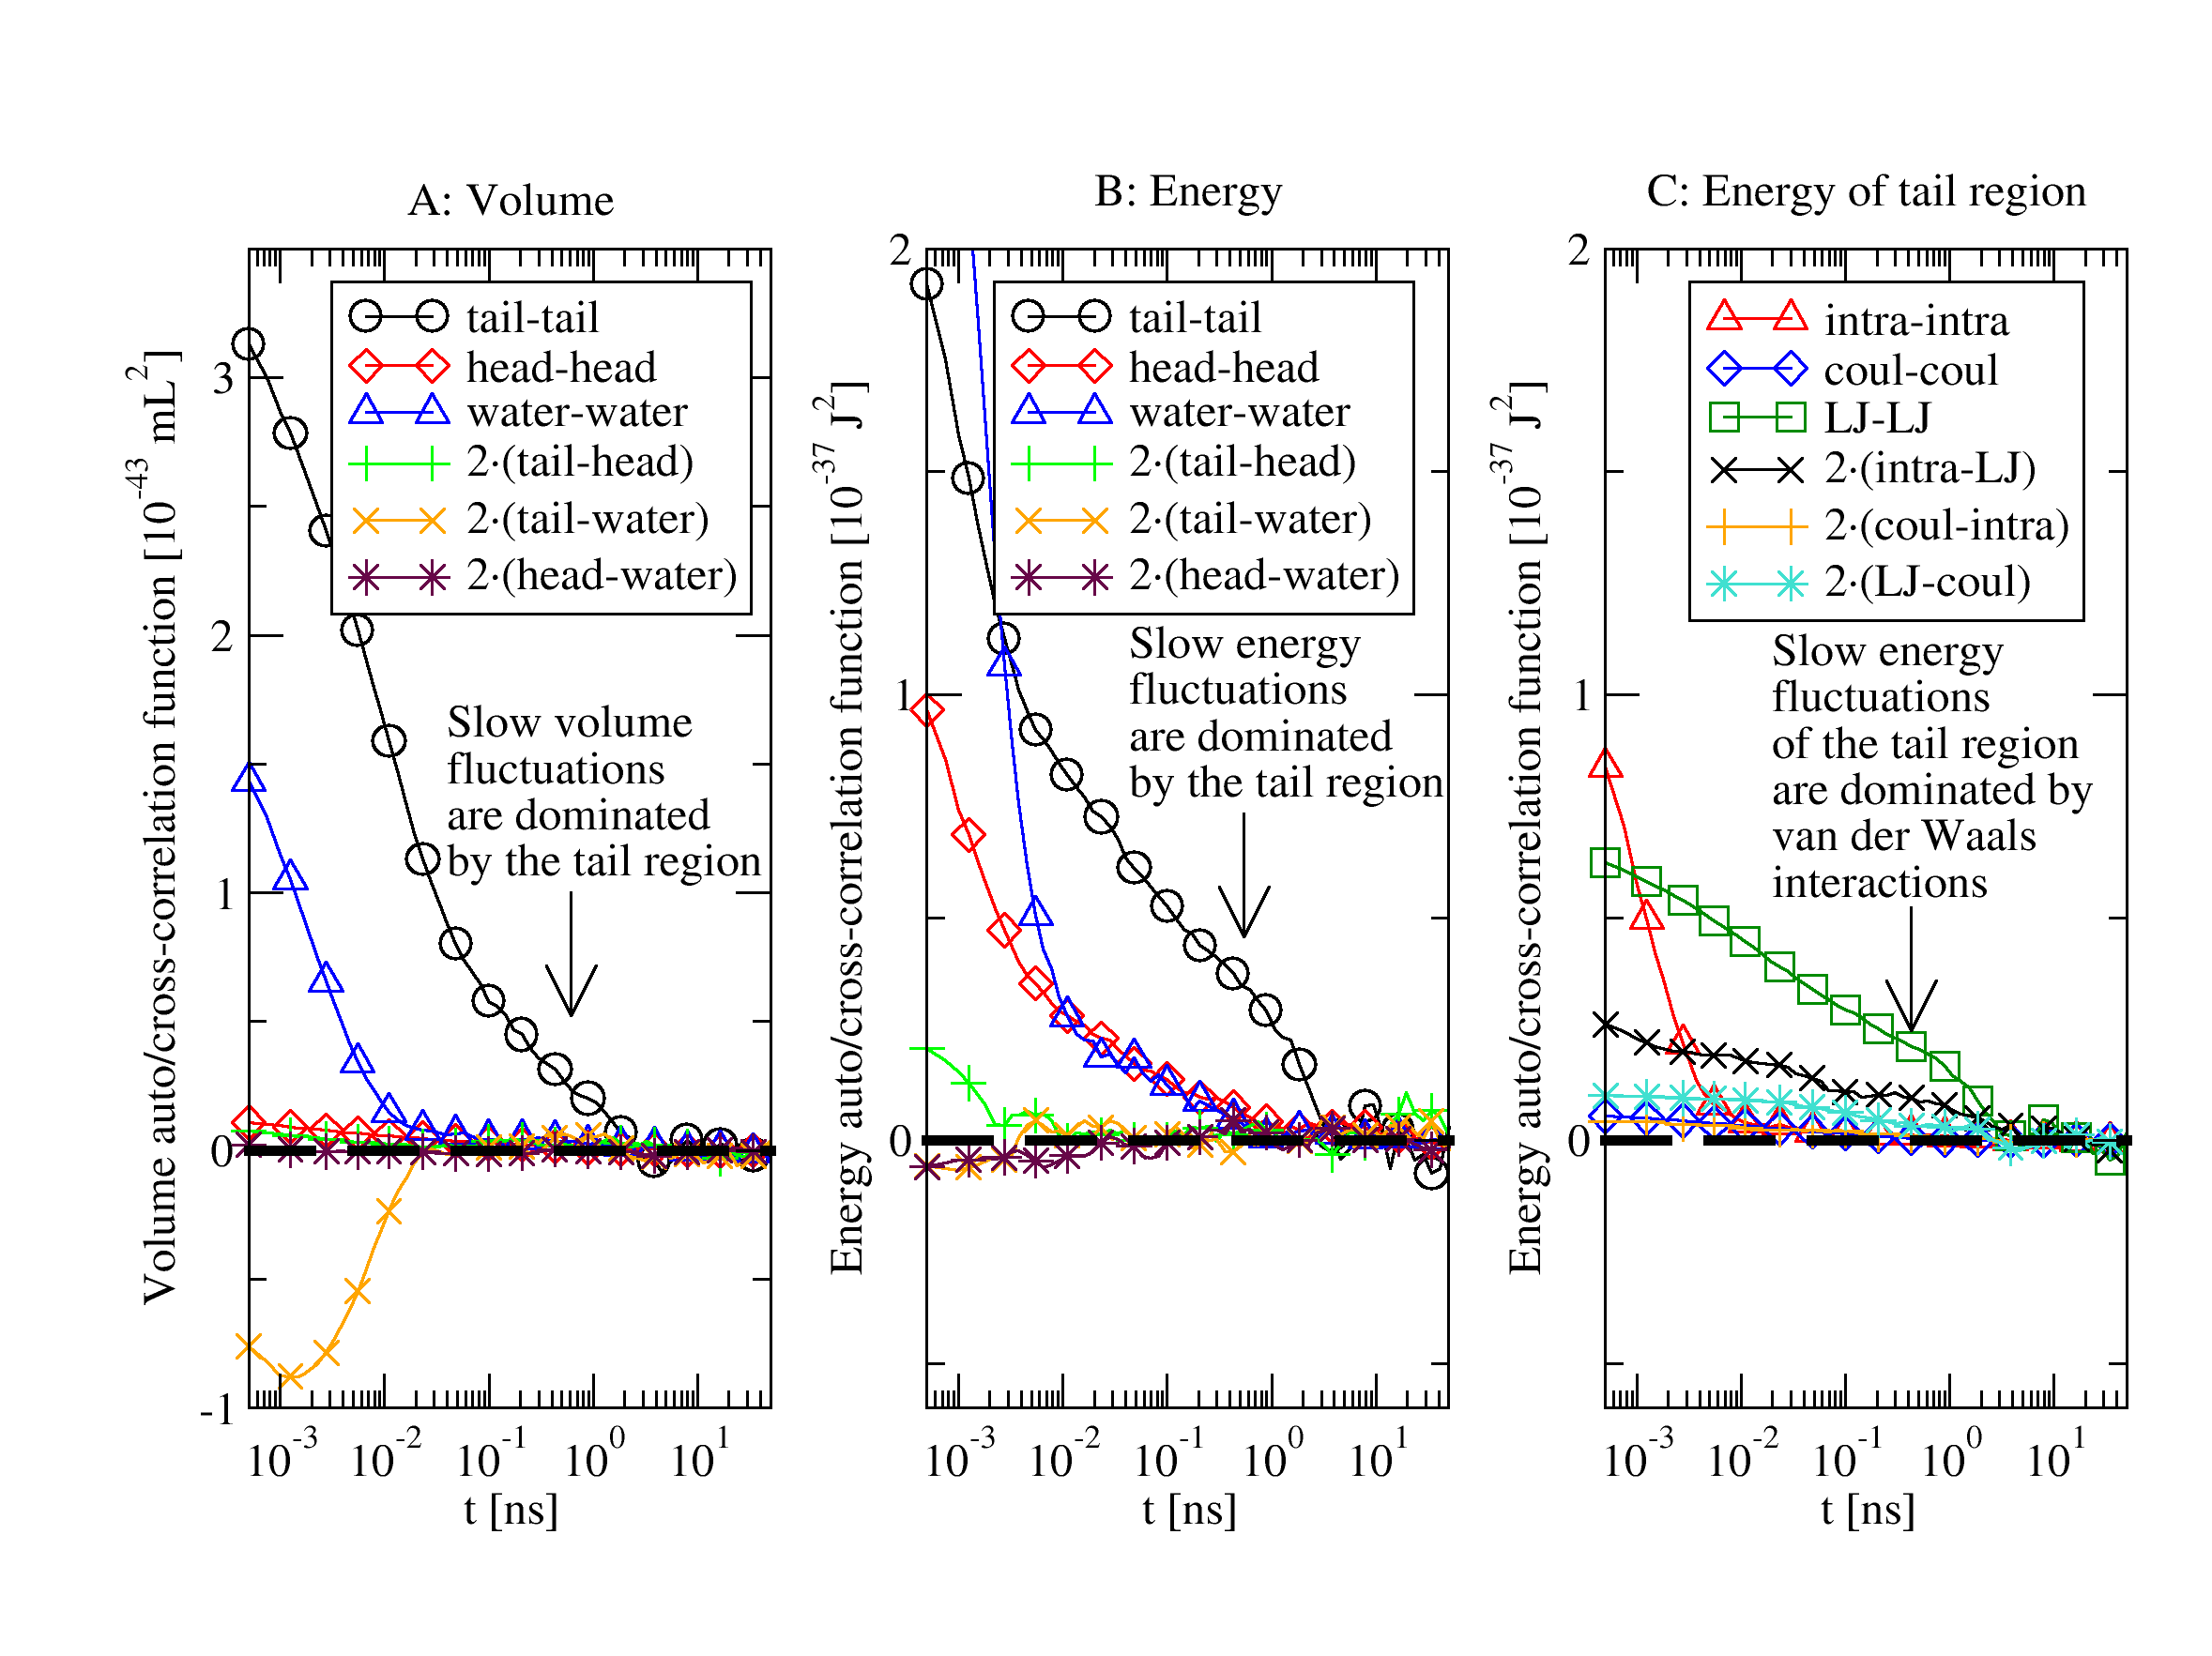
The short time cross correlation between water and the tail region is significant and negative. This is, however, probably a spurious consequence of the Voronoi construction between neighboring groups of different size: When a water molecule approaches the boundary of the tail region it gains an (unfair) increase of the Voronoi volume, due to methylene groups being larger than water molecules. This show up as a negative correlation since the water molecule “steals” volume from the methyl groups, however, only at short times ( ns).
In the simulation, the potential energy of the system consists of a sum of Lennard-Jones terms, Coulomb pair energy terms, and intramolecular binding-energies:
| (5) |
where are Lennard-Jones terms (van der Waals interactions), are Columbic terms and is a sum of the reminder terms (which are intramolecular; harmonic bonds, angles, dihedrals and improper dihedrals). Again, we split the total potential energy into contributions from regions of tails, heads and water,
| (6) |
where
| (7) |
with either tails, heads or water.
As for the volume, the auto-correlation function of the energy fluctuations in Equation 2 is also split into a sum of three auto- and three cross correlation functions,
| (8) | |||||
Figure 4B shows the six auto- and cross correlation functions of , and . Again, the slow fluctuations are dominated by the tail region. It should be noted, though, that the slow tail-tail correlation is not quite as dominating, as for the volume fluctuations. This is quantified by (1B) not being as close to unity as : thus, slow energy fluctuations of the head- and water region are significant (in contrast to slow volume fluctuations of the head and water region).
Figure 4C shows the auto- and cross-correlation functions corresponding to an additional splitting of the tail energy into “intramolecular interactions”, “Coulombic interactions” and “van der Waals interactions” given in Equation 7. The van der Waals energies dominate the energy fluctuations of the tail region.
III Discussion
In the previous section, it was demonstrated that slow energy-volume correlation (of some membranes) originates from van der Waals interactions in the tail region; thus:
| (9) |
where
| (10) |
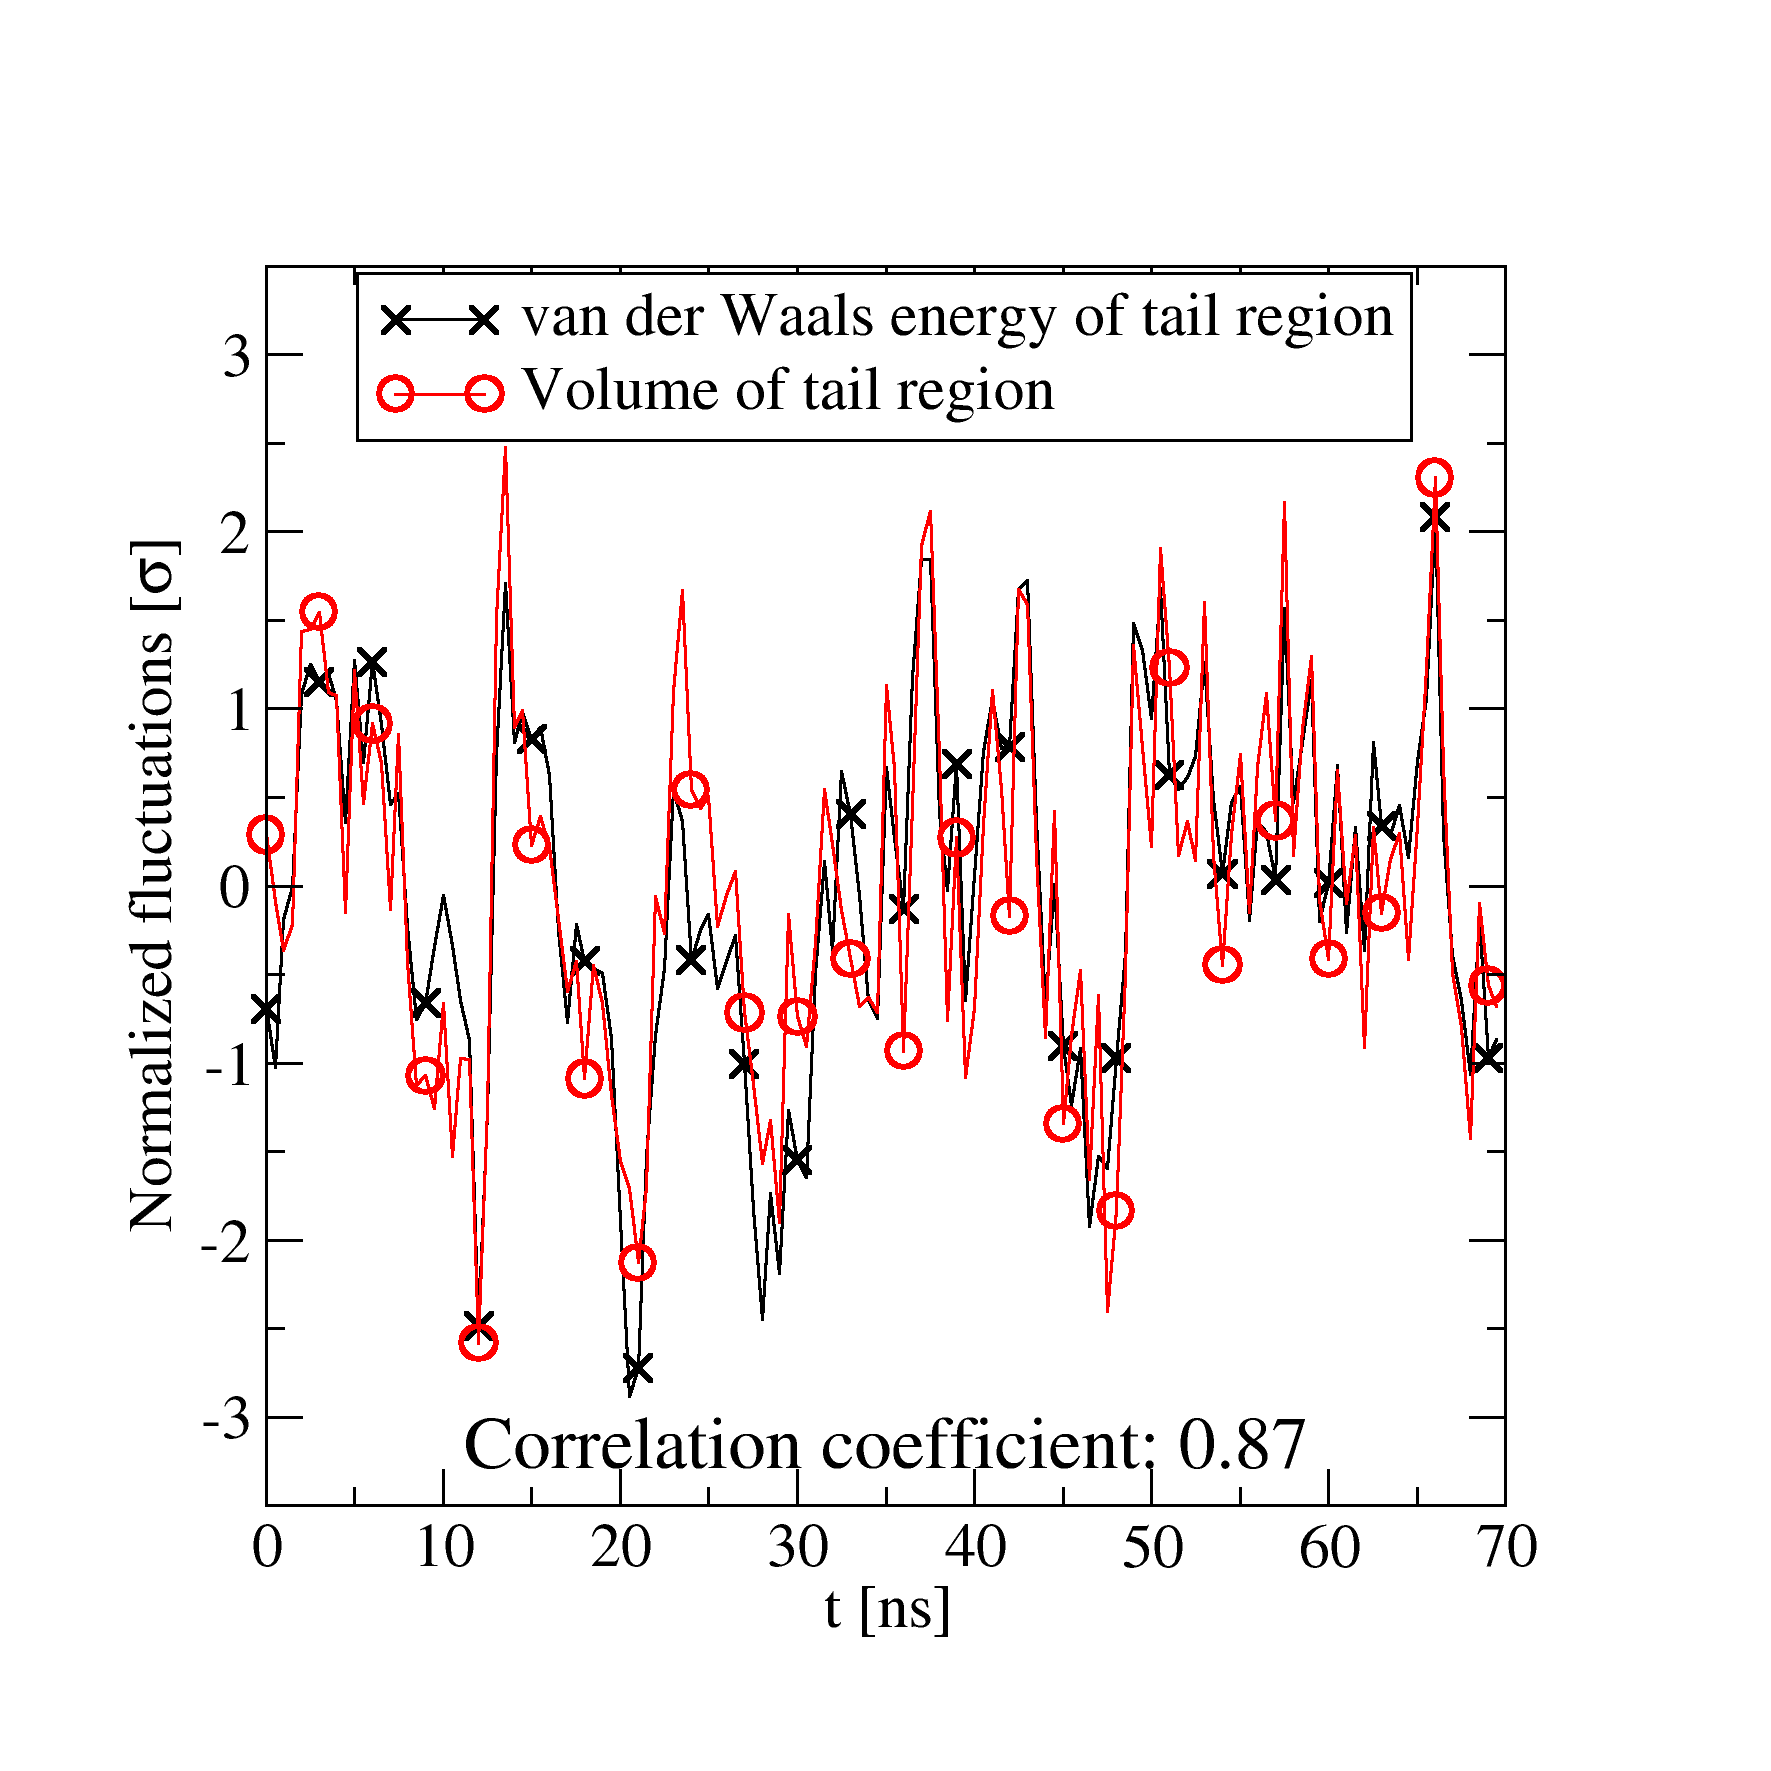
This is consistent with our findings for simple strongly correlating liquids Bailey2008A ; Bailey2008B . It should be remembered, however, that Equation 9 neglected the energy terms and with some significance. If we correlate the slow fluctuations (defined as a 0.5 ns average) of the Voronoi volume of the tail region and the van der Waals energy of the tail region, we find a correlation coefficient of 0.87, as shown in Figure 5. The same number for the fluctuations for whole simulation box was 0.77. The loss of correlation is associated with the neglected energy terms. Consistent with this, Table 1B shows a general correlation between and , e.g. for the weakly correlated membranes, DMPS and DMPC-g, both and have low values. Apparently, slow energy fluctuations of the head region ruins the - correlation. A better understanding of how this loss of correlation is related to various lipid head groups deserves future study.
It is convenient to define a volume-energy scaling factor via
| (11) |
so that if then . For the seven membranes, given in Table 1, we find that ranges from mL/J (DMPC-g) to mL/J (DMPSH). This scaling factor is indirectly accessible though experiments: Close to the phase transition temperature curves of excess enthalpy and volume can be superimposed Ebel2001 . Heimburg showed that such a relation is trivial if excess volume and enthalpy of relevant micro states are proportional Heimburg1998 : . The inverse - scaling factor can be written as . Since 1 atm J/mL is much smaller than J/ml (a typical value as seen in Table 1) then and the contribution to enthalpy is negligible. Moreover, the excess volume and enthalpy of the phase transition is expected to be related to the slow equilibrium fluctuations close to the transition. Thus, the scaling factor calculated from equilibrium simulations (Equation 11) is closly related to the (experimental) “phase transition” scaling factor and we expect them to have the same value. In agreement with this, Ebel, Grabitz and Heimburg Ebel2001 reports a scaling factor of mL/J and mL/J for large unilamellar vesicles of DMPC and DPPC, respectively – only slightly smaller than our findings of mL/J and mL/J, respectively (Table 1B). This supports that we have identified the microscopic origin of the scaling of the phase transition.
We find strong energy-volume correlations in both the fluid and ordered phases. The proportionality constant , however, is not the same in both phases (Table 1B), but is about of the fluid value in the ordered phase. Ebel, Grabitz and Heimburg Ebel2001 reported a similar decrease (65%; multilamellar vesicles of DMPC or DPPC) when comparing scaling factors of the pretransition with the main transition. This suggests that the configuration of the ordered membranes (DMPC-g and DPPC-g) is related to the pretransition, and that the nature of the correlations changes when passing the phase transition. Interestingly, this is in contrast to our earlier findings for crystallization of the standard Lennard-Jones liquid Bailey2008A ; Bailey2008B . More work is needed to clarify the cause of this difference between biomembranes and simple liquids.
Biologically relevant membranes are mixtures of many sorts of amphiphilic molecules and are far more complex than the membranes studied here. The origin of the strong correlations is, however, not specific, but reflects the van der Waals bonded nature of the core of the membranes. Thus, biologically relevant membranes most likely also exhibit strong correlations. How solutes in membranes effects the volume-energy correlation is an interesting subject for a future study. Another concern could be the finite size of the simulated membranes, since fluctuations on length scales larger than the length of simulations box cannot be represented feller1996 . Again, since the origin of strong - correlations is intrinsic to van der Waals interactions Pedersen2008PhysRev ; Pedersen2008PhysRevE , the correlations is not expected to be affected by the size.
One caveat is that although we do observe some correlation between lipid area and energy fluctuations, the correlation is weaker than the volume-energy correlation. This does not agree with the conjecture of Heimburg and coworkers Heimburg2005 ; Heimburg1998 ; Andersen2009 . Their conjecture depends on the membrane being close to the phase transition, and, it is possible that such strong - correlation appears only when approaching the phase transition. This can be investigated by evaluating the slow - correlation coefficient as a function of temperature. Also, it is possible that such a correlation only appears on even slower times-scales (e.g. s).
IV Conclusions
This paper reports a study of thermodynamic equilibrium fluctuations of phospholipid membranes. On long time scales, we identify strong volume-energy correlations of a kind that were previously only observed for simple model liquids Pedersen2008PhysRevE ; Pedersen2008PhysRev . These correlations are mainly documented for the fluid phase, but we also show that they exist in the ordered phase.
It may seem surprising that a complex system like a biomembrane exhibits such strong thermodynamic correlations. The identification of the origin of the correlations as deriving from the van der Waals interactions of the hydrophobic part of the membrane, however, points to a common origin of strong thermodynamic correlations in simple van der Waals liquids and biomembranes. This is consistent with the finding that there are strong energy-volume correlations in both fluid and ordered phases: The correlations do not depend on the degree of chain order, just as for simple liquids where the strong correlations survive crystallization Bailey2008A ; Bailey2008B . We find weaker correlation between energy/volume and “geometrical” order parameters such as membrane area, thickness, and (characterizing ordering of acyl-chains). Thus, one parameter is not sufficient to describe thermodynamic fluctuations.
Regarding the Heimburg-Jackson nerve signal theory, our findings largely confirm one crucial assumption of this theory, namely that volume and energy (enthalpy) correlate for microstates. We find strong correlations only on the nanosecond and longer time scales, which are, however, precisely the relevant times for nerve signals.
V acknowledgement
The authors wish to thank Richard M. Venable for providing a configuration of an ordered membrane. NAMD was developed by the Theoretical and Computational Biophysics Group in the Beckman Institute for Advanced Science and Technology at the University of Illinois at Urbana-Champaign. The Centre for Viscous Liquid Dynamics “Glass and Time” and the Centre for Biomembrane Physics “MEMPHYS” are both sponsored by the Danish National Research Foundation. Simulations were performed at the Danish Center for Scientific Computing at the University of Southern Denmark.
References
- [1] T. Heimburg and A. D. Jackson. On soliton propagation in biomembranes and nerves. Proc. Natl. Acad. Sci. U. S. A., 102(28):9790–9795, 2005.
- [2] T. Heimburg and A. D. Jackson. The thermodynamics of general anesthesia. Biophys. J., 92(9):3159–3165, 2007.
- [3] S. L. A. Andersen, A. D. Jackson, and T. Heimburg. Towards a thermodynamic theory of nerve pulse propagation. Prog. Neurobiol., 88:104–113, 2009.
- [4] A. L. Hodgkin and A. F. Huxley. A Quantitative Description of Membrane Current and its Application to Conduction and Excitation in Nerve. J. Physiol. (London), 117(4):500–544, 1952.
- [5] L. K. Nielsen, T. Bjørnholm, and O. G. Mouritsen. Thermodynamic and real-space structural evidence of a 2D critical point in phospholipid monolayers. Langmuir, 23(23):11684–11692, 2007.
- [6] T. Heimburg. Mechanical aspects of membrane thermodynamics. Estimation of the mechanical properties of lipid membranes close to the chain melting transition from calorimetry. Biochim. Biophys. Acta, Biomembr., 1415(1):147–162, 1998.
- [7] H. Ebel, P. Grabitz, and T. Heimburg. Enthalpy and volume changes in lipid membranes. I. The proportionality of heat and volume changes in the lipid melting transition and its implication for the elastic constants. J. Phys. Chem. B, 105(30):7353–7360, 2001.
- [8] R. Dimova, B. Pouligny, and C. Dietrich. Pretransitional effects in dimyristoylphosphatidylcholine vesicle membranes: Optical dynamometry study. Biophys. J., 79(1):340–356, 2000.
- [9] U. R. Pedersen, N. P. Bailey, T. B. Schrøder, and J. C. Dyre. Strong pressure-energy correlations in van der waals liquids. Phys. Rev. Lett., 100(1):015701, 2008.
- [10] U. R. Pedersen, T. Christensen, T. B. Schrøder, and J. C. Dyre. Feasibility of a single-parameter description of equilibrium viscous liquid dynamics. Phys. Rev. E, 77:011201, 2008.
- [11] N. P. Bailey, U. R. Pedersen, N. Gnan, T. B. Schrøder, and J. C. Dyre. Pressure-energy correlations in liquids. I. Results from computer simulations. J. Chem. Phys., 129(18):184507, 2008.
- [12] N. P. Bailey, U. R. Pedersen, N. Gnan, T. B. Schrøder, and J. C. Dyre. Pressure-energy correlations in liquids. II. Analysis and consequences. J. Chem. Phys., 129(18):184508, 2008.
- [13] N. P. Bailey, T. Christensen, B. Jakobsen, K. Niss, N. B. Olsen, U. R. Pedersen, T. B. Schrøder, and J. C. Dyre. Glass-forming liquids: one or more ‘order’ parameters? J. Phys.: Condens. Matter, 20:244113, 2008.
- [14] S. E. Feller, Y. H. Zhang, R. W. Pastor, and B. R. Brooks. Constant-Pressure Molecular-Dynamics Simulation - The Langevin Piston Method. J. Chem. Phys., 103(11):4613–4621, 1995.
- [15] M. P. Allen and D. J. Tildesley. Computer Simulations of Liquids. Oxford Science Publications, 1987.
- [16] W. Kob and H. C. Andersen. Scaling behavior in the -relaxation regime of a supercooled Lennard-Jones mixture. Phys. Rev. Lett., 73(10):1376–1379, 1994.
- [17] I. Prigogine and R. Defay. Chemical thermodynamics. Longmans, Green and Co, New York, 1954.
- [18] R. O. Davies and G. O. Jones. The irreversible approach to equilibrium in glasses. Proc. R. Soc. London, Ser. A, 217(1128):26–42, 1953.
- [19] N. L. Ellegaard, T. E. Christensen, P. V. Christiansen, N. B. Olsen, U. R. Pedersen, T. Schrøder, and J. C. Dyre. Single-order-parameter description of glass-forming liquids: A one-frequency test. J. Chem. Phys., 126(074502):074502, 2007.
- [20] CA Angell. Relaxation in Liquids, Polymers and Plastic Crystals - Strong Fragile Patterns and Problems. J. Non-Cryst. Solids, 131(Part 1):13–31, 1991.
- [21] C. M. Roland, S. Hensel-Bielowka, M. Paluch, and R. Casalini. Supercooled dynamics of glass-forming liquids and polymers under hydrostatic pressure. Rep. Prog. Phys., 68(6):1405–1478, 2005.
- [22] T. B. Schrøder, U. R. Pedersen, and J. C. Dyre. Density scaling as a property of strongly correlating viscous liquids. Phys. Rev. E, 80:041502, 2009.
- [23] T. B. Schrøder, N. P. Bailey, U. R. Pedersen, N. Gnan, and J. C. Dyre. Pressure-energy correlations in liquids. III. Statistical mechanics and thermodynamics of liquids with hidden scale invariance. J. Chem. Phys. (in press), page preprint: arXiv:0906.0025, 2009.
- [24] W. H. de Jeu, B. I. Ostrovskii, and A. N. Shalaginov. Structure and fluctuations of smectic membranes. Rev. Mod. Phys., 75(1):181–235, 2003.
- [25] H. Bolterauer, J. A. Tuszynski, and M. V. Sataric. Frohlich and Davydov Regimes in The Dynamics of Dipolar Oscillations of Biological-Membranes. Phys. Rev. A, 44(2):1366–1381, 1991.
- [26] S. E. Feller and R. W. Pastor. On simulating lipid bilayers with an applied surface tension: Periodic boundary conditions and undulations. Biophys. J., 71(3):1350–1355, 1996.
- [27] R. Baron, A. H. de Vries, P. H. Huenenberger, and W. F. van Gunsteren. Configurational entropies of lipids in pure and mixed bilayers from atomic-level and coarse-grained molecular dynamics simulations. J. Phys. Chem. B, 110(31):15602–15614, 2006.
- [28] T. Heimburg. Thermal Biophysics of Membranes. Wiley, 2007.
- [29] J. F. Nagle. Theory of the Main Lipid Bilayer Phase-Transition. Annu. Rev. Phys. Chem., 31:157–195, 1980.
- [30] R. T. Zhang, W. J. Sun, S Tristramnagle, R. L. Headrick, R. M. Suter, and J. F. Nagle. Critical Fluctuations in Membranes. Phys. Rev. Lett., 74(14):2832–2835, 1995.
- [31] B. Q. Jin and A. J. Hopfinger. Characterization of lipid membrane dynamics by simulation .1. Torsion angle motions of the linear chains. Biopolymers, 41:37–50, 1997.
- [32] U. R. Pedersen, G. H. Peters, T. B. Schrøder, and J. C. Dyre. Volume-energy correlations in the slow degrees of freedom of computer-simulated phospholipid membranes. AIP Conf. Proc., 982(1):407–409, 2008.
- [33] U. R. Pedersen, C. Leidy, P. Westh, and G. H. Peters. The effect of calcium on the properties of charged phospholipid bilayers. Biochim. Biophys. Acta, Biomembr., 1758(5):573–582, 2006.
- [34] J. Sonne, M. O. Jensen, F. Y. Hansen, L. Hemmingsen, and G. H. Peters. Reparameterization of all-atom dipalmitoylphosphatidylcholine lipid parameters enables simulation of fluid bilayers at zero tension. Biophys. J., 92(12):4157–4167, 2007.
- [35] U. R. Pedersen, G. H. Peters, and P. Westh. Molecular packing in 1-hexanol-DMPC bilayers studied by molecular dynamics simulation. Biophys. Chem., 125(1):104–111, 2007.
- [36] A. D. MacKerell, D. Bashford, M. Bellott, R. L. Dunbrack, J. D. Evanseck, M. J. Field, S. Fischer, J. Gao, H. Guo, S. Ha, D. Joseph-McCarthy, L. Kuchnir, K. Kuczera, F. T. K. Lau, C. Mattos, S. Michnick, T. Ngo, D. T. Nguyen, B. Prodhom, W. E. Reiher, B. Roux, M. Schlenkrich, J. C. Smith, R. Stote, J. Straub, M. Watanabe, J. Wiorkiewicz-Kuczera, D. Yin, and M. Karplus. All-atom empirical potential for molecular modeling and dynamics studies of proteins. J. Phys. Chem. B, 102(18):3586–3616, 1998.
- [37] Jorgensen W. L., J Chandrasekhar, J. D. Madura, R. W. Impey, and M. L. Klein. Comparison of Simple Potential Functions for Simulating Liquid Water. J. Chem. Phys., 79:926–935, 1983.
- [38] J. C. Phillips, R. Braun, W. Wang, J. Gumbart, E. Tajkhorshid, E. Villa, C. Chipot, R. D. Skeel, L. Kale, and K. Schulten. Scalable molecular dynamics with namd. J. Comput. Phys., 26:283–312, 2005.
- [39] T. Darden, D. York, and L. Pedersen. Particle Mesh Ewald - An Method For Ewald Sums In Large Systems. J. Chem. Phys., 98(12):10089–10092, 1993.
- [40] U. Essmann, L. Perera, M. L. Berkowitz, T. Darden, H. Lee, and L. G. Pedersen. A Smooth Particle Mesh Ewald Method. J. Chem. Phys., 103(19):8577–8593, 1995.
- [41] R. M. Venable, B. R. Brooks, and R. W. Pastor. Molecular dynamics simulations of gel (L-beta I) phase lipid bilayers in constant pressure and constant surface area ensembles. J. Chem. Phys., 112(10):4822–4832, 2000.
- [42] A. H. de Vries, I. Chandrasekhar, W. F. van Gunsteren, and P. H. Hunenberger. Molecular dynamics simulations of phospholipid bilayers: Influence of artificial periodicity, system size, and simulation time. J. Phys. Chem., 109:11643–11652, 2005.
- [43] D. P. Tieleman and H. J. C. Berendsen. Molecular dynamics simulations of a fully hydrated dipalmitoyl phosphatidylcholine bilayer with different macroscopic boundary conditions and parameters. J. Chem. Phys., 105(11):4871–4880, 1996.
- [44] H. Flyvbjerg and H. G. Petersen. Error-Estimates On Averages Of Correlated Data. J. Chem. Phys., 91(1):461–466, 1989.
- [45] G. Voronoi. New parametric applications concerning the theory of quadratic forms - second announcement. J. Reine Angew. Math., 134:198–287, 1908.