Diffuse Extragalactic Background Radiation
Abstract
Attenuation of high–energy gamma rays by pair–production with UV, optical and IR background photons provides a link between the history of galaxy formation and high–energy astrophysics. We present results from our latest semi-analytic models (SAMs), based upon a CDM hierarchical structural formation scenario and employing all ingredients thought to be important to galaxy formation and evolution, as well as reprocessing of starlight by dust to mid- and far-IR wavelengths. Our models also use results from recent hydrodynamic galaxy merger simulations. These latest SAMs are successful in reproducing a large variety of observational constraints such as number counts, luminosity and mass functions, and color bimodality. We have created 2 models that bracket the likely ranges of galaxy emissivities, and for each of these we show how the optical depth from pair–production is affected by redshift and gamma-ray energy. We conclude with a discussion of the implications of our work, and how the burgeoning science of gamma-ray astronomy will continue to help constrain cosmology.
1 Introduction
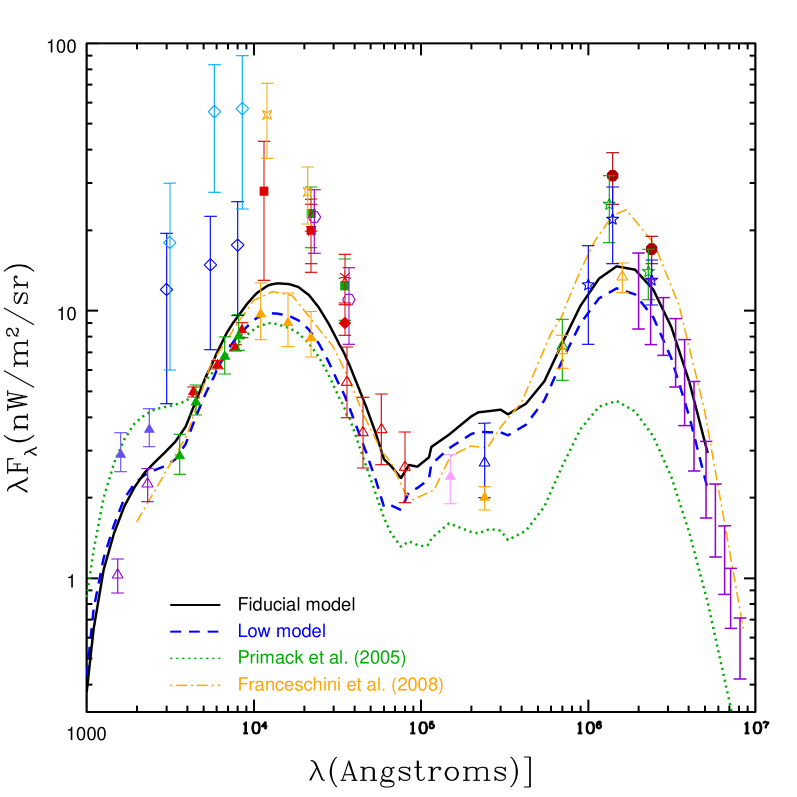
The extragalactic background light (EBL) consists of photons emitted at all epochs by stars and AGN, and subsequently modified by redshifting and dilution due to the expansion of the universe. The bulk of the EBL energy is in two peaks in wavelengths, one in the optical and near–IR consisting of direct light from stars, and another in the far–IR producing by thermal radiation from dust (see Figure 1). At still longer wavelengths, the background spectrum is dominated by the cosmic microwave background. Emissions from polycyclic aromatic hydrocarbon (PAH) molecules also form an important component at a fixed series of wavelengths in the mid–IR.
Because the production of the EBL is directly linked to the star formation history of the universe, limits on the EBL can be used to provide constraints on the history of galaxy formation and evolution. Measurement of this light through direct observation is complicated by foreground emission from our own galaxy and reflected zodiacal light from our sun, which are much brighter than the EBL across most of the optical and IR spectrum (Hauser and Dwek, 2001). Interplanetary dust is the major contributor of foreground light at most wavelengths, with starlight becoming substantial in the optical and near-IR, and the interstellar medium most important in the submillimeter regime. In a series of papers by Rebecca Bernstein (Bernstein et al., 2002a, b; Bernstein, 2007) the optical EBL was estimated by measuring the total background in 3 HST WFPC2 bands, and subtracting away the zodiacal and galactic contributions. The near-IR flux has been measured by the DIRBE instrument on the Cosmic Background Explorer (Wright and Reese, 2000; Wright, 2001; Gorjian et al., 2000; Cambrésy et al., 2001; Levenson et al., 2007), using foreground source subtraction techniques and modeling of the zodiacal light, and yielding high estimates in this range. Results from IRTS (Matsumoto et al., 2005) claimed an even higher background level below 2 m a level which would require a large contribution from an as-of-yet undetected source type. An analysis of the fluctuations observed by DIRBE (Kashlinsky and Odenwald, 2000) yielded upper limits to the EBL in the mid to far-IR, but this author’s interpretation of a high background arising from sources at has been challenged by the results of other studies Thompson et al. (2008); Cooray et al. (2007). In the far-IR regime, observations from the COBE FIRAS (Fixsen et al., 1998) and DIRBE (Hauser et al., 1998) instruments provide direct measurements of the background radiation. At shorter wavelengths (60 and 100 m) the DIRBE instrument places upper limits on the background. Analyses of the DIRBE data at far-IR wavelengths have been attempted by other authors using new models for the zodiacal light and instrument calibration (Finkbeiner et al., 2000; Lagache et al., 2000; Wright, 2004). The rather high detection claimed by Finkbeiner et al. at 60 and 100 m, which required careful subtraction of the bright foreground, has been disputed by other authors (Puget and Lagache, 2001).
Integration of galaxy counts is a way to set firm lower limits on the EBL, although the degree to which these measurements converge on the true value remains controversial. Measured luminosities of galaxies in the Hubble Deep Field (HDF) (Madau and Pozzetti, 2000) place a lower bound on EBL fluxes in the 0.4-1 m range, a much lower level than that proposed in the Bernstein papers, with 2MASS data extending counts in this paper to 3 m. It is argued in this work that the flatness of the faint counts in all bands (flatter than 0.4 on a log-counts vs. magnitude diagram) indicate convergence, and therefore a low EBL across the optical and near-IR. A similar analysis conducted using IR data from the Subaru deep field (Totani et al., 2001) modeled possible selection effects and supported the conclusion of a low optical–near-IR background compared to direct detection claims. In the UV, limits exist from GALEX (Xu et al., 2005) and observations of the HDF with the STIS instrument (Gardner et al., 2000), with the latter finding a considerably higher bound. The IRAC instrument on Spitzer has placed lower limits on several bands in the near– to mid–IR (Fazio et al., 2004), which similarly are well below the IRTS and DIRBE direct detection fluxes. In a complementary approach to their DIRBE sky-subtraction papers, Levenson and Wright used IRAC data to calculated the best-fit flux at 3.6 m using a profile-fit to estimate the light from the unobservable faint fringes of galaxies, and a broken power law model for the number count distribution (Levenson and Wright, 2008). ISOCAM and the MIPS instrument on Spitzer have reported lower limits from number counts at 15, 24, 70, and 160 m (Elbaz et al., 2002; Chary et al., 2004; Frayer et al., 2006; Papovich et al., 2004; Dole et al., 2006). Galaxy counts from the SCUBA instrument provide a lower limit at 850 microns (Coppin et al., 2006), with an estimated 20 to 30% of the background at these wavelengths resolved into point sources. Our previous EBL model Primack et al. (2005) was systematically low in the mid- and far-IR, and we warned in that publication that the model should not be trusted in this regime. Our new models, presented here, do a much better job in matching constraints from number counts.
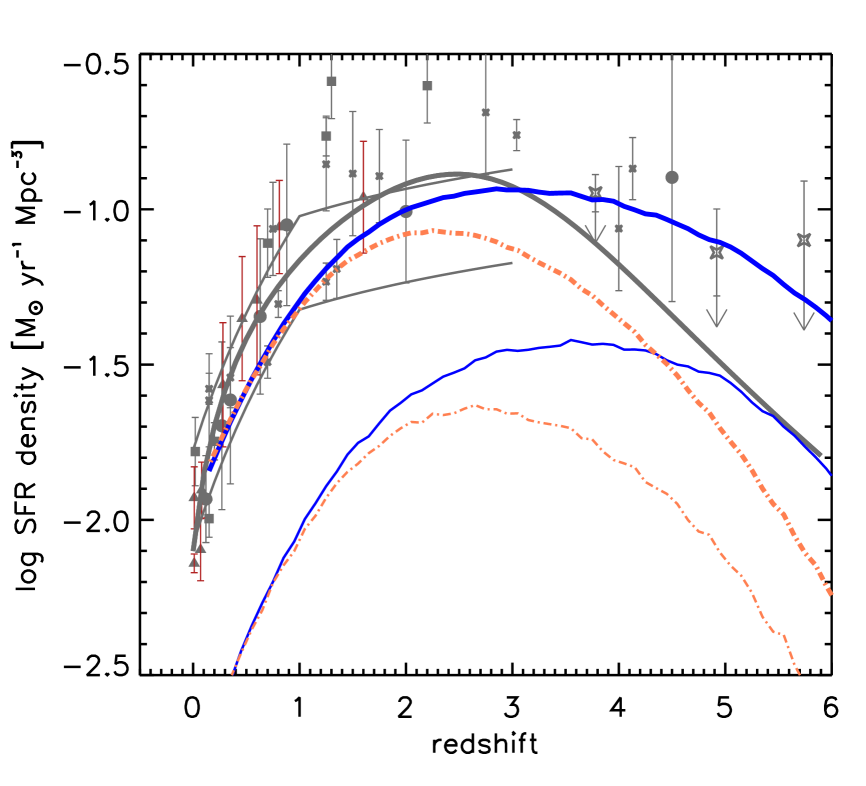
The EBL provides an important test of star-formation observations; if there is a large gap between the flux from sources in deep surveys and direct measurements, then an unresolved population must exist to provide the missing energy. The present day EBL is linked to the history of star formation through the stellar initial mass function (IMF), as well as the evolving metallicity and dust distribution, as we will discuss later. It is well established that star formation rates per unit cosmological volume were much higher in the past, peaking at roughly z2 (Hopkins, 2004; Gabasch et al., 2004).
Studies of the buildup of stellar mass have typically found that the integrated star formation rate tends to exceed stellar mass as measured by IR (fossil) light from old stars, with the discrepancy becoming worse with redshift. The local star-formation rate is typically measured from the strength of the H (Balmer) line. At higher redshift, other tracers must be used. These can include UV continuum emission corrected for dust, radio emission by supernovae remnants, emission lines which are excited by UV radiation from young stars, or measuring reprocessed light from dust in the infrared. All of these methods are fraught with uncertain amounts of contamination from quasars and biases from dust and metallicity, and different methods can produce widely varying results for the same galaxy. An overview of these issues can be found in (Hopkins and Beacom, 2006). One solution to the SFR–fossil mass discrepancy may lie in a variable IMF which suppresses formation of low mass stars in starbursts occurring primarily at higher redshift (Fardal et al., 2007; Davé, 2008). In this way, high mass stars that produce tracers of the star-formation rate could be produced at a high rate while lower mass stars that account for most of the integrated stellar mass are created in smaller quantities. Alternatively, it is possible that systematic biases in determinations of the star formation rate at increasing redshift are responsible for the discrepancy. This can be phrased in terms of measurements of Davé’s star-formation activity parameter, which determines the Hubble times required for galaxy to reach their current mass at current SFR, and is seen to decrease too much between present day and z2. This conflicts with model predictions, and the passive population that would be required to counterbalance the high star formation in these rapidly growing systems is not observed. The recent work of (Chen et al., 2008) has found lower specific star formation rates in galaxies from the SDSS and DEEP2 surveys than typically measured by more usual means using an alternative method based on higher order Balmer lines. The lower normalization found in this model can be attributed to a number of factors, though the possibility of a changing IMF cannot be ruled out.
Unresolved primordial (population III) stars could in principle provide a large contribution to the background light, and the near-IR peak observed by the IRTS satellite (Matsumoto et al., 2005) has been interpreted as the redshifted photons from massive population-III stars beyond redshift 9 (Salvaterra and Ferrara, 2003). This peak reaches nearly a factor of 10 higher than levels from resolved number counts, but this claim is at odds with (Madau and Pozzetti, 2000; Totani et al., 2001; Thompson et al., 2008; Cooray et al., 2007) in which it is argued that the contribution from resolved galaxies has nearly converged, and there is little room for any additional sources such as an early generation of stars with a top-heavy IMF. The levels of metal formation from massive stars in these models required metals to either be locked away in compact products or dispersed in the IGM in a very inhomogeneous fashion. The large fraction of baryons which would have to be processed through primordial stars, 10%, and the lack of J-band dropout detections of these sources have strongly disfavored this interpretation (Salvaterra and Ferrara, 2006; Dwek et al., 2005), as does amount of material that would be contained in intermediate mass black holes Madau and Silk (2005). Additionally, an extragalactic origin for this feature would have a huge impact on the optical depth of TeV gamma rays, as we will discuss shortly.
Three approaches have been followed to calculate the EBL (as described by Kneiske et al. (2002)): (A) Evolution Inferred from Observations – e.g., [Kneiske et al. 2002, Franceschini et al. 2008]; (B) Backward Evolution, which starts with the existing galaxy population and evolves it backward in time – e.g., Stecker et al. (2006); and (C) Forward Evolution, which begins with cosmological initial conditions and models gas cooling, formation of galaxies including stars and AGN, feedback from these phenomena, and light absorption and re-emission by dust – e.g., (Primack et al., 2001, 2005). We will concentrate on Forward Evolution here, based on semi-analytic models (SAMs).
2 Semi-Analytic Modeling
The use of semi-analytic models to study galaxy formation was pioneered by (White and Frenk, 1991), and initial work was carried out primarily by two groups based in Durham and Munich. Our group was the first to develop a complete SAM code for galaxy formation (Somerville and Primack, 1999) and use it to model the EBL. Our code used a merger-tree formalism which was consistent with high-resolution dark matter simulations of the time, and several models of star formation and supernovae feedback were investigated. In (Somerville et al., 2001), these models were combined with the improved dust emission code of (Devriendt et al., 1999; Devriendt and Guiderdoni, 2000) for a prediction of the EBL and absorption of gamma rays (Primack et al., 2001). At the 2004 Symposium on High Energy Gamma Ray Astronomy our group presented a modified spectrum and attenuation predictions (Primack et al., 2005). This SED was somewhat lower than our 2001 result Primack et al. (2001), primarily because our 2005 model Primack et al. (2005) had been recalibrated to fit the local luminosity density as determined by new surveys such as 2MASS (Cole et al., 2001), SDSS (Blanton et al., 2003), and 2dF (Norberg et al., 2002). While the prediction of this model was consistent with optical and near-IR number counts data, it was below both the ISOCAM lower limit at 15 microns and the direct detection fluxes of DIRBE and FIRAS in the far-IR, indicating that the light remission by dust was being significantly underrepresented.
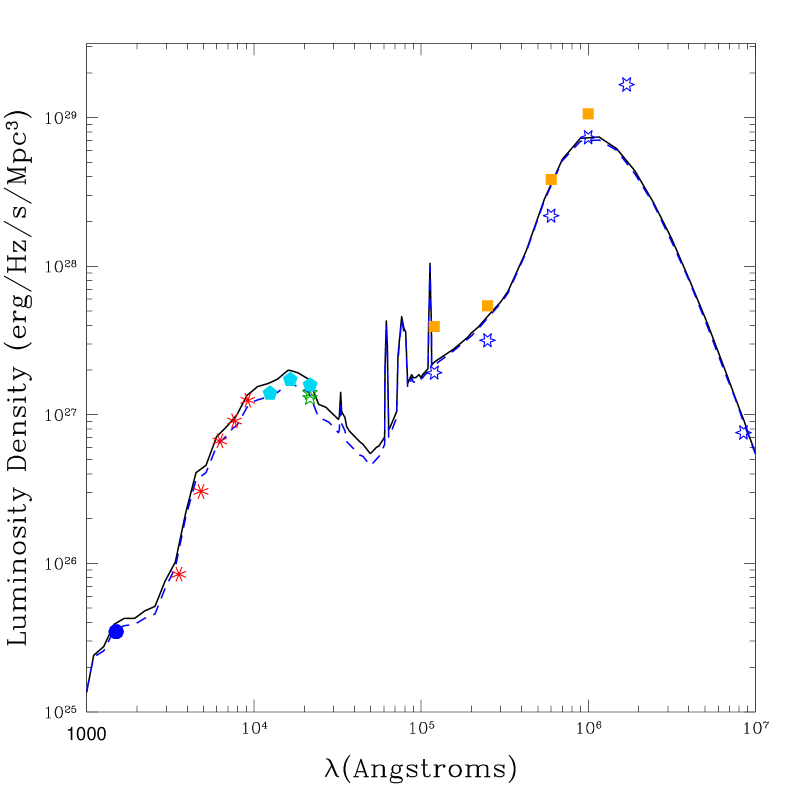
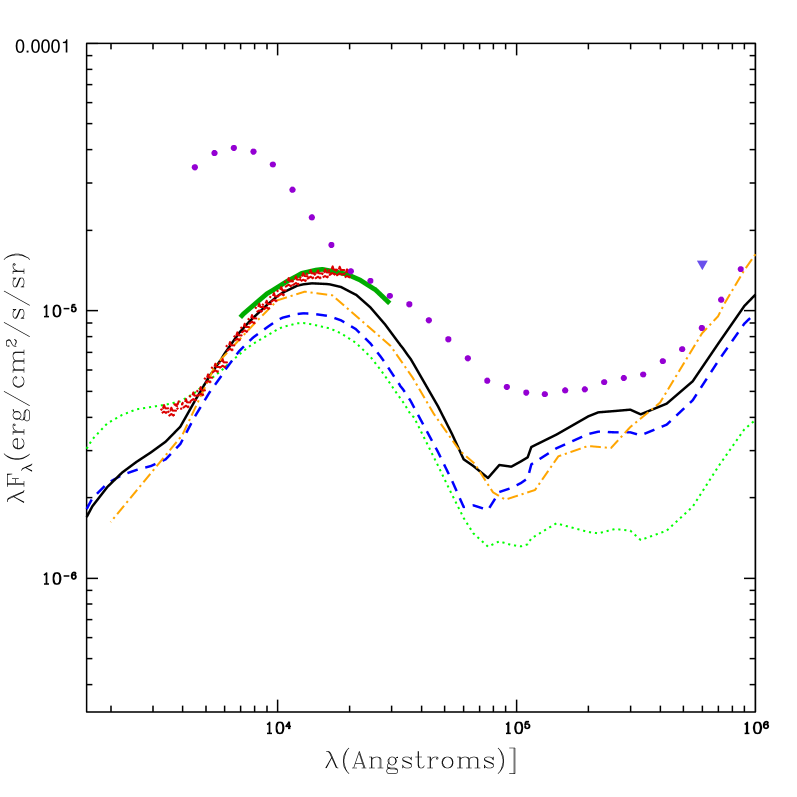
Our current SAM Somerville et al. (2008) is normalized using a variety of updated survey data, particularly in the IR, and also recent measurements of the fundamental cosmological parameters. In Figures 1 and 2 we show the present–day extragalactic background light and luminosity density for two models of galaxy evolution. Our ‘fiducial’ model is based upon a concordance cosmology with = 0.3, = 0.7, = 70.0, and = 0.9. Our ‘low’ model is based upon the best fit values from WMAP3, which include a lower of 0.761. This lower normalization of the primordial power spectrum leads to delayed structure formation and lower EBL. The most recent data from WMAP5 (Komatsu et al., 2008) suggests an intermediate value of = 0.8170.026, so we believe these two models can serve as bracketing the reasonable possibilities arising from cosmological uncertainty. The SAMs used here are based either upon the merger history of the dark matter halos in the simulation or else the extended Press-Schechter method, in which for each present-day halo, a merger ’tree’ is constructed, using the method similar to that described in (Somerville and Kolatt, 1999). The merger trees track the buildup of dark matter mass, with junctions representing halo mergers which form larger, virialized halos. The NFW profile (Navarro et al., 1997) is used as the initial halo description with the concentration determined using a fitting formula based on (Bullock et al., 2001). The model does not account for scatter or merger history in determining concentration. These methods do allow tidal disruption and destruction of halos in minor mergers to be considered; if a halo is destroyed prior to merging, its stars join the diffuse stellar component around the central galaxy.
Gas which cools around the halo is assumed to initially fall into a thin disk with exponential profile. The scale radius of this disk is determined using conservation of angular momentum and the concentration and baryon fraction of the disk. Our model computes the cooling time for gas based upon density, metallicity, and the initial virial temperature. Our recipe agrees well with gas infall and cooling rates from 3-dimensional hydrodynamic simulations of cold and hot flows Birnboim and Dekel (2003); Dekel et al. (2008); Keres et al. (2008).
Feedback from supernovae can heat the cold gas reservoir and drive it from the galaxy. This gas will either be deposited in the hot reservoir of the galaxy, or returned to the IGM, depending on the wind velocity relative to the virial velocity of the halo. Ejected gas can cool and return to the galaxy on a timescale roughly equal to the dynamical time of the galactic halo. The model discriminates between cold- and hot- mode accretion of gas based on the relative values of the cooling time of the gas vs dynamical time of the halo.
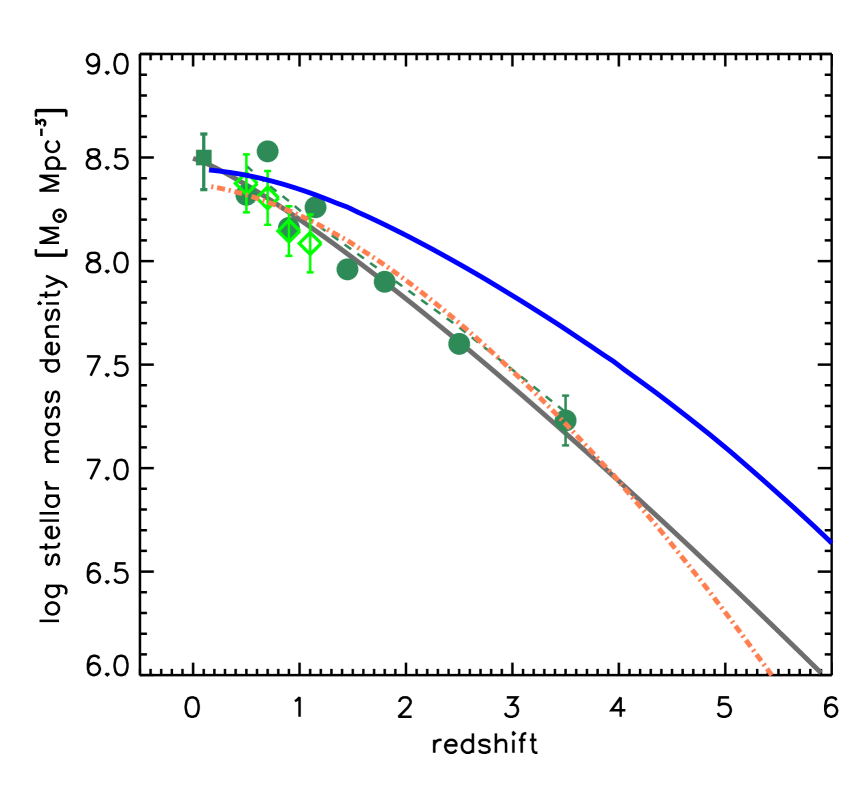
Star-formation in our model occurs in two regimes, quiescent star-formation and merger-driven starbursts. The contribution from each of these modes can be seen in Figure 3. The integrated mass vs. redshift is plotted in Figure 4. The quiescent star formation is treated using a recipe based on the Schmidt-Kennicutt law (Kennicutt, 1989; Kennicutt et al., 1998) with slope 1.4 and normalization to the Chabrier IMF. Star formation is assumed to cut off below a specific surface density, giving the exponential galactic disks a corresponding radius within which stars are forming. Merger-driven bursts are parametrized by the mass ratio of the merging pair, the mass in this case being the total mass in the inner part of the halo, taken to be twice the characteristic NFW scale radius. The burst efficiency parameter determines the fraction of cold gas converted to stars in the burst, and no burst occurs for a mass ratio of less than 1 to 10. The functional form taken for this parameter is from (Cox et al., 2008). The SFR during the burst is proportional to the available fuel, and therefore takes the form of a decaying exponential after an event. Details of the functional forms for the burst efficiency and timescale can be found in (Somerville et al., 2008).
Our implementation of AGN feedback is similar in many respects to that of (Sijacki et al., 2007), in which AGN operate in ‘bright’ and ‘radio’ modes, with the latter being switched on when the accretion rate rises above a critical value. All bright mode accretion is triggered by galaxy mergers, and the interdependent processes of AGN activity and black hole growth are based upon results from a large suite of hydrodynamic simulations. Every top-level halo in our simulation begins with a seed black hole of 100 solar masses; we do not find results to be sensitive to this amount. Black holes in merging galaxies coalesce rapidly and the product grows at the Eddington rate until reaching a critical ‘blowout’ mass, after which accretion rate falls as a power law, until it is cut off completely upon attaining a final mass determined by the spheroid mass and gas fraction. Radiative momentum from the accreting black hole is transferred to the galactic wind with an assumed coupling efficiency. In radio mode, the black hole enters a phase of Bondi-Hoyle accretion (Bondi, 1952). The net cooling in this mode is the cooling rate minus the heating from Bondi accretion. Heating is ignored if the cooling time is shorter than the dynamical time of the halo (‘cold mode’ cooling).
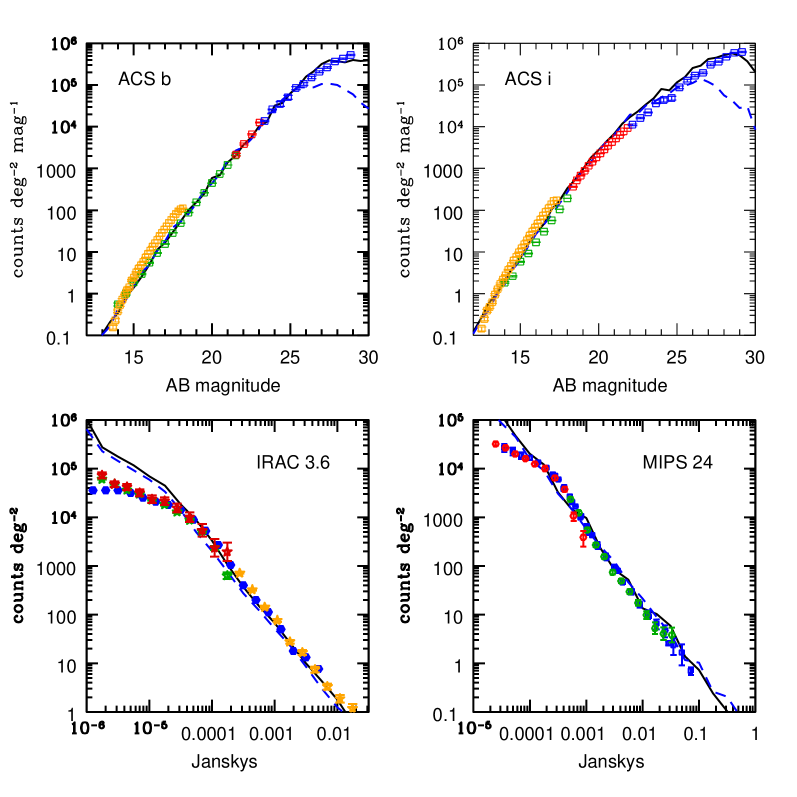
Predictions for galaxy number counts in the optical and IR are shown in Figure 5. The detection of the EBL in the far-IR by DIRBE and FIRAS at a level comparable to the direct emission from starlight requires the inclusion of galaxy populations very different from the Milky Way and other nearby galaxies, which emit most light in the optical and near-IR. Detectors in the mid-IR such as ISOCAM and MIPS find significant IR emission from star-forming galaxies. The cause of this is primarily tiny particles of dust released in supernovae explosions, with typical sizes ranging from nanometers to tenths of a micron. The temperature of these grains is only weakly affected by the flux of the surrounding radiation field, due to the blackbody emission which increases as the 4th power of temperature and the falloff of emission at long wavelengths, and therefore the peak emission ranges from about about 170 microns for a Milky Way type spiral to 60 microns for a ULIRG Lagache et al. (2005). Poly-aromatic hydrocarbons (PAHs) are another class of absorbers; tiny particles which emit at a group of specific wavelengths in the mid-IR from 3 to 17 microns. The absorption and re-emission of light, primarily from the UV, by dust and PAH particles in our model is accounted for using the stardust templates of (Devriendt et al., 1999; Devriendt and Guiderdoni, 2000; Guiderdoni and Devriendt, 1999), which are embedded in our semi-analytic model, and account for emission at wavelengths from the far-UV to sub-millimeter. These models are based upon the IRAS color-luminosity relation, and take the age, star-formation rate timescale, and the size of the gaseous disk as inputs. The metallicity is tracked both in the stellar spectra and surrounding gas, with predictions for radiative transfer based on geometry and metal distribution modeled after the Milky Way and nearby galaxies. We are working on improved dust models that will be more self-consistent.
3 Gamma-Ray Attenuation
A consequence of the EBL is the attenuation of high–energy gamma rays through electron–positron pair production (Gould and Schreder, 1967). The threshold for this process occurs when the center of mass energy of the photons is equal to the rest mass of the electron-positron pair. The cross section is maximized at approximately for center of mass energies of approximately twice the threshold, and falls as inverse energy for . Gamma rays above 1 TeV are most attenuated by the near- and mid-IR range of the EBL. Those in the 300 GeV to 1 TeV regime are sensitive to light in the near-IR and optical; below 300 GeV only UV photons have sufficient energy to cause the pair-production interaction. Below 20 GeV there is little absorption due to the increasing scarcity of hard UV background photons Gilmore et al. (2008).
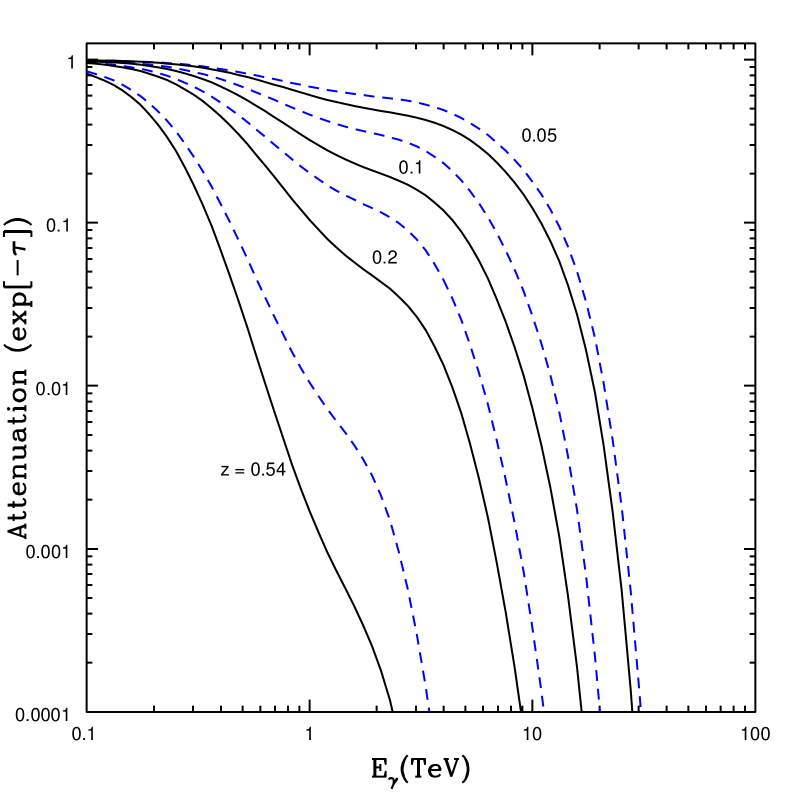
Observations of the attenuation of gamma-ray spectra from extragalactic sources provide a measurement of the EBL. We predict this attenuation here based on propagation of gamma-rays through the evolving EBL given by our fiducial and low models. In Figure 6, we show the optical depth (attenuation ) for gamma-rays vs. energy for a variety of redshifts. In principle, the cosmological history of the EBL could be reconstructed by comparing observations of high-energy sources at different redshifts to their known intrinsic spectra. Unfortunately, the emission mechanisms of GeV and TeV sources are in general poorly understood. Ground-based gamma-ray astronomy, which began largely with the Whipple and Hegra collaborations in the 1990s, has opened up the energy range above GeV. Today exploration in this regime is led by the VERITAS (Maier, 2007), H.E.S.S. (Hinton, 2004), and MAGIC (Cortina, 2005) experiments. The recently-launched Fermi (GLAST) and AGILE satellites (Tavani et al., 2008) will provide much needed data. The LAT instrument on Fermi has an energy range of 20 MeV to 300 GeV, and will efficiently scan the sky in this energy range. In addition to detecting sources on its own, Fermi will act as a finder for pointed observations by ground based telescopes. While in survey mode, the LAT will see the entire sky every 3 hours, and will be able to report flaring blazars to other detectors for study.
Ground-based detectors searching above 100 GeV have identified 23 extragalactic sources at the time of writing, including 21 BL Lac objects, radio galaxy M87, and the flat-spectrum radio quasar 3C279. With the exception of M87 these objects are all blazars, accreting AGN which generate tightly-beamed relativistic jets that lie at a small angle relative to our line of sight. Experiments at a wide variety of energy ranges have revealed that the spectra of blazars consist of a two-peaked distribution, the lower peak between the infrared and x-rays, the upper in the gamma-rays. This pattern is commonly understood as the result of a relativistic jet of charged leptons. The lower peak is attributed to synchrotron emission, while the gamma-ray peak is the result of inverse Compton radiation seeded by either the synchrotron photons themselves (the synchrotron-self Compton or SSC model) or photons from other sources (the external Compton or EC model). It has been argued in the case of at least 2 rapidly varying blazars that such variability is better modeled with an external radiation source (Begelman et al., 2008). There is evidence that there exists a BL Lac sequence, with less luminous objects having both peaks at higher energies than more brilliant sources (Fossati et al., 1998; Ghisellini et al., 1998; Maraschi et al., 2008), the extreme case being the HBL sources, in contrast to the brighter LBL sources. The sequence may arise as a result of increased cooling of the accelerated particles at higher luminosities, suggesting that sources with brighter bolometric luminosities would have lower Lorentz factors and peak energies (Ghisellini et al., 1998, 2002). While they account for almost all the detected sources above 100 GeV, BL Lac objects are themselves only a small subset (20) of all blazar sources, the other 80 percent being flat spectrum radio quasars like 3C279.
While uncertainties and likely variation in the intrinsic spectrum of blazars make it difficult to link the observed spectra directly to EBL attenuation, it is possible to translate limits on the spectra to EBL constraints. The standard assumption in placing limits the EBL from individual spectra is that the reconstructed intrinsic spectrum should not have a spectral index harder than 1.5; that is, if for photon count , or alternatively for flux . The standard value for a single-zone SSC spectrum is , where is the spectral index of the shock accelerated electrons, and is not harder than 1.5 in most models (Aharonian, 2001). This can be invalidated by assuming a non-standard spectrum for the electrons; a low energy cutoff in the electron energy will lead to inverse-Compton accelerated photons with an index as low as (Katarzyński et al., 2006). In Figure 7 we show a number of constraints on present-day EBL experiments from gamma-ray observations. The most recent limits on the EBL come from observations of blazars at more distant redshifts (z0.1) that have been detected by the current generation of ground-based ACTs. Observation by H.E.S.S. of two blazars at z=0.165 and 0.186 were used to set limits on the near-IR EBL based on the criterion (Aharonian et al., 2006); in this case the maximal limit was our 2001 model (Primack et al., 2001) multiplied by a factor of 0.45. It should be noted that our 2005 EBL prediction (Primack et al., 2005) included an optical and near-IR flux even lower than this older model with the multiplier of 0.45. Another paper by the H.E.S.S. group set constraints from blazar 1ES 0229+200 at z=0.1396 (Aharonian et al., 2007). While this blazar is a closer source than the two featured in the 2006 publication, the observed spectrum extended above 10 TeV and therefore probed the background in the mid-IR. In this regime, the effect of optical depth on spectral form is minimal due to the approximate falloff in EBL flux. The limits derived in this case are well above our 2005 model for a couple of different spectral slopes considered. The most distant source observed at very high energies at the time of writing is quasar 3C279 at z=0.536, observed by the MAGIC experiment during a flare in February 2006 (Teshima et al., 2007). The spectrum observed was quite steep, , and extended from about 80 to nearly 500 GeV. An analysis of the spectral modification (MAGIC Collaboration et al., 2008) found that there was little room for an EBL flux in the optical higher than one consistent with lower limits from number counts, approximately equivalent to the model of (Primack et al., 2005) and with our fiducial and low models presented here – see Figure 8. An alternative analysis of the spectral deconvolution of 3C279 by (Stecker and Scully, 2008) disputed this analysis and argued that the higher EBL of (Stecker et al., 2006, 2007) could still lead to a steep best-fit spectrum. Another approach to the problem is to attempt to constrain the EBL by using spectra from several sources simultaneously. Dwek and Krennrich (Dwek and Krennrich, 2005) considered 12 such permutations, and derived an upper limit at 60m by declaring invalid those realizations leading to unphysical intrinsic blazar spectra with sharply rising TeV emissions. An effort by (Costamante et al., 2004) used observations of 4 blazars by HEGRA to limit the EBL in the near-IR and at 60 microns with limiting 1.0 and 1.5. More recently, this method was used in (Mazin and Raue, 2007), who applied constraints from all observed TeV blazars to a large number of possible EBL functional forms created using a spline interpolation across a grid in flux versus wavelength space. The lower bound of the union of excluded models formed an envelope representing the highest possible background that does not violate any constraints. This was done for ‘realistic’ and ‘extreme’ bounds of and respectively, and provided a limit on the EBL from the optical to the far-IR.
4 Discussion
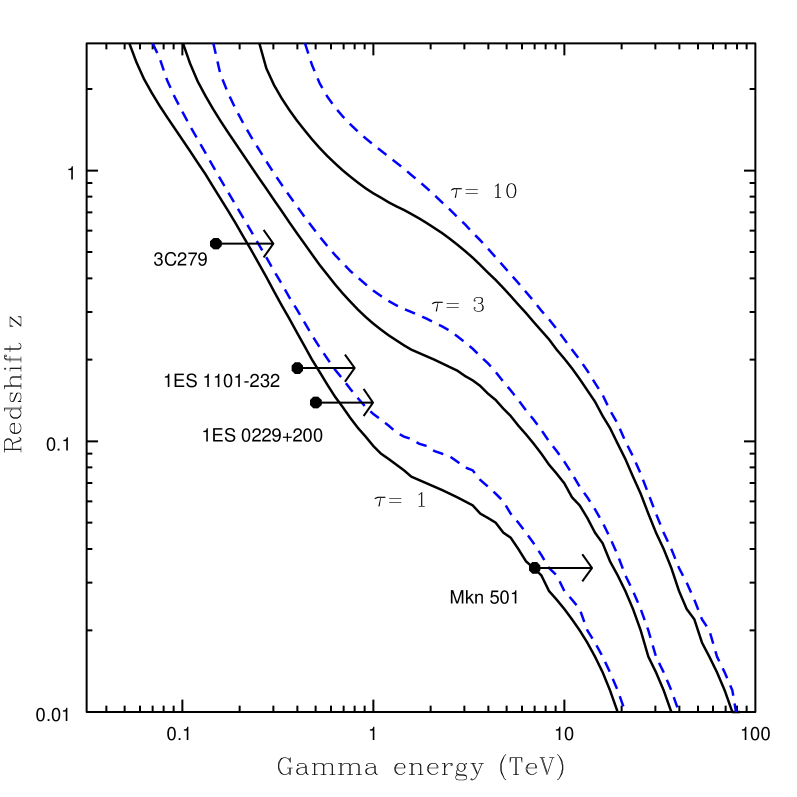
Figure 8 shows the gamma-ray attenuation edge plot for our models. This is a complementary plot to the optical depths of Figure 6, and shows the distance to which gamma-ray detectors can view before encountering various levels of obscuration from photon-photon interactions.
New self-consistent hybrid SAMs based on physical scaling from numerical simulations and calibrated against empirical constraints now enable us to interpret the relationship between galaxies, supermassive black holes, and active galactic nuclei across cosmic history. The latest semi-analytic models are greatly improved over the best SAMs that were available four years ago, largely because the improving observations of galaxies challenged theorists to do better. Although the CDM dark matter backbone for structure formation was already well understood, earlier CDM-based galaxy formation models suffered from a set of interlinked problems – especially overcooling leading to excessive star formation in galaxies and clusters, and a resulting failure to produce the observed red/blue galaxy color bimodality. New SAMs, including the one Somerville et al. (2008) that our new EBL is based on, now account better for the coupling between the supermassive black holes and their host galaxies. “Bright mode” AGN feedback may regulate BH formation and temporarily quench star formation, but it is not a viable long-term mechanism to keep galaxies red by preventing them from forming stars, as observations require. Low-accretion rate “radio mode” feedback is a promising mechanism for counteracting cooling flows and preventing star formation in clusters and galaxies over long time scales. Such SAMs now accurately predict galaxy number counts and luminosity functions in all spectral bands and all redshifts except for sub-mm galaxies. They should therefore allow us to predict the EBL rather reliably across the wavelengths relevant for gamma-ray attenuation, since the far-IR EBL is not relevant for attenuation of gamma-rays of even the highest observed energies. The predicted range of the EBL is consistent with the latest estimates of EBL evolution inferred from observations Franceschini et al. (2008). Thus we have reason to hope that this sort of theoretical calculation of the EBL and corresponding gamma-ray attenuation is beginning to converge.
There are two main problems. One is that the treatment of the crucial near-IR and mid-IR emission of galaxies by SAMs is still rather primitive. The approach that we and others use is based on assuming that most galaxies of similar total bolometric luminosity emit radiation with similar spectral energy distributions, so that we can use “template” SEDs to calculate the IR emission. However, Spitzer observations have shown that even nearby this is not true, and we have good reasons to expect that it will be even less true at higher redshifts. We are therefore working on self-consistent models of dust absorption and re-radiation, following on Jonsson (2006); Jonsson et al. (2006) which will be incorporated into future models of the EBL.
The other main problem is calculating the ultraviolet EBL and the corresponding attenuation of gamma-rays at energies below about 100 GeV, which will be observed by Fermi (GLAST) and by the new generation of very large ground-based atmospheric Cherenkov telescopes. Little is known from direct measurements about the EBL at energies above the Lyman limit. We do not know the relative importance of ionizing radiation from AGN vs. stars and the redshift evolution of both. Also, most ionizing photons from star-forming galaxies are absorbed by local cold gas and dust, with an uncertain fraction escaping to the intergalactic medium. The transmission of the IGM is also not fully understood. Predicting optical depths to lower energy photons is further complicated by the fact that the attenuation edge for an optical depth of unity increases to redshifts of several, meaning that the evolution of ionizing sources must be understood to high redshift. Uncertainty in star-formation rates and efficiency, evolution of the quasar luminosity function and spectrum, and the possibly changing escape fraction or initial mass function all make predicting optical depths for gamma rays at high redshift much more difficult than studies of local absorption at TeV energies. Preliminary calculations are presented by Gilmore et al. (Gilmore et al., 2008) in this volume, including predictions for gamma-ray attenuation.
The Fermi satellite is now performing beautifully, frequently discovering new, or newly brightened, sources of gamma rays. The prospect of many new observations in the near future of gamma-rays across a wide range of energies from sources at many redshifts means that we can expect a great deal of progress as theory and observations together clarify the entire spectrum of galactic radiation and its sources.
References
- Hauser and Dwek (2001) M. G. Hauser, and E. Dwek, ARA&A 39, 249–307 (2001).
- Bernstein et al. (2002a) R. A. Bernstein, W. L. Freedman, and B. F. Madore, ApJ 571, 56–84 (2002a).
- Bernstein et al. (2002b) R. A. Bernstein, W. L. Freedman, and B. F. Madore, ApJ 571, 107–128 (2002b).
- Bernstein (2007) R. A. Bernstein, ApJ 666, 663–673 (2007).
- Wright and Reese (2000) E. L. Wright, and E. D. Reese, ApJ 545, 43–55 (2000).
- Wright (2001) E. L. Wright, ApJ 553, 538–544 (2001).
- Gorjian et al. (2000) V. Gorjian, E. L. Wright, and R. R. Chary, ApJ 536, 550–560 (2000).
- Cambrésy et al. (2001) L. Cambrésy, W. T. Reach, C. A. Beichman, and T. H. Jarrett, ApJ 555, 563–571 (2001).
- Levenson et al. (2007) L. R. Levenson, E. L. Wright, and B. D. Johnson, ApJ 666, 34–44 (2007).
- Matsumoto et al. (2005) T. Matsumoto, S. Matsuura, H. Murakami, M. Tanaka, M. Freund, M. Lim, M. Cohen, M. Kawada, and M. Noda, ApJ 626, 31–43 (2005).
- Kashlinsky and Odenwald (2000) A. Kashlinsky, and S. Odenwald, ApJ 528, 74–95 (2000).
- Thompson et al. (2008) R. I. Thompson, D. Eisenstein, X. Fan, M. Rieke, and R. Kennicutt, (2008), astro-ph/0801.3825.
- Cooray et al. (2007) A. Cooray, I. Sullivan, R.-R. Chary, J. J. Bock, M. Dickinson, H. C. Ferguson, B. Keating, A. Lange, and E. L. Wright, ApJ 659, L91–L94 (2007).
- Fixsen et al. (1998) D. J. Fixsen, E. Dwek, J. C. Mather, C. L. Bennett, and R. A. Shafer, ApJ 508, 123–128 (1998).
- Hauser et al. (1998) M. G. Hauser, R. G. Arendt, T. Kelsall, E. Dwek, N. Odegard, J. L. Weiland, H. T. Freudenreich, W. T. Reach, et al., ApJ 508, 25–43 (1998).
- Finkbeiner et al. (2000) D. P. Finkbeiner, M. Davis, and D. J. Schlegel, ApJ 544, 81–97 (2000).
- Lagache et al. (2000) G. Lagache, L. M. Haffner, R. J. Reynolds, and S. L. Tufte, A&A 354, 247–252 (2000).
- Wright (2004) E. L. Wright, New Astronomy Review 48, 465–468 (2004).
- Puget and Lagache (2001) J. L. Puget, and G. Lagache, “Far-infrared Source Counts and the Diffuse Infrared Background,” in The Extragalactic Infrared Background and its Cosmological Implications, edited by M. Harwit, 2001, vol. 204 of IAU Symposium, pp. 233.
- Madau and Pozzetti (2000) P. Madau, and L. Pozzetti, MNRAS 312, L9–L15 (2000).
- Totani et al. (2001) T. Totani, Y. Yoshii, F. Iwamuro, T. Maihara, and K. Motohara, ApJ 550, L137–L141 (2001).
- Xu et al. (2005) C. K. Xu, J. Donas, S. Arnouts, T. K. Wyder, M. Seibert, J. Iglesias-Páramo, J. Blaizot, T. Small, et al., ApJ 619, L11–L14 (2005).
- Gardner et al. (2000) J. P. Gardner, T. M. Brown, and H. C. Ferguson, ApJ 542, L79–L82 (2000).
- Fazio et al. (2004) G. G. Fazio, M. L. N. Ashby, P. Barmby, J. L. Hora, J.-S. Huang, M. A. Pahre, Z. Wang, S. P. Willner, et al., ApJS 154, 39–43 (2004).
- Levenson and Wright (2008) L. R. Levenson, and E. L. Wright, (2008), astro-ph/0802.1239.
- Elbaz et al. (2002) D. Elbaz, C. J. Cesarsky, P. Chanial, H. Aussel, A. Franceschini, D. Fadda, and R. R. Chary, A&A 384, 848–865 (2002).
- Chary et al. (2004) R. Chary, S. Casertano, M. E. Dickinson, H. C. Ferguson, P. R. M. Eisenhardt, D. Elbaz, N. A. Grogin, L. A. Moustakas, W. T. Reach, and H. Yan, ApJS 154, 80–86 (2004).
- Frayer et al. (2006) D. T. Frayer, M. T. Huynh, R. Chary, M. Dickinson, D. Elbaz, D. Fadda, J. A. Surace, H. I. Teplitz, L. Yan, and B. Mobasher, ApJ 647, L9–L12 (2006).
- Papovich et al. (2004) C. Papovich, H. Dole, E. Egami, E. Le Floc’h, P. G. Pérez-González, A. Alonso-Herrero, L. Bai, C. A. Beichman, et al., ApJS 154, 70–74 (2004).
- Dole et al. (2006) H. Dole, G. Lagache, J.-L. Puget, K. I. Caputi, N. Fernández-Conde, E. Le Floc’h, C. Papovich, P. G., et al., A&A 451, 417–429 (2006).
- Coppin et al. (2006) K. Coppin, E. L. Chapin, A. M. J. Mortier, S. E. Scott, C. Borys, J. S. Dunlop, M. Halpern, D. H. Hughes, et al., MNRAS 372, 1621–1652 (2006).
- Primack et al. (2005) J. R. Primack, J. S. Bullock, and R. S. Somerville, “Observational Gamma-ray Cosmology,” in High Energy Gamma-Ray Astronomy, edited by F. A. Aharonian, H. J. Völk, and D. Horns, 2005, vol. 745 of American Institute of Physics Conference Series, pp. 23–33.
- Franceschini et al. (2008) A. Franceschini, G. Rodighiero, and M. Vaccari, (2008), astro-ph/0805.1841.
- Dolch (2008) T. Dolch, in prep (2008).
- Jones et al. (2006) D. H. Jones, B. A. Peterson, M. Colless, and W. Saunders, MNRAS 369, 25–42 (2006).
- Cole et al. (2001) S. Cole, P. Norberg, C. M. Baugh, C. S. Frenk, J. Bland-Hawthorn, T. Bridges, R. Cannon, M. Colless, et al., MNRAS 326, 255–273 (2001).
- Bell et al. (2003) E. F. Bell, D. H. McIntosh, N. Katz, and M. D. Weinberg, ApJS 149, 289–312 (2003).
- Takeuchi et al. (2001) T. T. Takeuchi, T. T. Ishii, H. Hirashita, K. Yoshikawa, H. Matsuhara, K. Kawara, and H. Okuda, PASJ 53, 37–52 (2001).
- Hopkins (2004) A. M. Hopkins, ApJ 615, 209–221 (2004).
- Gabasch et al. (2004) A. Gabasch, M. Salvato, R. P. Saglia, R. Bender, U. Hopp, S. Seitz, G. Feulner, M. Pannella, et al., ApJ 616, L83–L86 (2004).
- Hopkins and Beacom (2006) A. M. Hopkins, and J. F. Beacom, ApJ 651, 142–154 (2006).
- Fardal et al. (2007) M. A. Fardal, N. Katz, D. H. Weinberg, and R. Davé, MNRAS 379, 985–1002 (2007).
- Davé (2008) R. Davé, MNRAS 385, 147–160 (2008).
- Chen et al. (2008) Y.-M. Chen, V. Wild, G. Kauffmann, J. Blaizot, M. Davis, K. Noeske, J.-M. Wang, and C. Willmer, (2008), astro-ph/0808.3683.
- Salvaterra and Ferrara (2003) R. Salvaterra, and A. Ferrara, MNRAS 339, 973–982 (2003).
- Salvaterra and Ferrara (2006) R. Salvaterra, and A. Ferrara, MNRAS 367, L11–L15 (2006).
- Dwek et al. (2005) E. Dwek, R. G. Arendt, and F. Krennrich, ApJ 635, 784–794 (2005).
- Madau and Silk (2005) P. Madau, and J. Silk, MNRAS 359, L37–L41 (2005).
- Kneiske et al. (2002) T. M. Kneiske, K. Mannheim, and D. H. Hartmann, A&A 386, 1–11 (2002).
- Stecker et al. (2006) F. W. Stecker, M. A. Malkan, and S. T. Scully, ApJ 648, 774–783 (2006).
- Primack et al. (2001) J. R. Primack, R. S. Somerville, J. S. Bullock, and J. E. G. Devriendt, “Probing Galaxy Formation with High-Energy Gamma Rays,” in American Institute of Physics Conference Series, edited by F. A. Aharonian, and H. J. Völk, 2001, vol. 558 of American Institute of Physics Conference Series, pp. 463.
- Somerville et al. (2008) R. S. Somerville, P. F. Hopkins, T. J. Cox, B. E. Robertson, and L. Hernquist, (2008), astro-ph/0808.1227.
- Schiminovich et al. (2005) D. Schiminovich, O. Ilbert, S. Arnouts, B. Milliard, L. Tresse, O. Le Fèvre, M. Treyer, T. K. Wyder, et al., ApJ 619, L47–L50 (2005).
- Fontana et al. (2006) A. Fontana, S. Salimbeni, A. Grazian, E. Giallongo, L. Pentericci, M. Nonino, F. Fontanot, N. Menci, et al., A&A 459, 745–757 (2006).
- Borch et al. (2006) A. Borch, K. Meisenheimer, E. F. Bell, H.-W. Rix, C. Wolf, S. Dye, M. Kleinheinrich, Z. Kovacs, and L. Wisotzki, A&A 453, 869–881 (2006).
- Wilkins et al. (2008) S. M. Wilkins, N. Trentham, and A. M. Hopkins, MNRAS 385, 687–694 (2008).
- Montero-Dorta and Prada (2008) A. D. Montero-Dorta, and F. Prada, (2008), astro-ph/0806.4930.
- Sanders et al. (2007) D. B. Sanders, M. Salvato, H. Aussel, O. Ilbert, N. Scoville, J. A. Surace, D. T. Frayer, K. Sheth, et al., ApJS 172, 86–98 (2007).
- Shupe et al. (2008) D. L. Shupe, M. Rowan-Robinson, C. J. Lonsdale, F. Masci, T. Evans, et al., AJ 135, 1050–1056 (2008).
- White and Frenk (1991) S. D. M. White, and C. S. Frenk, ApJ 379, 52–79 (1991).
- Somerville and Primack (1999) R. S. Somerville, and J. R. Primack, MNRAS 310, 1087–1110 (1999).
- Somerville et al. (2001) R. S. Somerville, J. R. Primack, and S. M. Faber, MNRAS 320, 504–528 (2001).
- Devriendt et al. (1999) J. E. G. Devriendt, B. Guiderdoni, and R. Sadat, A&A 350, 381–398 (1999).
- Devriendt and Guiderdoni (2000) J. E. G. Devriendt, and B. Guiderdoni, A&A 363, 851–862 (2000).
- Blanton et al. (2003) M. R. Blanton, D. W. Hogg, N. A. Bahcall, J. Brinkmann, M. Britton, A. J. Connolly, I. Csabai, M. Fukugita, et al., ApJ 592, 819–838 (2003).
- Norberg et al. (2002) P. Norberg, C. M. Baugh, E. Hawkins, S. Maddox, D. Madgwick, O. Lahav, S. Cole, C. S. Frenk, et al., MNRAS 332, 827–838 (2002).
- Komatsu et al. (2008) E. Komatsu, J. Dunkley, M. R. Nolta, C. L. Bennett, B. Gold, G. Hinshaw, N. Jarosik, D. Larson, et al., (2008), astro-ph/0803.0547.
- Somerville and Kolatt (1999) R. S. Somerville, and T. S. Kolatt, MNRAS 305, 1–14 (1999).
- Navarro et al. (1997) J. F. Navarro, C. S. Frenk, and S. D. M. White, ApJ 490, 493 (1997).
- Bullock et al. (2001) J. S. Bullock, T. S. Kolatt, Y. Sigad, R. S. Somerville, A. V. Kravtsov, A. A. Klypin, J. R. Primack, and A. Dekel, MNRAS 321, 559–575 (2001).
- Birnboim and Dekel (2003) Y. Birnboim, and A. Dekel, MNRAS 345, 349–364 (2003).
- Dekel et al. (2008) A. Dekel, Y. Birnboim, G. Engel, J. Freundlich, T. Goerdt, M. Mumcuoglu, E. Neistein, C. Pichon, R. Teyssier, and E. Zinger, (2008), astro-ph/0808.0553.
- Keres et al. (2008) D. Keres, N. Katz, M. Fardal, R. Dave, and D. H. Weinberg, (2008), astro-ph/0809.1430.
- Kennicutt (1989) R. C. Kennicutt, Jr., ApJ 344, 685–703 (1989).
- Kennicutt et al. (1998) R. C. Kennicutt, Jr., P. B. Stetson, A. Saha, D. Kelson, D. M. Rawson, S. Sakai, B. F. Madore, J. R. Mould, et al., ApJ 498, 181 (1998).
- Cox et al. (2008) T. J. Cox, P. Jonsson, R. S. Somerville, J. R. Primack, and A. Dekel, MNRAS 384, 386–409 (2008).
- Sijacki et al. (2007) D. Sijacki, V. Springel, T. di Matteo, and L. Hernquist, MNRAS 380, 877–900 (2007).
- Bondi (1952) H. Bondi, MNRAS 112, 195 (1952).
- Lagache et al. (2005) G. Lagache, J.-L. Puget, and H. Dole, ARA&A 43, 727–768 (2005).
- Guiderdoni and Devriendt (1999) B. Guiderdoni, and J. E. G. Devriendt, (1999), astro-ph/9911162.
- Gould and Schreder (1967) R. J. Gould, and G. P. Schreder, \physrev 155, 1404 (1967).
- Maier (2007) G. Maier, (2007), astro-ph/0709.3654.
- Hinton (2004) J. A. Hinton, New Astronomy Review 48, 331–337 (2004).
- Cortina (2005) J. Cortina, Ap&SS 297, 245–255 (2005).
- Tavani et al. (2008) M. Tavani, G. Barbiellini, A. Argan, A. Bulgarelli, P. Caraveo, A. Chen, V. Cocco, E. Costa, et al., Nuclear Instruments and Methods in Physics Research A 588, 52–62 (2008).
- Aharonian et al. (2006) F. Aharonian, A. G. Akhperjanian, A. R. Bazer-Bachi, M. Beilicke, et al., Nature 440, 1018–1021 (2006).
- MAGIC Collaboration et al. (2008) MAGIC Collaboration, J. Albert, E. Aliu, H. Anderhub, L. A. Antonelli, P. Antoranz, M. Backes, C. Baixeras, J. A. Barrio, et al., Science 320, 1752 (2008).
- Mazin and Raue (2007) D. Mazin, and M. Raue, A&A 471, 439–452 (2007).
- Dwek and Krennrich (2005) E. Dwek, and F. Krennrich, ApJ 618, 657–674 (2005).
- Begelman et al. (2008) M. C. Begelman, A. C. Fabian, and M. J. Rees, MNRAS 384, L19–L23 (2008).
- Fossati et al. (1998) G. Fossati, L. Maraschi, A. Celotti, A. Comastri, and G. Ghisellini, MNRAS 299, 433–448 (1998).
- Ghisellini et al. (1998) G. Ghisellini, A. Celotti, G. Fossati, L. Maraschi, and A. Comastri, MNRAS 301, 451–468 (1998).
- Maraschi et al. (2008) L. Maraschi, G. Ghisellini, F. Tavecchio, L. Foschini, and R. M. Sambruna, (2008), astro-ph/0802.1789.
- Ghisellini et al. (2002) G. Ghisellini, A. Celotti, and L. Costamante, A&A 386, 833–842 (2002).
- Aharonian (2001) F. A. Aharonian, “TeV blazars and cosmic infrared background radiation,” in International Cosmic Ray Conference, edited by O. G. Gladysheva, G. E. Kocharov, G. A. Kovaltsov, and I. G. Usoskin, 2001, vol. 27-I of International Cosmic Ray Conference, pp. 250.
- Katarzyński et al. (2006) K. Katarzyński, G. Ghisellini, F. Tavecchio, J. Gracia, and L. Maraschi, MNRAS 368, L52–L56 (2006).
- Aharonian et al. (2007) F. Aharonian, A. G. Akhperjanian, U. Barres de Almeida, A. R. Bazer-Bachi, B. Behera, M. Beilicke, W. Benbow, K. Bernlöhr, et al., A&A 475, L9–L13 (2007).
- Teshima et al. (2007) M. Teshima, E. Prandini, R. Bock, M. Errando, D. Kranich, et al., (2007), astro-ph/0709.1475.
- Stecker and Scully (2008) F. W. Stecker, and S. T. Scully, (2008), astro-ph/0807.4880.
- Stecker et al. (2007) F. W. Stecker, M. A. Malkan, and S. T. Scully, ApJ 658, 1392–1392 (2007).
- Costamante et al. (2004) L. Costamante, F. Aharonian, D. Horns, and G. Ghisellini, New Astronomy Review 48, 469–472 (2004).
- Jonsson (2006) P. Jonsson, MNRAS 372, 2–20 (2006).
- Jonsson et al. (2006) P. Jonsson, T. J. Cox, J. R. Primack, and R. S. Somerville, ApJ 637, 255–268 (2006).
- Gilmore et al. (2008) R. C. Gilmore, P. Madau, J. R. Primack, and R. S. Somerville, “Modeling Gamma-Ray Attenuation in High Redshift GeV Spectra,” to be published in these proceedings, astro-ph/0811.1984.