Wide Area X-ray Surveys for AGN and Starburst Galaxies
Abstract
While often the point sources in X-ray surveys are dominated by AGN, with the high sensitivity of modern X-ray telescopes such as Chandra and XMM-Newton normal/starburst galaxies are also being detected in large numbers. We have made use of Bayesian statistics for both the selection of galaxies from deep X-ray surveys and in the analysis of the luminosity functions for galaxies. These techniques can be used to similarly select galaxies from wide-area X-ray surveys and to analyze their luminosity function. The prospects for detecting galaxies and AGN from a proposed “wide-deep” XMM-Newton survey and from future wide-area X-ray survey missions (such as WFXT and eRosita) are also discussed.
Keywords:
galaxies, active galactic nuclei, x-rays:
98.54.Ep, 98.62.Ve, 98.70.Qy1 X-ray Surveys
Extragalactic X-ray surveys are a powerful tool to study important source populations such as active galactic nuclei (AGN), clusters of galaxies, and, recently, normal galaxies Brandt and Hasinger (2005). In the bandpasses of Chandra and XMM-Newton, X-rays penetrate column densities up to , and are therefore efficient at detecting moderately-obscured “Compton-thin” AGN. Compton-thick AGN (AGN with column densities of ) can also be detected in X-rays when prominent scattered emission is present (typically of order of of the intrinsic emission) Cappi and et al. (2006) and can be detected in hard (E 10 keV) surveys Winter et al. (2008). Therefore X-ray surveys are essential for a complete census of AGN. Normal galaxies can now be detected in large numbers thanks to the high sensitivity of Chandra and XMM-Newton, however since they have low luminosities (), they are more difficult to detect than AGN.
1.1 X-rays from Normal/Starburst Galaxies
It has been known since the early 1980s that the X-ray emission of normal and starburst galaxies (galaxies with very high star-formation rates) are correlated with both the star-formation rate and stellar mass of the galaxies Fabbiano (1989). The physics behind this is that high-mass stars evolve rapidly (on time scales of years), and in turn explode as supernovae (SN). Occasionally these SN are detected in X-rays, however more often they heat the ISM to X-ray emitting temperatures (i.e., T K) and produce neutron stars and black holes in X-ray binaries. X-ray binaries where the companion is a high-mass star (high-mass X-ray binaries) also have short evolutionary time scales. Therefore hot ISM and high-mass X-ray binaries track the current star-formation rate. Low-mass X-ray binaries have longer evolutionary time scales (on the order of Hubble times), and therefore track the integrated star-formation history of galaxies (i.e., the total stellar mass).
1.2 X-ray Galaxy Survey Strategies
There are several approaches to surveying specific sources types with low fluxes such as X-ray observations of galaxies. Deep, pencil-beam surveys of course probe to the faintest fluxes however due to the limited survey volume tend to result in low numbers of rare, high-luminosity objects. Wide area surveys (e.g., XMM-COSMOS) detect large numbers of AGN but are usually too shallow or survey too small of an area to detect significant numbers of galaxies. Another approach is to correlate large catalogs (e.g., the RC3 catalog or the SDSS) with archival data. For example, galaxies have been detected in X-rays based on correlating the SDSS with the 2XMM catalog (see Parnau et al. these proceedings). We are pursuing this approach in the case of Chandra and XMM-Newton archival data by taking advantage of the XAssist pipeline processing of these data111see http://www.xassist.org and correlating the fields with the RC3 catalog. Note that by working with the original data rather than simply a source catalog we will be properly integrating the X-ray flux over the full RC3 ellipse for each galaxy, which is often larger that the telescope PSF, and also will be able to compute upper-limits for galaxies not detected in X-rays.
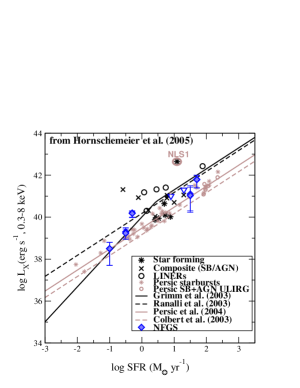
Finally we discuss the option of pursuing X-ray observations of statistically-complete samples that are not X-ray selected. We have been observing galaxies selected from the Nearby Field Galaxy Survey, which have very-well determined star formation rates Kewley et al. (2002). We have received six XMM-Newton datasets and also included one serendipitous Chandra observation Ptak et al. (2008). The X-ray/SFR correlation based on correlating the Chandra archive with the Kauffman SDSS galaxy catalog Kauffmann and et al. (2003) is shown in Figure 1Hornschemeier et al. (2005), with the X-ray NFGS data also plotted. The NFGS points are consistent with either the lower X-ray/SFR normalization implied by the X-ray detected SDSS galaxies, or a break in the X-ray/SFR correlation. Clearly a larger unbiased sample is needed.
2 Bayesian Selection and Analysis of Normal Galaxies in Deep X-ray Surveys
In Norman and et al. (2004) and Ptak et al. (2007), normal/starburst galaxies were selected from the Chandra Deep Fields (CDF) using a Bayesian model selection methodology. Our motivation for employing this technique was to directly take into account the X-ray measurement errors which can be significant for X-ray sources at the flux limit of the survey.
2.1 Galaxy Selection
The most discriminating features for separating galaxies from AGN were found to be X-ray hardness ratio, (H-S)/(H+S), where H and S are the numbers of photons above and below 2 keV, respectively, X-ray luminosity, and X-ray/optical flux ratio. In our analysis of GOODS data we also included the X-ray/near-IR flux ratio. We determined “parent” distributions for these parameters by selecting a sample of normal galaxies, type-1 AGN and type-2 AGN from the CDF South based on high quality optical spectroscopy, and then taking the mean and standard deviation () for each parameter.
The posterior probability for observing the parameters , where here given the data is given by Bayes’ theorem: . The subscripts denote that this is assuming a given model , here galaxies, type-1 AGN (AGN1) and type-2 AGN (AGN2). If multiple models are being considered, then the prior probability for each model must also be included. are the “prior” distributions for the parameters for a given model , for which we used the parent distributions discussed above. is the likelihood function of observing the parameters given the data. Often is considered to be a normalization constant since it does not depend on the model parameters , and is defined to be . However is also often (perhaps more precisely) considered to be the marginal likelihood or Bayesian evidence for the model . The relative probability of two competing models given the data is then given by the “Bayes Factor” or
| (1) |
Sources with and were selected as galaxies222In Ptak et al. (2007), a more conservative sample was selected with Bayes factors .. Here we are assuming a flat prior on the numbers of sources for each model , in other words we are assuming that the “true” number of normal/starburst galaxies, type-1 AGN and type-2 AGN are approximately equal.
2.2 Evolution
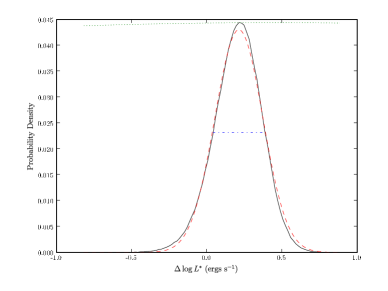
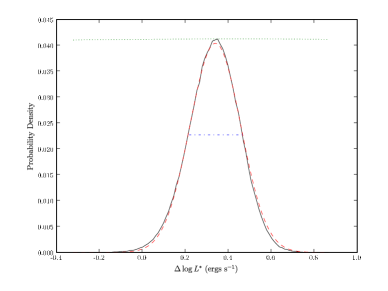
Evolution was observed qualitatively between the redshifts of 0.25 and 0.75 consistent with pure luminosity evolution, with by comparing the X-ray luminosity functions (XLFs) with the far-infrared luminosity functions Norman and et al. (2004). Subsequently using GOODS data we fit the X-ray luminosity functions by using Markov-Chain Monte Carlo (MCMC) Ptak et al. (2007). MCMC analysis results in a distribution of parameter values (the “chains”). This allows the direct visualization of posterior probabilities for important quantities, such as the change in between the low and high redshift XLFs (Figure 2). Another key advantage of the Bayesian approach is that “derived” quantities such as luminosity density can be computed directly from the chain parameter values, allowing the posterior probabilities for these quantities to be visualized or summarized (i.e., with the mode as a “best-fit” value and the 68% confidence interval as the “error bar”) without questionable propagation of error Ptak et al. (2007); Kelly et al. (2008). In future work we will be incorporating the additional 1 Ms of CDF-S data, as well as improving our MCMC analysis of the XLFs to also include VLA radio and Spitzer mid-IR data (both of which are star-formation rate indicators and will help discriminate galaxies from AGN).
3 Wide-Area X-ray Surveys
3.1 XMM Wide-Area Surveys
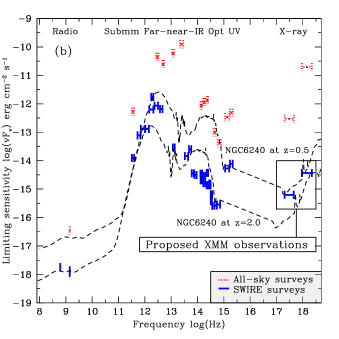
While both XMM-Newton and Chandra are very sensitive X-ray telescopes, XMM-Newton has a larger field-of-view (FOV) than Chandra and is therefore more adept at wide-area surveys. While the total solid angle of 2XMM is large (hundreds of square degrees), its coverage is non-uniform and potentially biased since the field selection is not random. XMM-COSMOS is a wide-area survey covering 2 deg.2 at an exposure of 40 ks per field, or a limiting point-source sensitivity of Salvato and et al. (2008). Here we briefly discuss a proposal to extend XMM-COSMOS out to 10 deg.2 at a similar mean exposure per field333Submitted in the XMM AO-8 proposal round, PI David Alexander. This level of sensitivity would be sufficient to detect the (scattered) X-ray flux from Compton-thick AGN with a spectral energy distribution similar to NGC 6240 at z (see Figure 3). This survey should result in 6000-8000 AGN being detected, with at least 100 photons (sufficient for crude X-ray color analysis) and with at least 300 counts (sufficient for spectral analysis, including the detection of Fe-K lines). This survey would also detect AGN at z3 ( at z4). We expect up normal/starburst galaxies would be detected, based on the Ranalli et al. logN-logSRanalli et al. (2005). The field selection is in the Spitzer-SWIRE area, and the proposed X-ray data along with large amount of ancillary data from other wavebands available in these fields will allow us to study the coeval evolution of AGN and star formation over a wide range of redshift, environment and luminosity.
3.2 Future Missions
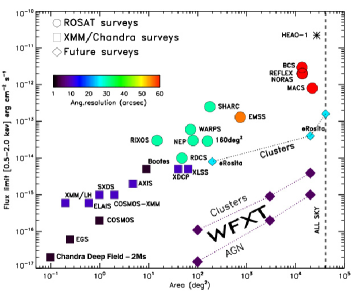
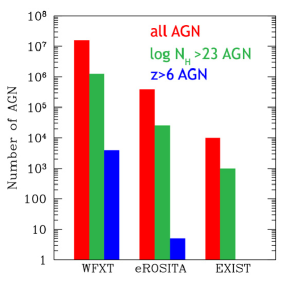
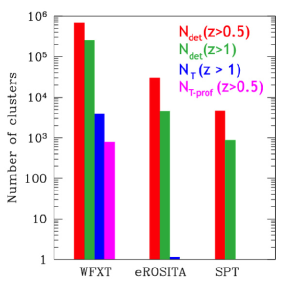
There are several proposed future missions dedicated to X-ray surveys. eRosita (extended Roentgen Survey with an Imaging Telescope Array) is an approved mission expected to fly aboard the Spectrum X-Gamma Mission, although the launch date appears to be uncertain444http://www.mpe.mpg.de/projects.html#erosita. eRosita will perform several surveys, including a nearly all-sky shallow survey. The Wide Field X-ray Telescope (WFXT) is a proposed medium-class NASA mission to similarly perform several surveys. The limiting flux and survey solid angle for both the WFXT and eRosita surveys are plotted in Figure 4. The numbers of AGN and clusters expected to be detect by eRosita and WFXT are shown in Figure 5. We expect on the order of normal/starburst galaxies to be detected in the eRosita surveys while galaxies should be detected in the WFXT surveys. Clearly either mission would drastically increase the numbers of X-ray detected sources and would be revolutionary. The high numbers of sources expected from WFXT is due to both a higher effective area and a smaller PSF (half-energy width of for WFXT compared to the field-averaged PSF of in the case of eRosita). WFXT also have the advantage of using a wide-field optical design Burrows et al. (1992), giving more uniform PSF and response across the 1 deg. FOV.
References
- Brandt and Hasinger (2005) W. N. Brandt, and G. Hasinger, Annual Reviews of Astronomy & Astrophysics 43, 827–859 (2005).
- Cappi and et al. (2006) M. Cappi, and et al., Astronomy & Astrophysics 446 (2006).
- Winter et al. (2008) L. Winter, R. Mushotzky, C. S. Reynolds, and J. Tueller, Astrophysical Journal , submitted (2008), astro-ph/0808.0461.
- Fabbiano (1989) G. Fabbiano, Annual Reviews of Astronomy & Astrophysics 27, 87–138 (1989).
- Kewley et al. (2002) L. J. Kewley, M. J. Geller, R. A. Jansen, and M. A. Dopita, Astronomical Journal 124, 3135–3143 (2002).
- Ptak et al. (2008) A. Ptak, T. Heckman, C. Norman, A. Hornschemeier, L. Kewley, and A. Zezas, “The X-ray/SFR connection from X-ray observations oft the nearby field galaxy sample,” in ”ESAC faculty workshop on x-rays from nearby galaxies”, 2008, pp. 81–84.
- Kauffmann and et al. (2003) G. Kauffmann, and et al., Monthly Notices of the Royal Astronomical Society 341, 33–53 (2003).
- Hornschemeier et al. (2005) A. E. Hornschemeier, T. M. Heckman, A. F. Ptak, C. A. Tremonti, and E. J. M. Colbert, Astronomical Journal 129, 86–103 (2005).
- Norman and et al. (2004) C. Norman, and et al., Astrophysical Journal 607, 721–738 (2004).
- Ptak et al. (2007) A. Ptak, B. Mobasher, A. Hornschemeier, F. Bauer, and C. Norman, Astrophysical Journal 667, 826 (2007).
- Kelly et al. (2008) B. Kelly, X. Fan, and M. Vestergaard, Astrophysical Journal 682, 874 (2008).
- Salvato and et al. (2008) M. Salvato, and et al., Astrophysical Journal in press (2008), URL http://arxiv.org/abs/0809.2098, astro-ph/0809.2098, 0809.2098.
- Ranalli et al. (2005) P. Ranalli, A. Comastri, and G. Setti, Astronomy & Astrophysics 440, 23–37 (2005).
- Burrows et al. (1992) C. Burrows, R. Burg, and R. Giacconi, Astrophysical Journal 392, 760 (1992).