Impact of sub-solar metallicities on photometric redshifts
Abstract
With the advent of deep photometric surveys the use of photometric redshifts, obtained with a variety of techniques, has become more and more widespread. Giving access to galaxies with a wide range of luminosities out to high redshifts, these surveys include many faint galaxies with significantly sub-solar metallicities.
We use our chemically consistent galaxy evolutionary synthesis code GALEV to produce a large grid of template Spectral Energy Distributions (SEDs) for galaxies of spectral types E and Sa through Sd – one accounting in a chemically consistent way for the increasing initial metallicities of successive stellar generations, the other one for exclusively solar metallicities – for comparison.
We use our new photometric redshift code GAZELLE based on the comparison of observed and model SEDs. Comparing the photometric redshifts obtained using solar-metallicity templates when working on a catalogue of artificially created chemically consistent SEDs, typical for low-metallicity local late-type galaxies and for intrinsically low-luminosity, and hence low-metallicity, galaxies in the high-redshift universe, we find a significant bias resulting from this metallicity mismatch. This bias consists in a systematic underestimate of the photometric redshift by typically until , depending on galaxy type, of distant, faint and low-metallicity galaxies if analysed with solar-metallicity templates.
keywords:
galaxies: evolution – galaxies: abundances – galaxies: high-redshift – galaxies: distances and redshifts1 Introduction
Most of today’s studies of large samples of high-redshift galaxies rely on photometric redshifts comparing observed spectral energy distributions (SEDs), i.e. magnitudes and colours in multiple filters, to a set of templates. For that reason the choice of the right set of template is crucial to determine accurate and unbiased photometric redshifts. The most widely used templates are either observed local templates, e.g. from Coleman et al. (1980), that do not including any evolutionary correction, or templates generated with evolutionary synthesis models which in most cases use fixed solar metallicities.
During the last years, evidence has accumulated that galaxies are not made out of stars of one metallicity, but show a wide range from very metal-poor to more metal-rich stars. This holds true not only for our Milky Way (Rocha-Pinto & Maciel, 1998; Ak et al., 2007), but also for external galaxies like e.g. the LMC (Cole et al., 2000) and giant ellipticals like NGC5128 (= Centaurus A, Harris et al., 1999; Harris & Harris, 2000).
Studying samples of local star forming galaxies Skillman et al. (1989) showed a trend of decreasing average metallicity of a galaxy with decreasing luminosity, used as an indicator of its mass, and spanning more than 12 magnitudes in luminosity. Larger samples, compiled e.g. from the SDSS (Tremonti et al., 2004; Kewley & Ellison, 2008) confirmed this mass-metallicity relation and extended it to even lower masses (Lee et al., 2006).
This is particularly important with respect to high redshift galaxies in the early universe, since those galaxies did not yet have the time to produce enough stars to enrich their ISM to high metallicities. Studies of Lyman Break Galaxies (Pettini et al., 2001), Damped Lyman- Absorbers (Prochaska et al., 2003) and Gamma Ray Bursts (Prochaska et al., 2007) all show that galaxies get progressively more metal-poor if they are observed at high redshift. Furthermore dwarf galaxies, such as the LMC, that are metal-poor in the local universe, are observable out to considerable redshifts in deep imaging surveys. Note that Erb et al. (2006) found a mass-metallicity relation for galaxies at redshifts of , confirming that the local trend was already established in the early universe.
For that reason evolutionary synthesis models that take the chemical enrichment of successive stellar generations into account are principally superior to more simplified models with fixed metallicity. In Bicker et al. (2004) we showed that with appropriate star formation histories (SFHs) our chemically consistent GALEV models agree well with a wealth of observed properties for local and high-redshift galaxies and showed how the presently observed stellar metallicity distributions in galaxies have evolved. In Bicker & Fritze (2005) we demonstrated the impact on non-solar metallicities on the determination of star formation rates (SFRs) from emission lines and UV-fluxes. Kodama et al. (1999) have shown that metallicities can have a significant impact on observed colours of high-redshift galaxies; the impact of metallicity on restframe colours was studied by other authors. However, the impact of those generally bluer colours on photometric redshifts has not been studied so far. In the present Letter we quantify the impact of neglecting those sub-solar metallicities on photometric redshifts.
2 Creation of template SEDs
2.1 Input models
To study the chemical enrichment history of the common spectral galaxy types E and Sa through Sd we used our chemically consistent galaxy evolution code GALEV. Assuming a closed-box model, GALEV allows us to compute the chemical enrichment of a galaxy’s gas-reservoir from the yields of dying stars. We use isochrones from the Padova-group (Bertelli et al., 1994) with metallicities ranging from to and a Salpeter-IMF (Salpeter, 1955) with mass-limits of and . Note that a different choice of the IMF, e.g. Kroupa or Chabrier, does not affect the results obtained below. The spectral galaxy types are characterized by an exponentially declining SFR for the E-model, SFRs proportional to the available gas-mass for the Sa-Sc models (with factors of proportionality decreasing towards later types), and a constant SFR scenario for the Sd. These SFHs were shown to provide a good match to today’s galaxy templates, e.g. from Kennicutt (1992) in Bicker et al. (2004). To derive the effects on photometric redshifts we also ran all those models again, this time fixing the metallicity to the solar value . Our GALEV models also include line and continuum emission from ionized gas, with line strength appropriate for the particular gaseous metallicity at each time. The importance of emission lines for accurate photometric redshifts has recently been shown by Ilbert et al. (2008).
To derive the SEDs for comparison with observations, we redshifted the spectra at all timesteps to the redshift corresponding to the age of each galaxy spectrum, adopting a concordance cosmology with , and . We assume that all galaxies started forming stars at . Variations of this formation redshift with spectral type, as e.g. suggested by Noeske et al. (2007, 2007) for the latest spectral types has little effect on the present study since those show little evolution anyway. This means we consistently account for both evolutionary and cosmological corrections. Since some galaxies at high-redshifts are found to contain significant amounts of dust (e.g. Steidel et al., 1999), we convolve each spectrum with the dust attenuation curve of Calzetti et al. (2000). We chose a range of extinctions from to in steps of . We include the effects of intergalactic absorption following Madau (1995) and then convolve each spectrum with a set of typical filters, here taken to be the SDSS ugriz and the standard 2MASS JHK filters. Galaxies were normalized as to show by z=0 the average observed Johnson B-band magnitudes for their respective types as given by Sandage et al. (1985a, b). We then added the bolometric distance modulus for each redshift. This results in a total of template SEDs with smaller redshift intervals at lower z and wider sampling at high redshifts for each of our ten models (5 types E, Sa-Sd, all chemically consistent and with metallicity fixed to solar for comparison).
2.2 Addition of noise
To simulate real observations, we added Gaussian noise observational errors to each magnitude. The amount of scatter added, , depends on the magnitude of the i-th filter:
with describing calibration or zeropoint uncertainties, and being constants defining the shape of the curve. depends on the depth of the underlying observations, here chosen to correspond to limiting AB magnitudes of (26,27,27,27,26,25,25,24) mag for the (u,g,r,i,z,J,H,K) filters. This procedure was repeated for each input SED, resulting in an artificially created input catalog of galaxies for each model. For the following analysis we then derived median values and -uncertainties in bins of .
2.3 Determining photometric redshifts
To derive the photometric redshifts we use our photometric redshift code GAZELLE described in more details in a companion paper (Kotulla & Fritze, 2008). In principle it uses a -algorithm to compare fluxes derived from the observed SEDs with a range of template SEDs. The resulting -values are then transformed into normalized probabilities. Masses are derived by scaling the model SEDs as a whole to match the observed SED on average. To determine -uncertainties for redshifts and all dependent parameters (masses, SFRs, metallicities, etc.) we derive the minimum and maximum values encountered while summing up normalized probabilities (from highest to lowest) until have been reached. We restrict our template set to only undisturbed galaxies E, and Sa through Sd, since those are well calibrated against observed galaxy templates, and match observations in colours, spectra and metallicities (see Bicker et al., 2004; Kotulla et al., 2008, for a detailed comparison).
In the following, we will focus on the redshift determination and the best-match -value.
3 Results
3.1 Evolution of metallicity with redshift
In Fig. 1 we present the metallicity evolution of the different spectral galaxy types E, Sa, and Sd with decreasing redshift. We show two different metallicity measures: The gas-phase or ISM metallicity and the luminosity-weighted stellar metallicity in a set of different rest-frame filters. The ISM metallicity is traditionally measured from emission lines, while stellar metallicities are derived from stellar absorption lines, as e.g. Lick indices (e.g. Trager et al., 1998; Schiavon et al., 2006), requiring spectra of much higher signal-to-noise ratio. Our models yield metallicities at of , and , in good agreement with observed metallicities, e.g. from Zaritsky et al. (1994).
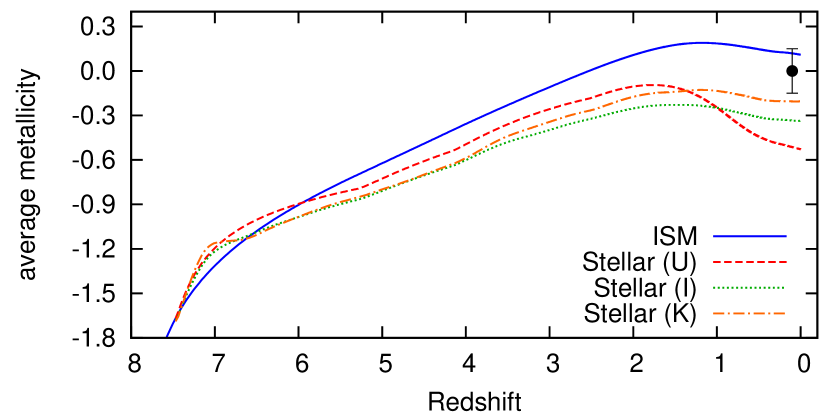
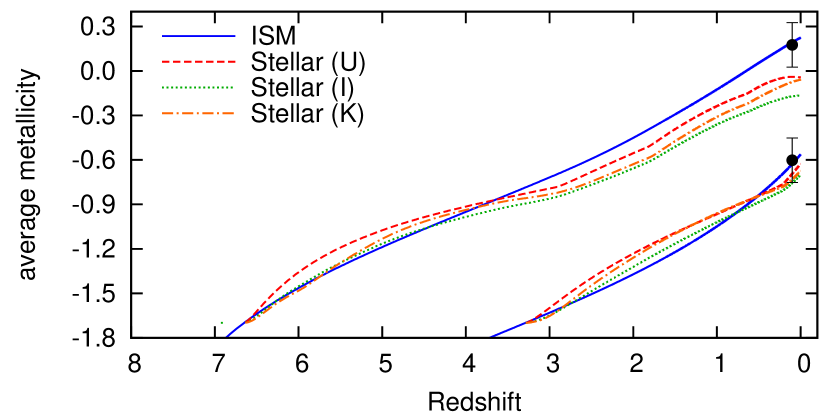
The most important point with respect to this paper, however, is that only the E and Sa models reach enrichment levels comparable to solar metallicity. Later spiral types, i.e. the Sb-Sd models only reach significantly sub-solar metallicities after a Hubble time, rendering the assumption of solar metallicity independent of redshift and galaxy type invalid. While solar metallicity is a moderately good approximation () for early-type galaxies (E to Sa) back to fairly young ages or high redshifts, it becomes less and less valid for later galaxy types, in particular at earlier times or higher redshifts.
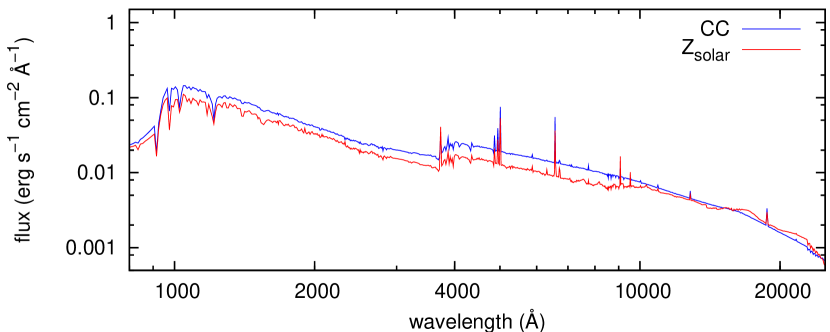
Low-metallicity stellar populations are brighter in the optical and UV (cf. Fig. 2), have bluer colours (since their stars are hotter) and produce more ionizing photons compared to their equal-mass solar metallicity counterparts. This leads to higher emission line fluxes and hence an over-estimation of SFRs by up to factors (Bicker & Fritze, 2005) if solar-metallicity calibrations are used. At the same time, their higher overall luminosities lead to overestimations of galaxy masses by factors up to and their bluer colors lead to an underestimation of their stellar population ages by factors up to , unless their sub-solar metallicities are properly taken into account.
3.2 Impact on photometric redshifts
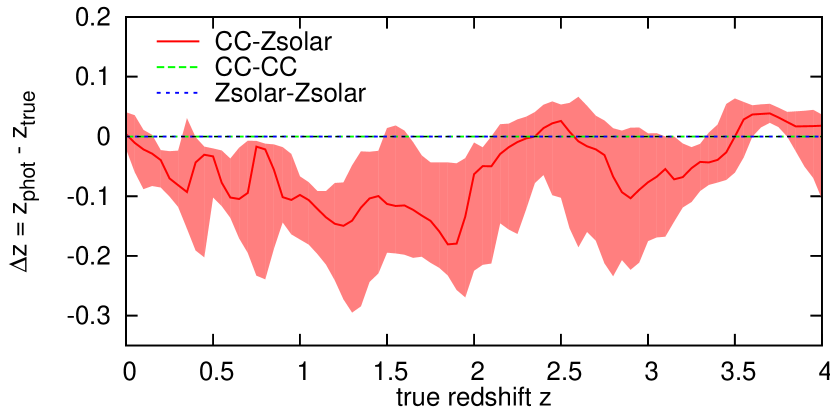
We ran three different sets of photometric redshift determinations, comparing (a) the solar metallicity SED catalog to solar metallicity SED templates, (b) the chemically consistent (CC) SED catalog to CC SED templates, and (c) analysing the CC SED catalog using solar metallicity SED templates. The outcomes of runs a) and b) are shown by the green and blue lines and symbols in Figures 3 and 4; every datapoint represent the median-value in bins of in redshift. As expected, we find very small -values for the best match and excellent correspondence between true and photometric redshifts. The third run analyzing the CC catalog with solar metallicity templates mimics the wide-spread analysis method for observation of low-metallicity galaxies in the early universe using close-to-solar metallicity SED templates. Those can either be locally observed galaxies that naturally have higher metallicities than their high-redshift counterparts, training sets of galaxies with available spectroscopic redshifts (and hence the brightest and with the mass-metallicity relation also most metal-rich galaxies at each redshift) or solar metallicity model templates. The result are shown as red symbols in both figures. As expected, the best-match -values (where degrees-of-freedom (DOF) means the number of filters) for run (c) are significantly larger at almost all redshifts. The trend towards smaller values at higher redshifts can be understood as a consequence of photometric uncertainties increasing with decreasing brightness and finally a decreasing number of filters due to dropouts and magnitudes falling below the detection limit. This in turn allows more flexible matching by varying both shape, determined by galaxy type, redshift and extinction, and normalisation, i.e. galaxy mass, of the template SED.
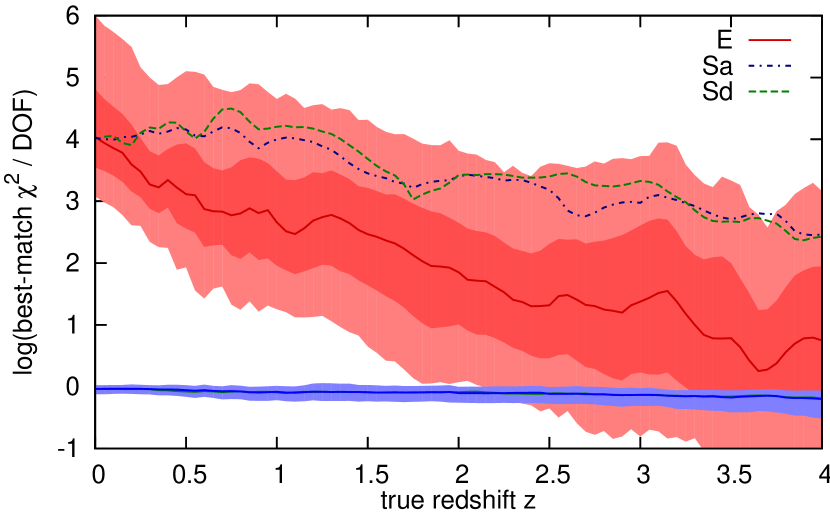
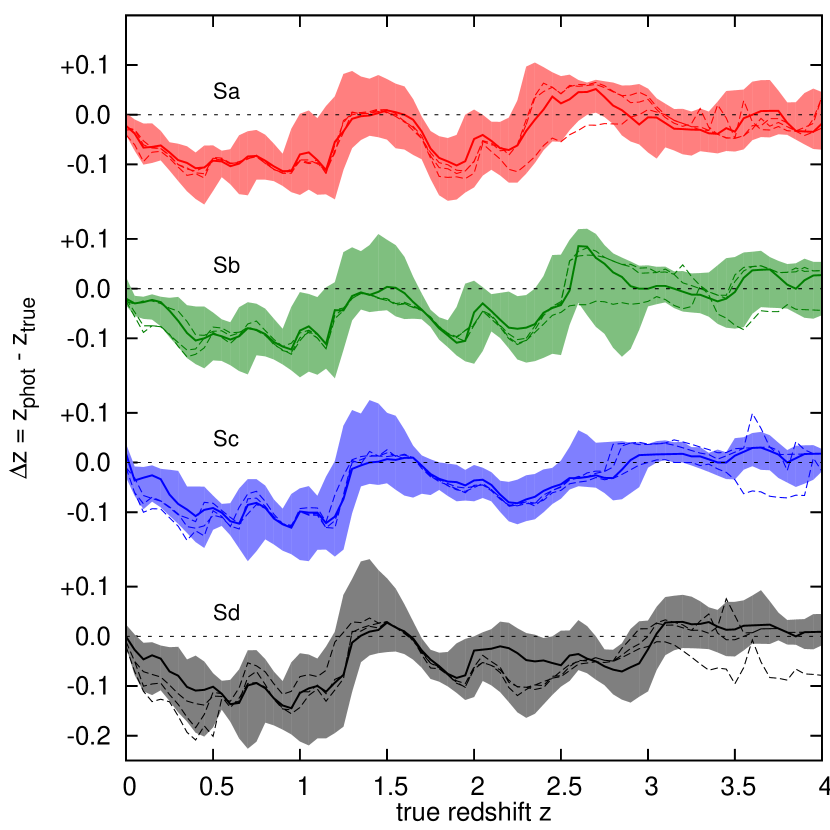
Fig. 4 shows the offsets between true and retrieved photometric redshifts that result from the choice of templates not matching the observed metallicities. We also show the regions for each galaxy type as filled regions. It is obvious that even for the near-solar metallicity galaxy types E and Sa there are still significant offsets of (equivalent to ) until . At higher redshifts we also find a bias but this is less prominent than at lower redshifts, in particular compared to the increased scatter at those redshifts. At even higher redshifts dropouts start to dominate the redshift determination. The reason for these biases is that although the metallicity is near solar for the early types E and Sa, the galaxy nevertheless contains a large fraction of lower metallicity stars (e.g. of the U-band flux of nearby elliptical galaxies is emitted by stars with ; Bicker et al. 2004). As a general trend, the retrieved photometric redshifts show a bias towards lower redshifts. This trend can be understood from the bluer SEDs of the CC-models, generated by the lower metallicity stars, that the photometric redshift code tries to compensate for by attributing lower redshifts to its templates. This offset is, in particular at low redshifts , larger than the typical scatter of found for large samples of photometric redshifts (e.g. Mobasher et al., 2007).
Furthermore, the amount of dust reddening also plays a role in the following sense: essentially dust-free models with have larger best-match values and are more strongly biased towards too low redshifts than models with more dust, reaching a maximum for the Sd-type galaxy at where or equivalently (see dahed lines in Fig. 4). This point is particularly crucial at where we essentially observe the rest-frame UV. We here are biased towards UV-bright objects, i.e. those that are not hidden behind large amounts of dust. Photometric redshifts obtained by fitting solar-metallicity templates to those galaxies are therefore even more strongly biased towards too low redshifts than the median of all extinctions presented above.
Observational evidence for the bias described here can be found e.g. in Ilbert et al. (2006, Fig.3). There observed templates were used to derive photometric redshifts from a filter set similar to the one used here, and a underestimation until and in particular at was found.
4 Conclusions and summary
We used our chemically consistent galaxy evolutionary synthesis models GALEV to study the chemical enrichment histories of galaxies over a range of spectral types E and Sa through Sd. The E-type galaxy reaches enrichment levels of already at high redshifts and remains almost from there on. Sa-type galaxies are significantly sub-solar at , while later types such as Sd even after a Hubble time only reach levels of .
This fact, in combination with observational evidence for a wide range in stellar metallicities of our and nearby galaxies and the decreasing stellar metallicities in galaxies at higher redshifts casts doubt on widespread methods of using only solar-metallicity templates to derive photometric redshifts from observed spectral energy distributions. We study the impact of the increasing importance of sub-solar metallicity populations in high-redshift galaxies on photometric redshift determinations using our photometric redshift code GAZELLE on several large synthetic galaxy catalogs and find a significant bias of for galaxies at towards systematically underestimated photometric redshifts as a consequence of their bluer SEDs.
Acknowledgments
We thank our anonymous referee for insightful comments that helped to clarify and improve this paper.
References
- Ak et al. (2007) Ak S., Bilir S., Karaali S., Buser R., Cabrera-Lavers A., 2007, New Astronomy, 12, 605
- Bertelli et al. (1994) Bertelli G., Bressan A., Chiosi C., Fagotto F., Nasi E., 1994, A&AS, 106, 275
- Bicker & Fritze (2005) Bicker J., Fritze U., 2005, A&A, 443, L19
- Bicker et al. (2004) Bicker J., Fritze U., Möller C. S., Fricke K. J., 2004, A&A, 413, 37
- Calzetti et al. (2000) Calzetti D., Armus L., Bohlin R. C., Kinney A. L., Koornneef J., Storchi-Bergmann T., 2000, ApJ, 533, 682
- Cole et al. (2000) Cole A. A., Smecker-Hane T. A., Gallagher III J. S., 2000, AJ, 120, 1808
- Coleman et al. (1980) Coleman G. D., Wu C.-C., Weedman D. W., 1980, ApJS, 43, 393
- Erb et al. (2006) Erb D. K., Shapley A. E., Pettini M., Steidel C. C., Reddy N. A., Adelberger K. L., 2006, ApJ, 644, 813
- Harris & Harris (2000) Harris G. L. H., Harris W. E., 2000, AJ, 120, 2423
- Harris et al. (1999) Harris G. L. H., Harris W. E., Poole G. B., 1999, AJ, 117, 855
- Ilbert et al. (2006) Ilbert O., Arnouts S., McCracken H. J., Bolzonella M., Bertin E., Le Fèvre O., Mellier Y., Zamorani G., Pellò R., Iovino A., Tresse L., Le Brun V., Bottini D., Garilli B., Maccagni D., Picat J. P., Scaramella R., Scodeggio M., Vettolani G., Zanichelli A., Adami C., Bardelli S., Cappi A., Charlot S., Ciliegi P., Contini T., Cucciati O., Foucaud S., Franzetti P., Gavignaud I., Guzzo L., Marano B., Marinoni C., Mazure A., Meneux B., Merighi R., Paltani S., Pollo A., Pozzetti L., Radovich M., Zucca E., Bondi M., Bongiorno A., Busarello G., de La Torre S., Gregorini L., Lamareille F., Mathez G., Merluzzi P., Ripepi V., Rizzo D., Vergani D., 2006, A&A, 457, 841
- Ilbert et al. (2008) Ilbert O., Capak P., Salvato M., Aussel H., McCracken H. J., Sanders D. B., Scoville N., Kartaltepe J., Arnouts S., Le Floc’h E., Mobasher B., Taniguchi Y., Lamareille F., Leauthaud A., Sasaki S., Thompson D., Zamojski M., Zamorani G., Bardelli S., Bolzonella M., Bongiorno A., Brusa M., Caputi K. I., Carollo C. M., Contini T., Cook R., Coppa G., Cucciati O., de la Torre S., de Ravel L., Franzetti P., Garilli B., Hasinger G., Iovino A., Kampczyk P., Kneib J. ., Knobel C., Kovac K., Le Borgne J. F., Le Brun V., Le Fevre O., Lilly S., Looper D., Maier C., Mainieri V., Mellier Y., Mignoli M., Murayama T., Pello R., Peng Y., Perez-Montero E., Renzini A., Ricciardelli E., Schiminovich D., Scodeggio M., Shioya Y., Silverman J., Surace J., Tanaka M., Tasca L., Tresse L., Vergani D., Zucca E., 2008, astro-ph/0809.2101
- Kennicutt (1992) Kennicutt Jr. R. C., 1992, ApJS, 79, 255
- Kewley & Ellison (2008) Kewley L. J., Ellison S. L., 2008, ApJ, 681, 1183
- Kodama et al. (1999) Kodama T., Bell E. F., Bower R. G., 1999, MNRAS, 302, 152
- Kotulla & Fritze (2008) Kotulla R., Fritze U., 2008, in prep
- Kotulla et al. (2008) Kotulla R., Fritze U., Weilbacher P., Anders P., 2008, submitted to MNRAS
- Lee et al. (2006) Lee H., Skillman E. D., Cannon J. M., Jackson D. C., Gehrz R. D., Polomski E. F., Woodward C. E., 2006, ApJ, 647, 970
- Madau (1995) Madau P., 1995, ApJ, 441, 18
- Mobasher et al. (2007) Mobasher B., Capak P., Scoville N. Z., Dahlen T., Salvato M., Aussel H., Thompson D. J., Feldmann R., Tasca L., Lefevre O., Lilly S., Carollo C. M., Kartaltepe J. S., McCracken H., Mould J., Renzini A., Sanders D. B., Shopbell P. L., Taniguchi Y., Ajiki M., Shioya Y., Contini T., Giavalisco M., Ilbert O., Iovino A., Le Brun V., Mainieri V., Mignoli M., Scodeggio M., 2007, ApJS, 172, 117
- Noeske et al. (2007) Noeske K. G., Faber S. M., Weiner B. J., Koo D. C., Primack J. R., Dekel A., Papovich C., Conselice C. J., Le Floc’h E., Rieke G. H., Coil A. L., Lotz J. M., Somerville R. S., Bundy K., 2007, ApJ, 660, L47
- Noeske et al. (2007) Noeske K. G., Weiner B. J., Faber S. M., Papovich C., Koo D. C., Somerville R. S., Bundy K., Conselice C. J., Newman J. A., Schiminovich D., Le Floc’h E., Coil A. L., Rieke G. H., Lotz J. M., Primack J. R., Barmby P., Cooper M. C., Davis M., Ellis R. S., Fazio G. G., Guhathakurta P., Huang J., Kassin S. A., Martin D. C., Phillips A. C., Rich R. M., Small T. A., Willmer C. N. A., Wilson G., 2007, ApJ, 660, L43
- Pettini et al. (2001) Pettini M., Shapley A. E., Steidel C. C., Cuby J.-G., Dickinson M., Moorwood A. F. M., Adelberger K. L., Giavalisco M., 2001, ApJ, 554, 981
- Prochaska et al. (2007) Prochaska J. X., Chen H.-W., Dessauges-Zavadsky M., Bloom J. S., 2007, ApJ, 666, 267
- Prochaska et al. (2003) Prochaska J. X., Gawiser E., Wolfe A. M., Castro S., Djorgovski S. G., 2003, ApJ, 595, L9
- Rocha-Pinto & Maciel (1998) Rocha-Pinto H. J., Maciel W. J., 1998, A&A, 339, 791
- Salpeter (1955) Salpeter E. E., 1955, ApJ, 121, 161
- Sandage et al. (1985a) Sandage A., Binggeli B., Tammann G. A., 1985a, AJ, 90, 1759
- Sandage et al. (1985b) Sandage A., Binggeli B., Tammann G. A., 1985b, AJ, 90, 395
- Schiavon et al. (2006) Schiavon R. P., Faber S. M., Konidaris N., Graves G., Willmer C. N. A., Weiner B. J., Coil A. L., Cooper M. C., Davis M., Harker J., Koo D. C., Newman J. A., Yan R., 2006, ApJ, 651, L93
- Skillman et al. (1989) Skillman E. D., Kennicutt R. C., Hodge P. W., 1989, ApJ, 347, 875
- Steidel et al. (1999) Steidel C. C., Adelberger K. L., Giavalisco M., Dickinson M., Pettini M., 1999, ApJ, 519, 1
- Trager et al. (1998) Trager S. C., Worthey G., Faber S. M., Burstein D., Gonzalez J. J., 1998, ApJS, 116, 1
- Tremonti et al. (2004) Tremonti C. A., Heckman T. M., Kauffmann G., Brinchmann J., Charlot S., White S. D. M., Seibert M., Peng E. W., Schlegel D. J., Uomoto A., Fukugita M., Brinkmann J., 2004, ApJ, 613, 898
- Zaritsky et al. (1994) Zaritsky D., Kennicutt Jr. R. C., Huchra J. P., 1994, ApJ, 420, 87