Kinematic properties of early-type galaxy haloes using planetary nebulae.††thanks: Based in part on observations made with the William Herschel Telescope operated by the Isaac Newton Group in the Spanish Observatorio del Roque de los Muchachos on the island of La Palma, of the Instituto de Astrofísica de Canarias, and on observations collected at the European Southern Observatory, Chile, Program: 76.B-0788(A).
Abstract
We present new planetary nebulae (PNe) positions, radial velocities, and magnitudes for 6 early-type galaxies obtained with the Planetary Nebulae Spectrograph (PN.S), along with derived two-dimensional velocity and velocity dispersion fields, and the parameters (i.e. the number of PNe per unit luminosity). We also present new deep absorption-line long-slit kinematics for 3 galaxies in the sample, obtained with the VLT/FORS2 spectrograph.
We extend this study to include an additional 10 early-type galaxies with PNe radial velocity measurements available from the literature, including previous PN.S studies, in order to obtain a broader description of the outer-halo kinematics in early-type galaxies. These data extend the information derived from stellar absorption-line kinematics to typically several and up to effective radii.
The combination of photometry, absorption-line and PNe kinematics shows: i) a good agreement between the PNe number density distribution and the stellar surface brightness in the region where the two data sets overlap; ii) a good agreement between PNe and absorption-line kinematics; iii) that the mean rms velocity profiles fall into two groups, with part of the galaxies characterized by slowly decreasing profiles and the remainder having steeply falling profiles; iv) a larger variety of velocity dispersion radial profiles; v) that twists and misalignments in the velocity fields are more frequent at large radii, including some fast rotator galaxies; vi) that outer haloes are characterised by more complex radial profiles of the specific angular momentum-related parameter than observed within 1 ; vii) that many objects are more rotationally dominated at large radii than in their central parts; and viii) that the halo kinematics are correlated with other galaxy properties, such as total B-band and X-ray luminosity, isophotal shape, total stellar mass, , and parameter, with a clear separation between fast and slow rotators.
keywords:
Galaxies: general – galaxies: haloes – galaxies: elliptical and lenticular, cD – galaxies: kinematics and dynamics1 Introduction
The dynamics of galaxies provide fundamental information on their origin and evolution. Our knowledge of the kinematics and dynamics of early-type galaxies is mainly based on measurements of the first 4 moments of the line-of-sight velocity distribution (LOSVD) from stellar absorption lines. These measurements are generally confined to within 1–2 effective radii () and can be obtained with long slits or integral-field units. Detailed LOSVD measurements for early-type galaxies (e.g., Bender et al. 1994; Fisher 1997; Pinkney et al. 2003; Emsellem et al. 2004) have provided us with a general picture of their dynamics. The higher-order moments are needed to obtain good constraints on the anisotropy and mass distribution (Gerhard 1993; Merritt 1993). Most of the studied objects appear to be isotropic or slightly radially anisotropic systems (Kronawitter et al. 2000; Cappellari et al. 2006). Some galaxies have revealed the presence of cold stellar discs whose kinematics stand out only after (Rix et al. 1999).
Kinematics of early-type galaxies are related to their isophotal shape. Deviations of the isophotes from a perfect ellipse are parameterised by the amplitude of the term in a Fourier expansion of the isophote radius in polar coordinates (e.g., Bender et al. 1988). Observational evidence (e.g., Bender 1988; Kormendy & Djorgovski 1989) implies that discy ellipticals () have significant rotation with and may generally be axisymmetric; boxy ellipticals () exhibit no rotation, have a range of values of including strongly anisotropic systems (), may be triaxial, and are in general more massive than discy ellipticals. These relations between isophotal shape and galaxy kinematics motivated Kormendy & Bender (1996) to revise the Hubble classification scheme for early-type galaxies using the parameter, which is related to intrinsic galaxy properties rather than the apparent ellipticity, which is related to the galaxy’s orientation on the sky.
A related modification to this scheme has been recently proposed by Emsellem et al. (2007), taking advantage of the advent of integral-field units. These allow for two-dimensional maps of the LOSVD moments typically out to (Emsellem et al. 2004). Early-type galaxies have been divided into two distinct classes: slow and fast rotators, according to the stellar angular momentum they possess per unit of mass. The two classes have different dynamical properties: slow rotators appear to be more massive systems, nearly round with a significant kinematic misalignment, implying a moderate degree of triaxiality, and span a moderately large range of anisotropies; fast rotators appear to be rather flattened systems, without significant kinematic misalignments, nearly axisymmetric and span a larger range of anisotropies (Cappellari et al. 2007).
In parallel, the arrival of large photometric surveys such as the Sloan Digital Sky Survey has consolidated findings of a bimodal colour distribution in local galaxies (e.g., Baldry et al. 2006), differentiating between a blue cloud of mostly starforming spiral galaxies and a red sequence of mostly non-starforming early-type galaxies.
Some of the main aims of galaxy formation studies are to understand the mechanisms that allow galaxies to evolve from the blue cloud to the red sequence, and to differentiate between processes that form early-type galaxies that are fast rotators or slow rotators. Numerical simulations suggest that red-sequence galaxies are formed by mergers of galaxies in the blue cloud, followed by a quenching of the star formation (e.g., Cattaneo et al. 2006; Faber et al. 2007; Kang et al. 2007; Romeo et al. 2008). The less-luminous fast rotators with discy isophotes are preferentially formed through a series of minor mergers with less massive companions. On the other hand, the more-luminous slow rotators with boxy isophotes, are thought to form through a violent major merger between galaxies of similar mass (e.g., Naab et al. 1999; Naab & Burkert 2003), or through multiple or hierarchical mergers (Weil & Hernquist 1996; Burkert et al. 2008).
These formation mechanisms are complicated further by the presence or absence of gas during the merger event, which plays a fundamental role in the final kinematic structure of the merger remnant (e.g., Barnes & Hernquist 1996; Naab et al. 2006; Ciotti et al. 2007). Mergers producing red-sequence galaxies dominated by rotation appear to be gas-rich (wet), while gas-poor (dry) mergers produce red-sequence galaxies dominated by random motions (e.g., Bournaud et al. 2005; Cox et al. 2006; Naab et al. 2006).
However, observations show that many of the most massive early-type galaxies were already in place by (van Dokkum et al. 2004; Treu et al. 2005), and the evolution of the galaxy luminosity function since redshifts of argues against a significant contribution of recent dissipationless dry mergers to the formation of the most massive early-type galaxies in the red sequence (Scarlata et al. 2007). Therefore it is clear that the processes forming elliptical galaxies are not yet completely understood.
Numerical simulations of galaxy formation in a cosmological context predict particular radial profiles for the total and dark matter distributions (e.g., Dekel et al. 2005; Naab et al. 2007), for the ratio (e.g., Abadi et al. 2006), the angular momentum, orbital distribution and isophotal shape (e.g., Naab et al. 2006), depending on which cosmology or merger type is assumed. The evaluation of these quantities from observations through dynamical models is fundamental to probe galaxy formation theories, numerical simulations and cosmological scenarios. Unfortunately the picture is complicated by the presence of unknown variables such as the three-dimensional shape of the galaxy and the orbital distribution. Therefore only detailed information on the LOSVD out to large radii can help to disentangle possible scenarios in galaxy formation.
In spiral galaxies (or generally in gas-rich systems), the distribution of dark matter can be determined by measuring the kinematics of neutral or ionised gas, which can be easily observed at large distances from the centre. This allowed for instance the discovery of the presence of dark matter in galaxies in the 1970s. Only a few early-type galaxies contain large gas rings with which the mass distribution can be traced out to several (e.g. Bertola et al. 1993; Oosterloo et al. 2002; Weijmans et al. 2008). In the large majority of ellipticals or lenticulars, the mass determination is more difficult because absorption lines from a stellar spectrum can be measured with a sufficient signal-to-noise ratio only up to 2 effective radii. Studies based on integrated light spectra provide evidence for dark matter only in a fraction of ellipticals, with the inferred mass profiles being nearly isothermal to the limit of the data and the dark matter contributing of the mass within (e.g. Kronawitter et al. 2000; Gerhard et al. 2001; Thomas et al. 2007). For other systems absorption-line data are not extended enough to provide conclusive evidence for dark matter (see, e.g., the detailed recent analysis of De Lorenzi et al. 2008a, b). The apparent dichotomy may be related to the fact that the logarithmic gradient of the mass-to-light ratio correlates with luminosity (Napolitano et al. 2005), suggesting a link between the structural parameters and the total mass of ellipticals.
In order to extend the kinematic information for early-type galaxies to larger radii, alternative kinematic tracers have been identified to compensate for the rapid fall-off in the stellar light at radii larger than , such as globular clusters and planetary nebulae (PNe). In particular, a lot of effort has been focused on PNe in the last decade: they are generally believed to trace the main stellar population of elliptical galaxies, and their relative bright [O III] emission line allows them to be easily detected at large radii from the centre, making them an ideal tool for kinematic studies.
A dedicated instrument was installed at the William Herschel Telescope: the Planetary Nebulae Spectrograph (PN.S, Douglas et al. 2002). In the last seven years, our team has undertaken a long-term observational campaign aimed at measuring the kinematics of a selected sample of ellipticals and S0s, with the principal aim to quantify the dark matter content in those systems. An initial sample of round (E0–E2) and bright () galaxies has been selected, and later enlarged to include more flattened objects ( E5) and S0s. A series of papers has been published, presenting the initial results of the PN.S survey on early-type galaxies and their dynamical analysis (Romanowsky et al. 2003; Douglas et al. 2007; Noordermeer et al. 2008; De Lorenzi et al. 2008b; Napolitano et al. 2008)).
To provide a general overview of the outer kinematics ( ) of early-type galaxies and fundamental constraints on formation scenarios, we have used the literature to collect all the existing PNe kinematics in ellipticals and S0s, amounting to 10 objects in total. This includes galaxies previously observed with the PN.S as well as galaxies observed by other authors using different telescopes and techniques.
In this paper we also present new PNe measurements for 6 galaxies obtained with the PN.S. We will refer to them as sample A, while we will divide the other 10 galaxies from the literature into sample B (6 galaxies with more than 80 PNe radial velocity measurements) and sample C (4 galaxies with less than 80 PNe radial velocity measurements) in the rest of the paper. The total sample consists of 16 galaxies, and their principal characteristics are summarised in Table 1. In Section 2 we present the PN.S. observations, in Section 3 we compare the PNe spatial distribution to the stellar surface brightness. In Section 4 the smoothed two-dimensional velocity and velocity dispersion fields are derived and compared to the corresponding stellar kinematic data. In Section 5 we provide notes on the individual galaxies. In Section 6 we discuss the general kinematic properties of early-type galaxies at large radii obtained from the combination of stellar and PNe kinematics for all the galaxies in the sample, and we close with a summary of our work in Section 7.
| Name | Type | PA | Log | Reference | ||||||
|---|---|---|---|---|---|---|---|---|---|---|
| (Mpc) | () | (′′) | (∘) | (’) | Log (erg s-1) | |||||
| (1) | (2) | (3) | (4) | (5) | (6) | (7) | (8) | (9) | (10) | (11) |
| NGC 821∗ | E6 | 22.4 1.8 | 1735 | 11.72 | 39 | 25 | 123(4) | 6.8 | 40.33 | |
| NGC 3377∗ | E5 | 10.4 0.4 | 665 | 11.07 | 41 | 35 | 151(3) | 10.0 | 39.60 | |
| NGC 3608∗ | E2 | 21.3 1.4 | 1253 | 11.69 | 40 | 75 | 87(5) | 6.8 | 40.01 | |
| NGC 4374∗ | E1 | 17.1 0.9 | 1060 | 10.01 | 53 | 135 | 450(7) | 6.9 | 40.83 | |
| NGC 4564∗ | E6 | 13.9 1.1 | 1142 | 12.05 | 22 | 47 | 49(1) | 7.5 | 39.85 | |
| NGC 5846∗ | E0 | 23.1 2.1 | 1714 | 10.91 | 53 | 70 | 123(1) | 6.0 | 41.65 | |
| NGC 1023∗ | S0 | 10.6 0.8 | 637 | 10.08 | 46 | 87 | 183(20) | 10.8 | 39.6 | Noordermeer et al. (2008) |
| NGC 1344 | E5 | 18.4 2.5 | 1169 | 11.24 | 46 | 165 | 194(3) | 6.7 | 39.48 | Teodorescu et al. (2005) |
| NGC 3379∗ | E1 | 9.8 0.5 | 889 | 10.18 | 47 | 70 | 186(5) | 7.2 | 39.54 | Douglas et al. (2007) |
| NGC 4494∗ | E1 | 15.8 0.8 | 1344 | 10.55 | 53 | 0 | 255(12) | 7.6 | 40.10 | Napolitano et al. (2008) |
| NGC 4697 | E6 | 10.9 0.7 | 1236 | 10.07 | 66 | 70 | 535(0) | 6.6 | 40.12 | Méndez et al. (2001) |
| NGC 5128 | S0 | 4.2 0.3 | 547 | 7.30 | 255 | 35 | 780 | 8.4 | 40.10 | Peng et al. (2004) |
| NGC 1316 | S0 | 20.0 1.6 | 1793 | 9.40 | 109 | 50 | 43 | 4.3 | 40.87 | Arnaboldi et al. (1998) |
| NGC 1399 | E1 | 18.5 1.4 | 1447 | 10.44 | 42 | 110 | 37 | 8.3 | 41.63 | Saglia et al. (2000) |
| NGC 3384 | S0 | 10.8 0.7 | 704 | 10.75 | 50 | 53 | 68 | 2.4 | 39.52 | Tremblay et al. (1995) |
| NGC 4406 | E3 | 16.0 1.0 | -244 | 9.74 | 91 | 130 | 16 | 4.0 | 42.05 | Arnaboldi et al. (1996) |
Notes – Col.1: Name of galaxy. Galaxies marked with ∗ have been observed with the PN.S. Col.2: Morphological type of galaxy according to the NASA/IPAC Extragalactic Database (NED). Col.3: Distance of galaxy from Tonry et al. (2001) derived using the surface brightness fluctuations method. Distance moduli are shifted by mag to take into account the new Cepheid zero point of Freedman et al. (2001) as done by Jensen et al. (2003). Col.4: Galaxies’ heliocentric systemic velocity listed in NED. Col.5: Total magnitude corrected for extinction and redshift listed in de Vaucouleurs et al. (1991, RC3 hereafter). Col.6: Effective radii given by Blakeslee et al. (2001). Col.7: Galaxy photometric position angle as given by RC3, except for NGC 1399 (Saglia et al. 2000), NGC 3379 (Capaccioli et al. 1990) and NGC 4494 (Napolitano et al. 2008). Col.8: Total number of PNe with measured radial velocities. In parentheses we give the number of sources excluded by the friendless algorithm (not included in the listed total PNe number), for those galaxies for which we applied our adaptive kernel smoothing technique (see Section 4.2). Col.9: Maximum distance of the PNe detections from the galaxy centre. Col.10: Logarithmic X-ray bolometric luminosity according to O’Sullivan et al. (2001), except for NGC 1023, whose X-ray luminosity was converted from 0.5-2 keV measurements of David et al. (2006) to bolometric luminosity following the prescription of O’Sullivan et al. (2001). Col.11: Reference for the PNe data. The horizontal lines separate the galaxies with new PNe catalogues presented in this paper (sample A), from the other galaxies whose PNe data are available in the literature, with more than 80 PNe radial velocities (sample B) and with less than 80 PNe radial velocity measurements (sample C).
2 Observations and data reduction
For galaxies in sample A, we present new PNe positions, radial velocities and magnitudes, obtained as part of the PN.S elliptical galaxy survey. For these sample A galaxies, data reduction, PNe identification, radial velocity and magnitude measurements are performed using the procedures described in Douglas et al. (2007). Catalogues with positions, velocities and magnitudes of PNe in galaxies of sample A are shown in Table 2. Heliocentric systemic velocities derived from PNe are in agreement within the errorbars with the values tabulated in either the RC3 or NED catalogues. Instrumental magnitudes are shifted in order to match the bright cut off of the luminosity function with the expected apparent magnitude , where is the distance in Mpc given in Table 1 and is the absolute magnitude of the cut-off according to Ciardullo et al. (1989b).
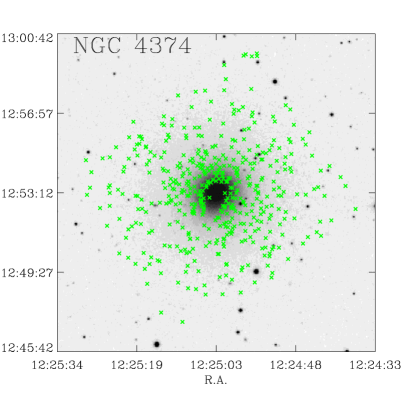
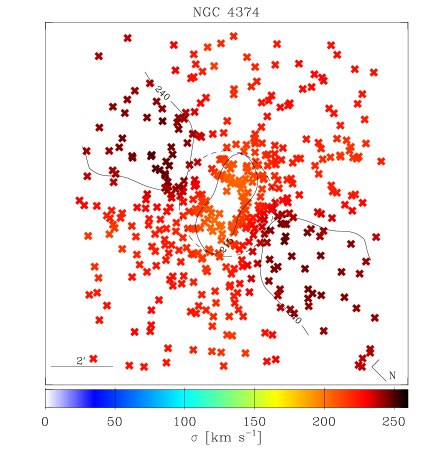
The number of PNe detected using the PN.S is over 100 for the majority of the galaxies, with a remarkable number of 457 objects for NGC 4374. This is a major improvement when compared to the results of previous techniques and instruments (typically 50 detections). In the following sections, we use only PNe whose velocities are within of the mean velocity of their neighbours, according to the “friendless algorithm” described in Merrett et al. (2006).
3 PNe spatial distribution
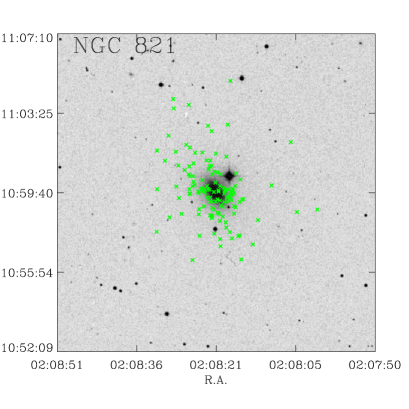
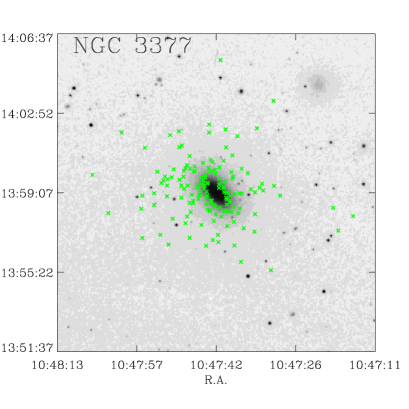
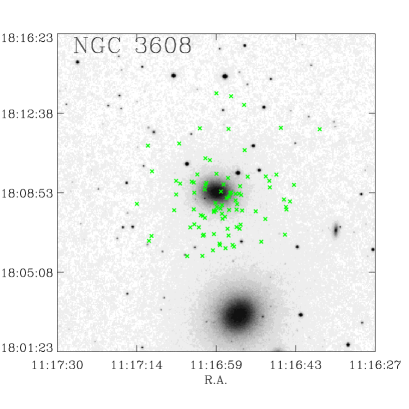
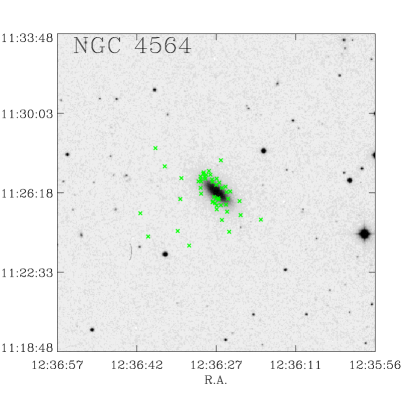
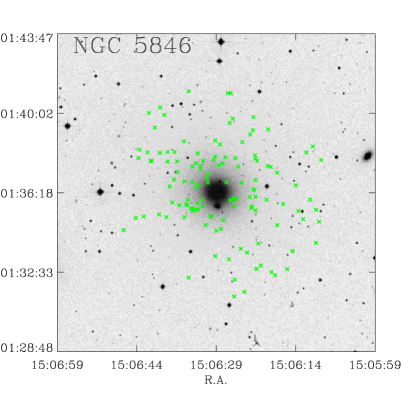
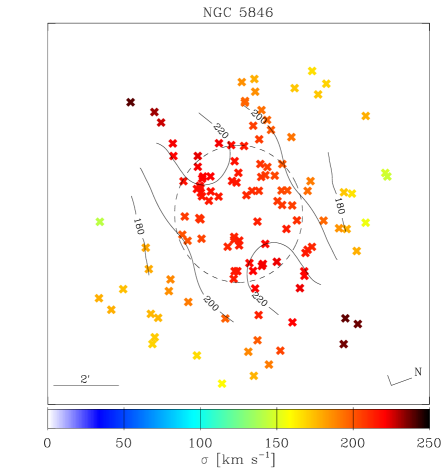
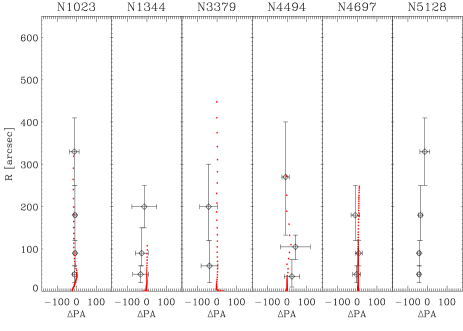
Figure 1 shows the spatial distribution of the PNe in sample A galaxies. For the PNe positions in the galaxies of samples B and C, we refer to the references listed in Table 1.
The first property of the PNe spatial distribution we would like to investigate is whether or not the number density of the PNe follows the stellar surface brightness. This has already been tested for many galaxies in the sample (see reference list in Table 1), finding generally a good agreement between the surface brightness and PNe counts. 111In some cases this could be complicated by population effects. For example, Sambhus et al. (2006) found a subpopulation of bright PNe in NGC 4697, which are geometrically and kinematically peculiar. To discover such effects in the PN distribution requires both a large PN sample and accurate PN magnitudes, depending on how clear the signature is. Here we only consider how well the entire PN population agrees with the surface photometry.
From Figure 1 we see that to a first approximation the two-dimensional distribution of PNe is symmetric. NGC 821 and NGC 4564 are possible exceptions in that they may show an excess of PNe at large radii on their SE side. Unfortunately, the number of PNe in those regions is too small to determine whether the asymmetry in the distribution is statistically significant.
In the following sections we present a comparative study between PNe density number density and stellar surface brightness for the galaxies in sample A and B. For the galaxies in sample C, the PNe samples are too small to perform this analysis.
In Section 3.1 we describe the stellar surface brightness and in Section 3.2 we compare it to the radial PNe number density.
3.1 Photometric data of the stellar component
Radial profiles of the stellar surface brightness, position angle, ellipticity , and shape parameter were obtained from the combination of different datasets in the literature. Mean values are shown in Table 3 together with the sources of the photometry.
Usually we considered HST photometry in the innermost , ground based observations for and their average values in between.
From the and radial profile we derived their characteristic values by averaging the values within the range as done in Bender et al. (1988), Peletier et al. (1990) and Hao et al. (2006). As weights in the average procedure, we use the ratios where is the flux measured at that position and is the error in the ( or ) measurement. Errors in and are computed by measuring the scatter of the measurements in the same spatial region.
The surface brightness radial profiles were fitted with i) a Sérsic profile and ii) a plus exponential disc profile, using the robust Levenberg-Marquardt method implemented by Moré et al. (1980). The actual computation was done using the mpfit algorithm implemented by C. Markwardt under the IDL environment 222The most recent version of the mpfit algorithm can be found at http://cow.physics.wisc.edu/craigm/idl/fitting.html. We would like to note that the aim is not to study in detail the photometric components of the galaxies, but instead to obtain a general description of the mean radial profile of the stellar light. In the cases where HST data were not available, we excluded the innermost or from the fit, to reduce possible contamination due to seeing effects. Results of the fit are shown in Table 3.
| Name | R.A. | Dec | ||
|---|---|---|---|---|
| PNS-EPN- | hh:mm:ss | deg:mm:ss | mag | |
| (1) | (2) | (3) | (4) | (5) |
| NGC821-001 | 02:08:01.6 | +10:58:52.4 | 28.8 | |
| NGC821-002 | 02:08:05.5 | +10:58:45.2 | 28.1 | |
| NGC821-003 | 02:08:06.7 | +11:02:03.4 | 27.7 | |
| NGC821-004 | 02:08:10.4 | +11:00:00.4 | 28.6 | |
| NGC821-005 | 02:08:13.0 | +10:58:22.4 | 29.7 | |
| NGC821-006 | 02:08:14.0 | +10:57:13.7 | 28.7 | |
| NGC821-007 | 02:08:15.8 | +10:59:22.3 | 28.3 | |
| NGC821-008 | 02:08:16.1 | +10:59:20.0 | 28.3 | |
| NGC821-009 | 02:08:16.2 | +10:56:31.0 | 28.7 | |
| NGC821-010 | 02:08:16.4 | +11:00:17.5 | 28.8 | |
| .. | ||||
| NGC5846-124 | 15:06:46.9 | +01:34:32.2 | 28.1 |
Notes – The complete table is published as Supplementary Material in the online version of this article. PNe catalogues are also available at http://www.strw.leidenuniv.nl/pns. Col.1: PNe name according to the IAU standards (PNS-EPN-<galaxy name>-<sequential number>). Col.2: Right ascension (J2000). Col.3: Declination (J2000). Col.4: Radial velocity in the heliocentric reference system. Col.5: Apparent magnitude. Magnitudes have an error of mag.
3.2 Comparison between PNe spatial distribution and surface brightness profiles
In order to compare the stellar surface brightness and the PNe number density, we have to take into account the incompleteness in the PNe detections, e.g. the number of undetected PNe because of their low signal-to-noise ratio. The noise in the field has four main contributions, the sky surface brightness (constant all over the field), the detector readout noise (constant all over the field), the galaxy background (variable over the field) and the presence of foreground stars (variable over the field).
To measure how these four noise sources affect the PNe detection and correct the PN number counts we proceed as follows:
-
•
We first generate artificial images, which mimic the sky and CCD readout noise in our observations and then we populate them with simulated point-like sources of different magnitudes.
-
•
We compute the planetary nebulae luminosity function (PNLF) of the simulated objects in the artificial images. In particular, we evaluate the magnitude at which the loss of objects is significant. is defined in such a way that for , more than 80% of PNe are recovered.
-
•
Now we consider the real, observed images and we insert a set of artificial point-like sources in them with a distribution in magnitude given by the observed PNLF, but brighter than . In this way we are sure (at a 80% confidence level) that our artificial sources would not be undetected because of the background noise (sky plus CCD readout noise).
-
•
We detect the artificial sources in the real images again, and since we know their positions, we can compute the radial completeness factor , i.e., the inverse of the fraction of simulated objects recovered at different distances from the galaxy centre333Distance from the centre is computed taking into account the mean galaxy ellipticity: , where is aligned along the major axis.. Since we inserted only sources with , the loss of objects is attributed only to the galaxy continuum and the stellar trails contamination rather than the sky background or detector noises.
-
•
Finally, we group the observed PNe in elliptical annuli, oriented along the galaxy photometric major axis. We compute , the number of PNe brighter than in each annulus (corrected for the radial completeness factor evaluated at the annuli centres), divided by the area of the annulus. We then compute the logarithmic PNe number density .
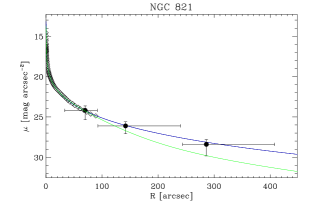
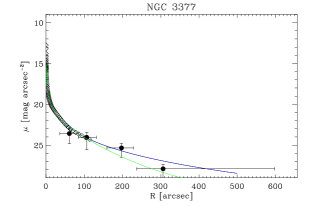
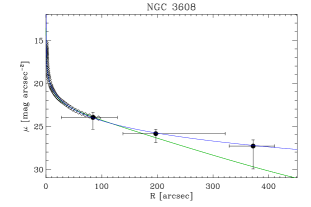
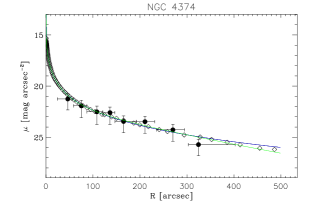
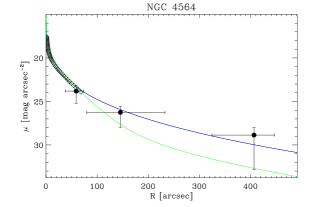
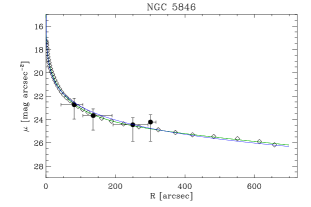
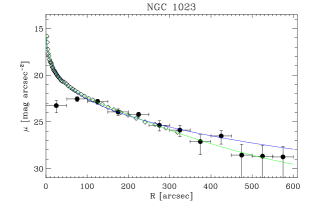
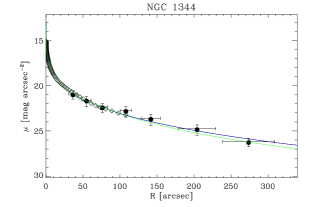
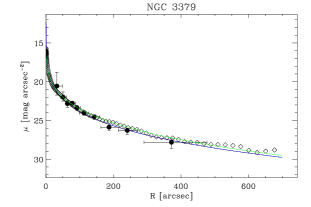
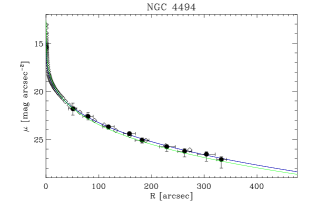
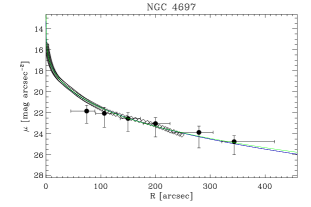
In Figure 2 we show the comparison between the major axis stellar surface brightness profile and for galaxies in samples A and B444NGC 5128 is not included because of the lack of an extended surface brightness radial profile.. is shifted by an arbitrary constant (different for each galaxy) to match the stellar profile.
For NGC 1344 and NGC 4697, which are not part of the PN.S dataset, we could not evaluate the completeness correction with simulated sources because the reduced images were not available. This affects mostly the innermost regions of NGC 4697, in which the inner PNe density profile in Figure 2 falls slightly below the stellar surface brightness profile.
| Name | Band | n | Reference | ||||||||
|---|---|---|---|---|---|---|---|---|---|---|---|
| NGC | [mag arcsec-2] | [′′] | [mag arcsec-2] | [′′] | [mag arcsec-2] | [′′] | [%] | ||||
| (1) | (2) | (3) | (4) | (5) | (6) | (7) | (8) | (9) | (10) | (11) | (12) |
| 821 | B | (1),(2) | |||||||||
| 3377 | B | (1),(2),(3) | |||||||||
| 3608 | B | (2),(3) | |||||||||
| 4374 | V | (4) | |||||||||
| 4564 | B | (1) | |||||||||
| 5846 | V | (5) | |||||||||
| 1023 | B | (∗) | (6) | ||||||||
| 1344 | V | (7) | |||||||||
| 3379 | B | (8),(9) | |||||||||
| 4494 | V | (10) | |||||||||
| 4697 | B | (2),(11) |
Notes – Col.1: Galaxy name. Galaxies in sample A are listed in the upper part of the table. The lower part of the table contains the sample B galaxies except NGC 5128. Col.2: Photometric band. Col.3: Surface brightness at . Col.4: Scale radius determined from the Sérsic fit. Col.5: Sérsic index. Col.6: Bulge brightness at for the exponential disc fit. Col.7: Bulge effective radius for the exponential disc fit. Col.8: Central surface brightness of the exponential disc for the exponential disc fit. Col.9: Scale radius of the exponential disc component fit. Col.10: Weighted mean value for ellipticity in the range . Col.11: Weighted mean value for the parameter in the range . Positive values correspond to discy isophotes, negative values to boxy isophotes. (∗) From Emsellem et al. (2007). In that paper the error on is not given, therefore we assumed an arbitrary error of 0.1. Col.12: Reference for the photometric datasets: (1) Goudfrooij et al. (1994); (2) Lauer et al. (2005); (3) Jedrzejewski (1987); (4) Kormendy et al. (2008); (5) Kronawitter et al. (2000); (6) Noordermeer et al. (2008); (7) Sikkema et al. (2007); (8) Capaccioli et al. (1990); (9) Gebhardt et al. (2000); (10) Napolitano et al. (2008); (11) De Lorenzi et al. (2008a).
The conclusion we can derive from this comparison is that the stellar surface brightness and PNe counts agree well for the galaxies where the two sets of data overlap in radius. In the cases where the stellar surface brightness measurements are not extended enough in radius to ensure an overlap with the PNe data, the PNe number density still follows the extrapolation of the surface brightness fits at larger radii.
4 PNe kinematics
In this section we analyse the kinematics of the sample galaxies using their PNe radial velocities and compare them to long-slit absorption-line kinematics.
In Section 4.1 we define the “folded catalogue”, which we will use in Section 4.2, 4.3 and 4.4 to measure the global velocity and velocity dispersion fields of the PNe system and their associated errors. In Section 4.5 we extract velocity and velocity dispersion radial profiles from the PNe data and compare them to stellar profiles, to test the consistency of the two sources of kinematic information.
This analysis is done only for galaxies in samples A and B for which sufficient data are available.
4.1 Folded catalogue
To decrease the statistical noise resulting from a low detection number, we assume that the galaxy is point-symmetric in phase space. Therefore each point in phase space, has a mirror counterpart . Here and give the positions of the PNe on the sky, and are centred on the galaxy with aligned along the galaxy photometric major axis, and gives the radial velocities of the PNe corrected for the galaxy’s systemic velocity (therefore at , ). By the union of the original data set and the mirrored one, we virtually double the number of data points. This technique has often been adopted in the past (e.g., Arnaboldi et al. 1998; Peng et al. 2004). Hereafter, the term “folded catalogue” refers to the PNe catalogue obtained by the union of the original one and the mirrored counterpart, and we use this one to map the 2-D kinematics of the PNe system. The reliability of the point symmetry assumption is tested a posteriori by repeating the calculations using only the original catalogue and comparing the two results. We note that in almost all cases the computed quantities based on the original and folded PNe samples agree well; only in the case of NGC 4374, the rotation field shows asymmetries of the order of 25 km s-1 (Section 5.1.4).
4.2 Construction of smoothed two-dimensional velocity and velocity dispersion fields
The computation of the two-dimensional velocity and velocity dispersion fields from the folded catalogue was done using an adaptive kernel smoothing technique, which improves on the method described in Peng et al. (2004). For comparison, two examples of unsmoothed velocity fields are shown in Appendix B.
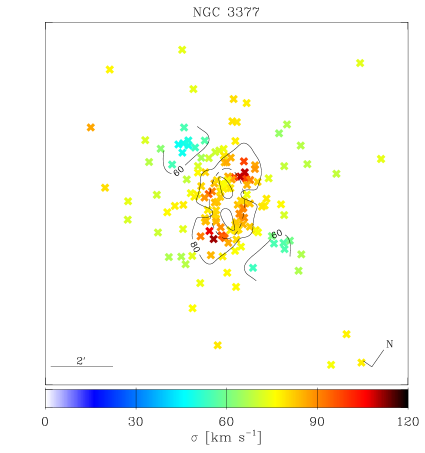
As stated in Section 3, we use only PNe whose velocities are within of the mean velocity of their neighbours. Generally, the outliers we rejected are few, and they make no difference to the output velocity and velocity dispersions fields. The only exceptions are the two galaxies NGC 3377 and NGC 3608 in which small variations in the resulting two dimensional fields are seen when outliers are included. However, the outliers in these two cases were more than away from the galaxy systemic velocity and therefore we are confident that their exclusion is justified.
At every position on the sky we computed the velocity and velocity dispersion by:
| (1) |
| (2) | |||||
where is the th PN velocity and is the measurement error (20 ), which is a combination of instrumental error related to the PN.S (17 , Merrett et al. 2006) and the accuracy in determining the planetary nebula position (a few ); is the distance-dependent weight for the th PN, defined using the Gaussian kernel:
| (3) |
where is the kernel amplitude and is the distance of the th PN from .
Errors on and are obtained using Monte Carlo simulations, which will be discussed in Section 4.3.
The weighting procedure depends on the distance from and on the amplitude of the kernel. The latter is a measure of the spatial resolution at which we would like to investigate the kinematics. Large values of will lead to smoother profiles of the velocity and velocity dispersion fields, highlighting the general trend but suppressing kinematic structures at small scales. Conversely, smaller values of will allow a better spatial resolution, with the risk of amplifying the noise pattern due to the low number of PNe and the measurement errors. The optimal must therefore be chosen in order to find the best compromise between spatial resolution and noise smoothing. It can be different at each point in the observed field, since it depends on the number density of points, the velocity gradient and the velocity dispersion we want to resolve.
To determine , we proceeded as follows. At each position on the fields, we define to be linearly dependent on the distance of the closest PN. We arbitrarily chose but tested in a range finding no significant differences in the final results, even for those galaxies with a relatively low number of PNe.
| (4) |
where , are the coordinates of the th closest PN to . Our definition of can be used also to define the local PNe number density :
| (6) |
The way is defined through Equation 4 (and its equivalent Equation 6) allows it to be smaller in the innermost regions where the spatial density is bigger and larger in the outer regions, where the PNe density is smaller.
In order to select the most appropriate constants and , we built simulated sets of PNe (with the number density resembling the observed one) with radial velocities distributed according to a chosen velocity gradient and velocity dispersion, which mimic the observations. The artificial sets were processed with the adaptive kernel procedure using different values of and until the simulated input velocity field was recovered. Therefore, for a given density, velocity gradient and velocity dispersion we have the most reliable values for and to use which give the best compromise between kinematic resolution and smoothing (see Table 4).
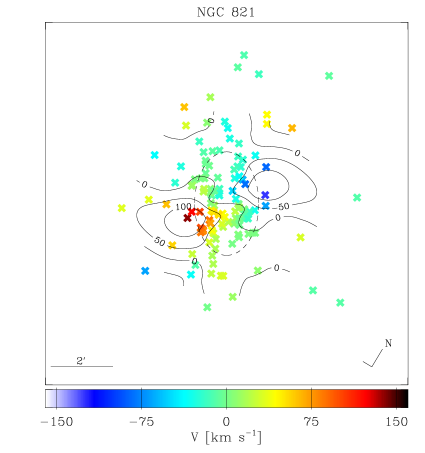
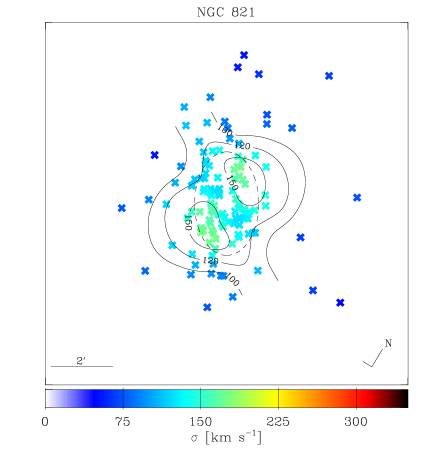
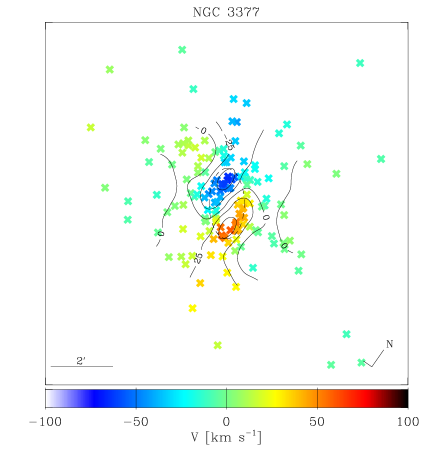
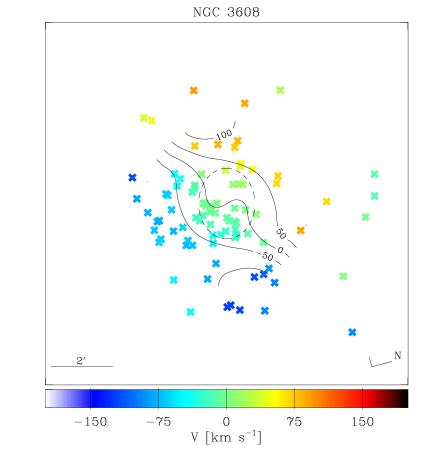
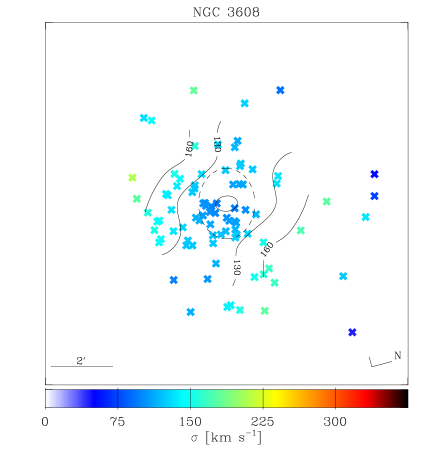
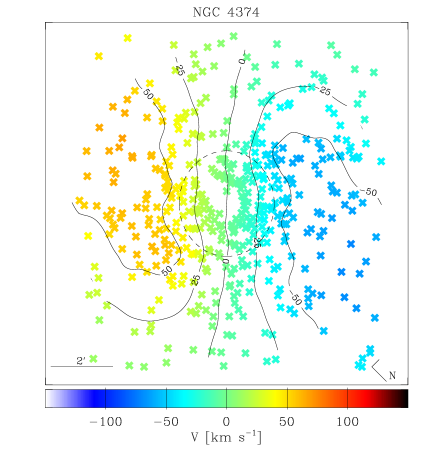
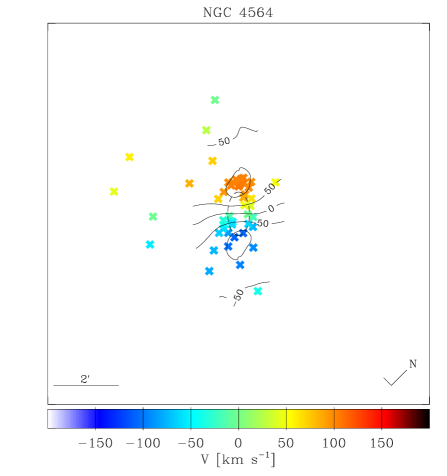
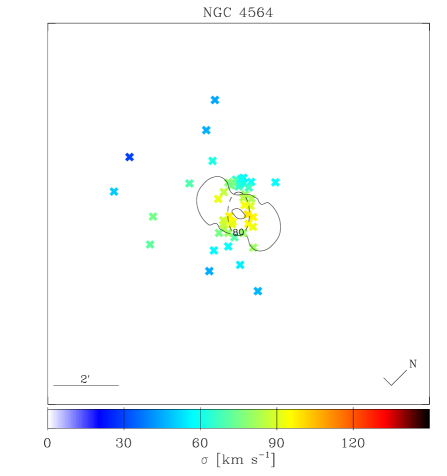
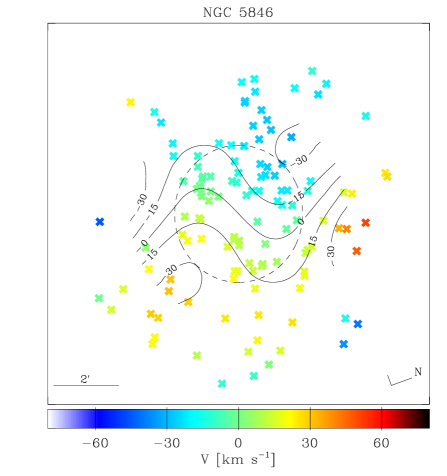
We show in Figure 3 the smoothed two-dimensional velocity and velocity fields for galaxies in sample A derived with this technique. The two-dimensional fields of the sample B galaxies are presented in Appendix B.
| Name | ||||
|---|---|---|---|---|
| arcsec | ||||
| (1) | (2) | (3) | (4) | (5) |
| NGC 0821 | 0.24 | 10.68 | 30 | 20 |
| NGC 3377 | 0.57 | -0.08 | 25 | 20 |
| NGC 3608 | 0.08 | 33.56 | 40 | 30 |
| NGC 4374 | 0.97 | 22.72 | 25 | 20 |
| NGC 4564 | 0.24 | 10.68 | 20 | 20 |
| NGC 5846 | 0.00 | 60.00 | 50 | 30 |
4.3 Errors in the velocity and velocity dispersion fields
Errors on the derived smoothed velocity and velocity dispersion fields are computed by means of Monte Carlo simulations.
For each galaxy, we built 100 datasets of PNe with simulated radial velocities at the same positions as in the observed (folded) dataset, to mimic the observations. The radial velocity for each simulated object was calculated from the observed two-dimensional smoothed velocity field by the addition of a random value. The random value must resemble the observed velocity dispersions and associated measurement errors and therefore it was chosen randomly from a Gaussian distribution centred at 0 and with dispersion equal to
| (7) |
where is the velocity dispersion measured at that position and is the velocity error.
These simulated datasets were processed with the same reduction script and parameters as the observed ones. The statistics of the simulated velocity and velocity dispersion fields give us the error associated with any position in the observed fields. Average values are given in Table 4.
Two-dimensional error fields are not shown, but errors derived from them will be shown in the plots of the kinematics extracted along the kinematic major axis (Section 4.3.1) and along the photometric major and minor axes (Section 4.5.2).
These simulations are used also to investigate two main aspects: i) if the measured rotation is significant; and ii) if the misalignment between kinematic () and photometric () major axes or the twisting of the velocity fields are significant.
4.3.1 Testing the rotation
We extracted the velocity curve along the kinematic major axis of the PNe system from the smoothed two-dimensional velocity field. To find its direction, we fitted the PNe velocities with a simple rotation model:
| (8) |
where is the position angle of the PN on the sky, the constant measures the amplitude of rotation and is the position of the kinematic major axis. Angles are measured on the sky plane, starting from North going counterclockwise.
Then we created 100 simulated data sets of PNe at the same positions as the observed ones, with velocity equal to zero plus a random error. The random value was generated as in Section 4.3, from a Gaussian distribution with mean zero and dispersion depending on the observed velocity dispersion and the measurement error (see Equation 7).
We built the two-dimensional velocity field from the simulated catalogues using the same procedures and the same parameters adopted for the real catalogues, and we extracted the simulated rotation curve along the direction of the kinematic major axis.
Since the simulated catalogues were artificially generated to have their PNe velocities consistent with 0 , the rotation we observed on the simulated two-dimensional fields is only an artifact of the noise, as specified by the limited number of data points, the measurement errors and the intrinsic velocity dispersion of the galaxy.
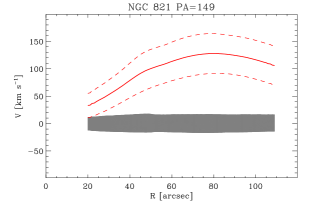
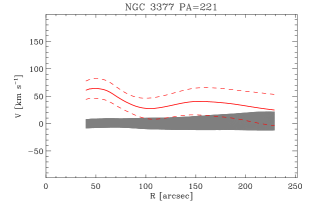
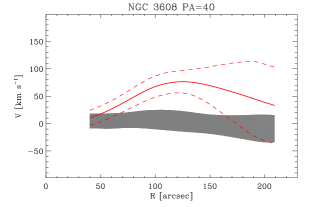
By looking at the distribution of the 100 simulated rotation curves, we determined the region in position-velocity space where the rotation is consistent with 0 at the level. In Figure 4 we show the velocity radial profiles measured along the kinematic major axis of the observed two-dimensional field together with the confidence level of zero rotation.
The general result is that the PNe rotation we measure is real (with the exception of NGC 5846). The typical 1 range in which the velocity is consistent with zero is around , depending mostly on the number of detections and the velocity dispersion value.
4.3.2 Testing misalignment and twisting
In this section we investigate how precisely we are able to identify the kinematic major axis of the PNe system (and thereby ascertain whether the misalignment with the photometric axis is consistent with zero or not). We also investigate the reliability of distortions in the velocity field, which may be interpreted as an effect of triaxiality.
To do that, we measured the kinematic position angle of all the simulated fields computed in Section 4.3. The standard deviation of these values gives us an estimate of the error in the kinematic major axis determination. These errors typically range between 10 and 25 degrees, depending on the number of PNe, and on the amount of rotation and velocity dispersion: errors are smaller in galaxies with larger number of PNe and higher (see also Napolitano et al. 2001). Results for and errors are given in Table 5, as well as the misalignment between kinematic and photometric major axes. The kinematic and photometric major axes are aligned in NGC 3377 (on average) and NGC 4564, but misaligned in NGC 821, NGC 3608 (marginally) and NGC 4374.
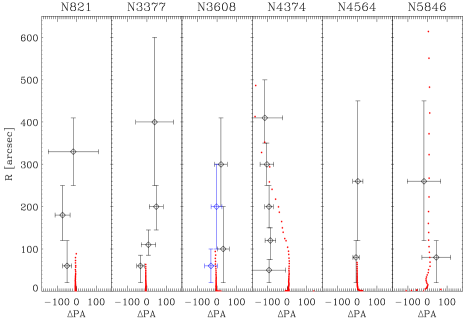
The kinematic major axis might also not be constant with radius. To test that, for each galaxy we divided the PNe dataset into elliptical annuli (the ellipticity of each annulus is the galaxy’s mean ellipticity, as given in Table 3) and calculated the position angle at each radial position using Equation 8 and Monte Carlo simulations to compute the errors. This is shown in Figures 5 and 6 for galaxies of Sample A and Sample B respectively.
A significant twist is observed in NGC 3377. In the inner region () the kinematic position angle (on the receding side) is , while in the outer regions it decreases linearly to a value of at . In the last measured bin, the rotation is very low (see Section 5.1.2) and therefore errors in are too large to derive definitive conclusions. For other galaxies, the twist is consistent with 0 within the errors.
Together with the kinematical twisting, Figures 5 and 6 also show the difference between kinematic and photometric major axis, using as zero point. An interesting case is NGC 4374: the mean is misaligned by with respect to (see discussion in Section 5.1.4) and the photometric position angle radial profile changes by , reaching in the halo regions.
| Name | Twist? | ||||
| (NGC) | (deg) | (deg) | (deg) | (deg) | |
| (1) | (2) | (3) | (4) | (5) | (6) |
| 0821 | NO | 31 | 6 | ||
| 3377 | YES | 226 | 11 | ||
| 3608 | NO | 10 | |||
| 4374 | NO | 141 | 6 | ||
| 4564 | NO | 49 | 2 | ||
| 5846 | NO | 306 | 56 | ||
| 1023 | NO | 89 | 2 | ||
| 1344 | NO | – | – | ||
| 3379 | NO | 2 | |||
| 4494 | NO | – | – | ||
| 4697 | NO | – | – | ||
| 5128 | NO | – | – |
Notes – Col.1: Galaxy name. The horizontal line separates galaxies of Sample A and Sample B. Col.2: Kinematic position angle of the PNe system (receding side), measured from North towards East. Col.3: Absolute difference between and . is given in Table 1. In the case of NGC 5846, the measured rotation is consistent with 0 ; therefore the error on is very large and the measurement of itself is not useful. Col.4: Twisting of the PNe kinematic major axis, if present. Col.5: Kinematic position angle of the stars (receding side), measured from two dimensional velocity maps, if available (Cappellari et al. 2007). Col.6: Absolute difference between and .
4.4 Results for the velocity and velocity dispersion fields
Smoothed two-dimensional velocity and velocity dispersion fields are shown in Figure 3 and Appendix B for the galaxies in sample A and sample B. They will be used in the computation of the (proxy for angular momentum per unit mass) (Section 6.3), the outer ratio (Section 6.2), and in the comparison with stellar kinematics (Section 4.5.2).
A general result emerging from inspection of the velocity fields in Figure 3 and the quantitative analysis in Figure 4 is that rotation is present in all sample A galaxies, except in NGC 5846 in which the rotation is consistent with 0 (see Section 4.3.1).
In the galaxies with significant rotation, the kinematic major axis may or may not be aligned with the photometric major axis, within the error bars (see Table 5). Both are aligned in NGC 3377 (on average) and NGC 4564, but misaligned in NGC 821, NGC 3608 (marginally) and NGC 4374. In the sample B galaxies, misalignment is seen in Cen A (NGC 5128) and (marginally) in NGC 1344 and NGC 3379. Individual cases will be discussed separately in Section 5.
Twisting of the kinematic major axis is significant only in NGC 3377 (Figure 5).
4.5 Comparison with stellar kinematics
An important aspect of our analysis is to check whether the PNe kinematics is in agreement with the stellar absorption-line kinematics. To do that, we retrieved major and minor (where available) stellar kinematic data from the literature and we compared it to the PNe kinematics extracted along the same axis.
4.5.1 Long-slit kinematics
Stellar kinematics from long-slit or integral-field spectroscopy is available in the literature for the majority of the galaxies. We give the list of references for each galaxy in Section 5. For two galaxies in sample A (NGC 3377 and NGC 4374), we obtained new deep long-slit observations. Also the E1 galaxy NGC 4494, which is part of the PN.S galaxy sample, was observed during this run. Its PNe kinematics and properties together with a new dynamical analysis are discussed in a separate paper (Napolitano et al. 2008).
Appendix C gives the kinematic data derived from the long-slit spectra.
4.5.2 PNe radial profiles and comparison with stellar kinematics
Radial kinematic profiles have been extracted from the PNe data in two different ways.
The first method uses the interpolated smoothed two-dimensional fields and their errors presented in Sections 4.2 and 4.3. The second method selects only those PNe within an angular section aligned along a desired position angle (the same for which the stellar kinematics are observed). Usually the range of angles is between 30 and 60 degrees, depending on the number of PNe. Then the selected PNe are folded to positive radii (i.e., the receding side of the system) and grouped into radial bins containing the same number of PNe. The number of objects per bin ranges from 10 to 30, to reach a compromise between number of bins and a statistically significant number of PNe in each bin. In each bin the weighted mean velocity and velocity dispersion are computed, weights are computed from the measurements errors on the PNe velocities. The derived values of and change by less that 10 if instead all weights are equal, or if the weights from Hargreaves et al. (1994) are used. Errors are computed with the usual formulae and .
Both methods have the advantage that we can extract the radial profile along any direction we desire, and the disadvantage that it might be contaminated by PNe far away from the direction we are interested, by the use of a large kernel smoothing parameter in the first method or a large angular range in the second. Especially if a nearly edge-on disk is present, both techniques could therefore lead to systematically low rotation and systematically high dispersions on the major axis, caused by the dilution from off-axis velocities. However, simple simulations show that this effect is smaller than the error bars in the measurement, and in any case leads to an underestimate of the significance of rotation in Figure 4.
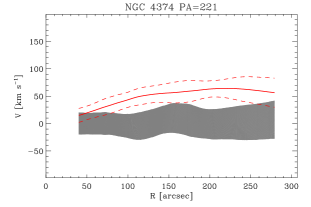
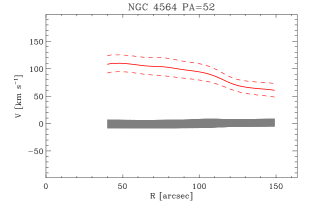
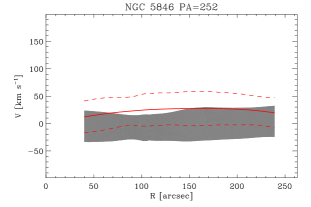
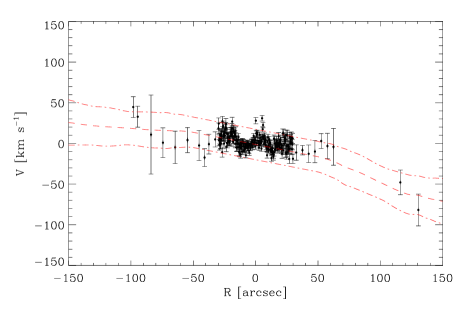
In Figure 7 we compare the (folded) velocity and velocity dispersion radial profiles of stars and PNe. In general the stellar and PNe kinematics agree well, with NGC 821 as the most uncertain case. A more detailed description is given in Section 5.


5 Notes on individual galaxies
5.1 Sample A
5.1.1 NGC 821
NGC 821 is a field elliptical galaxy. It is classified as an E6 in the RC3 and NED catalogues, but we measured a mean ellipticity of 0.4. The PNe system of NGC 821 was studied for the first time by Romanowsky et al. (2003, 104 PNe). The declining radial profile of the velocity dispersion observed from the combination of stellar and PNe data was interpreted as a signature of low dark matter concentration in this galaxy halo, lower than the prediction by cosmological simulations. Recently, Forestell & Gebhardt (2008) extended the stellar kinematic measurements to , claiming a discrepancy between stellar and PNe kinematics (the velocity dispersions measured with PNe are lower than the ones measured with absorption lines). Using three-integral models they derived a dark matter content that is slightly higher than determined by Romanowsky et al. (2003), but still lower than predicted by cosmological simulations.
In this paper we have obtained a new PN.S catalogue with 125 detections. To compare their spatial distribution with the stellar surface density profile, we used ground-based photometric data in the -band measured by Goudfrooij et al. (1994), combined with the HST measurements (F555W, shifted artificially by magnitudes to match the ground-based data) given by Lauer et al. (2005). The extrapolation of the Sérsic fit to the surface brightness profile out to agrees well within the error bars with the number density radial profile of the PNe (Figure 2).
The smoothed PNe two-dimensional velocity field produced in Section 4.2 using the folded PNe sample shows a rotation of , with a misalignment of degrees between the photometric major axis (, from RC3) and the PNe kinematic major axis (, direction of the approaching side). The misalignment between and is confirmed also if we use the un-folded PNe sample. This test excludes the possibility that the observed rotation is produced by a few background sources erroneously identified as PNe, which skew the velocity distribution.
The comparison between PNe and stellar absorption-line kinematics is shown in Figure 7. Long-slit data are from Forestell & Gebhardt (2008), which agree with the integral-field stellar kinematics from Emsellem et al. (2004). The PNe velocities at may be systematically slightly lower than the absorption-line points but the two data sets still appear consistent within the error bars of the PNe points and the scatter of the absorption-line data.
Along the photometric major axis, the stellar component suggests a plateau in the rotation curve with for , while the PNe system shows a lower value of for . Along the photometric minor axis the scatter in the stellar kinematics is quite large and it is difficult to make a clear comparison. Nevertheless, we see an increase of the stellar rotation in the region in good agreement with the PNe data. The galaxy thus exhibits both major axis and minor axis rotation and so is most likely triaxial. In particular, the outer regions of NGC 821 () have the positive side of rotation aligned with (see Figure 3 and Table 5), while the inner regions have have the positive side of rotation aligned with (Cappellari et al. 2007, but see also Figure 4 in Emsellem et al. 2004), indicating a misalignment of 118 degrees between inner and outer regions.
The fact that PNe and absorption-line kinematics show different misalignments with , 56 and 6 degrees respectively (Table 5), could be because these two quantities are computed in different radial intervals: the PNe misalignment is computed for , while the absorption-line misalignment is computed for (from SAURON kinematics). There is a (small) region of overlap between the PNe kinematics and the long-slit data in Figure 7, in which there is no evidence that the PNe and absorption line data disagree. Both sets of data may trace different regions of the same velocity field, if the kinematics major axis changes rapidly from the centre outwards.
The combined velocity dispersion profile along both axes shows a strong decrease, reaching at .
5.1.2 NGC 3377
NGC 3377 is an E5 galaxy in the Leo I group. This galaxy has been studied on numerous occasions. Mass models have been obtained over different radial ranges, from the very inner regions to measure the supermassive black hole mass (e.g., Gebhardt et al. 2003; Magorrian et al. 1998), out to to determine the mass-to-light ratio, orbital structure and dynamical properties (e.g., van der Marel & van Dokkum 2007; Cappellari et al. 2006). The large number of PNe obtained with the PN.S (154 detections) derived in the present paper allows us to extend the kinematic information out to .
We used ground-based photometric data in the -band measured by Goudfrooij et al. (1994) and Jedrzejewski (1987), combined with the HST measurements given by Lauer et al. (2005) (F555W, shifted artificially by magnitudes to match the ground-based data). In the small overlapping region () the PNe counts follow the stellar surface brightness within the error bars. In the region the PNe counts follow the Sérsic fit extrapolation of the stellar surface brightness. The last PNe data point at has too large error bars to derive conclusions.
The PNe system shows a twist of the kinematic major axis, from at up to at . The stellar surface brightness is not extended enough to check whether or not this twisting is reproduced also in the photometry.
Our deep stellar long-slit kinematics obtained with FORS/VLT (see Appendix C) show a good agreement within errors with the PNe velocity and velocity dispersion extracted along both major and minor axes. Along the major axis, this galaxy shows a very steep central rotation gradient within together with a central velocity dispersion most likely due to the contribution of the central black hole (Gebhardt et al. 2003). The stellar radial velocity reaches a maximum value within and then it goes down to at . On the contrary, the velocity dispersion increases from at to at and then it goes down again to 80 . This turnover in the velocity dispersion is observed both in the stars and the PNe. Therefore it appears that despite its classification as an E5, NGC 3377 shows disc-like kinematics in its inner (i.e., high value of the maximum rotation velocity, low values of the velocity dispersion).
5.1.3 NGC 3608
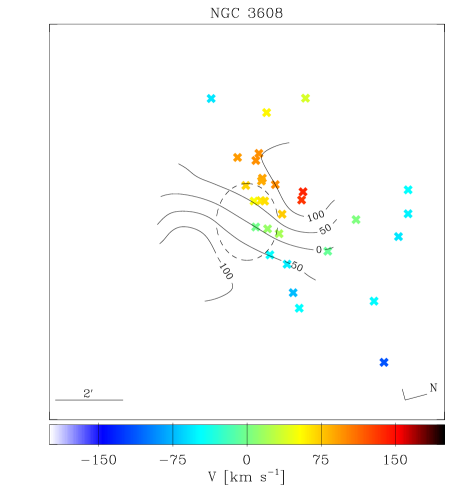
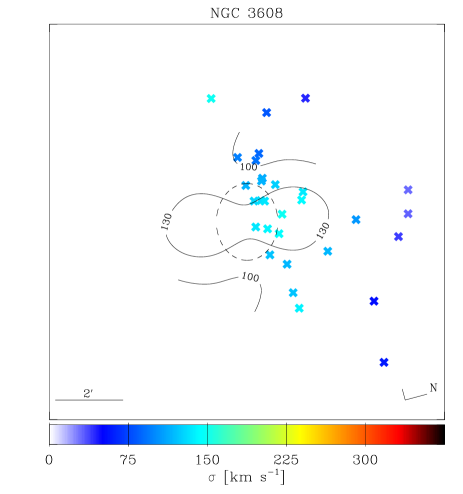
NGC 3608 is an E2 galaxy in the Leo II group. The mass models of NGC 3608 constructed so far are confined to the inner regions and are based on stellar long-slit (van der Marel 1991; Magorrian et al. 1998; Gebhardt et al. 2003) or two-dimensional integral-field (Cappellari et al. 2007) kinematics.
Radial velocities for 87 PNe were derived in the present paper. It has a close companion, NGC 3607, about 6 arcminutes to the South, whose systemic velocity ( , from RC3) makes the two PNe systems overlap in phase space. In our PNe analysis we did not consider the objects closer to NGC 3607 than NGC 3608. This probably still leaves some contaminants in the PNe catalogue: in fact, there is an over-density of detections on the side of NGC 3608 closer to its companion (see Figure 1).
We used ground-based photometry by Jedrzejewski (1987) in -band and HST photometry by Lauer et al. (2005) (F555W, artificially shifted by 0.92 magnitudes to match the ground-based data). Unfortunately no spatial range exists where the stellar surface brightness and PNe data overlap, so a direct comparison is not possible. If we extrapolate the Sérsic fit of the luminous profile, we find a good agreement with the PNe number denisity (much better than the exponential disc fit extrapolation).
The PNe velocity field is quite noisy in the outer region and the PNe major kinematic axis (∘ ) is misaligned with the photometric one (). Both effects are probably caused by the low number of detections and the possible contamination by the companion galaxy.
Stellar kinematics (∘ and ∘) are taken from Halliday et al. (2001). Again the stars and PNe do not overlap in radial range, so a direct comparison between the kinematics of two systems is not possible. Along the major axis, the stellar kinematics reveal a kinematically decoupled core (already reported by Halliday et al. 2001). Extrapolation of the stellar rotation at matches the PNe data well, which show an increase of the rotation to at . Rotation is also visible along the minor axis, but the scatter and error bars are too large to derive general conclusions. The velocity dispersion along the major axis decreases from the central 200 to at and then shows an increase to 170 at .
As pointed out before, the PNe sample of NGC 3608 might be contaminated by the presence of PNe belonging to NGC 3607. In order to quantify the contamination effect, we exclude all PNe on the NGC 3607 side (i.e. southern side). The remaining catalogue contains therefore only 30 PNe on the northern side of NGC 3608, to which we apply the point-symmetric reflection as in Section 4.1. We will refer to this folded, northern-side catalogue as the “N-sample”. This is a conservative approach as it will eliminate most of the contaminants, but it will also eliminate many PNe of NGC 3608 and the results may suffer from low number statistics.
In Figures 8 and 9 we present the two-dimensional velocity and velocity dispersion fields, and the comparison with stellar kinematics extracted along the major and minor axes using the “N-sample”. The two dimensional kinematics of the “N-sample” are different from those of the original PNe sample; the new velocity field is characterized by more regular rotation and the new velocity dispersion contours have a different orientation.
The new velocity field has a kinematic position angle of for and of for , with an average . Major and minor axis rotation curves are characterized by steeper gradients: they reach the maximum of the rotation at and at before dropping rapidly to after . The radial velocity dispersion profile along the major axis is systematically lower for the “N-sample”.
Thus the outer halo kinematics of NGC 3608 depend strongly on the adopted PNe sample. We therefore consider the results from the “N-sample” as a separate case, referring to them as NGC 3608N for the rest of the paper.

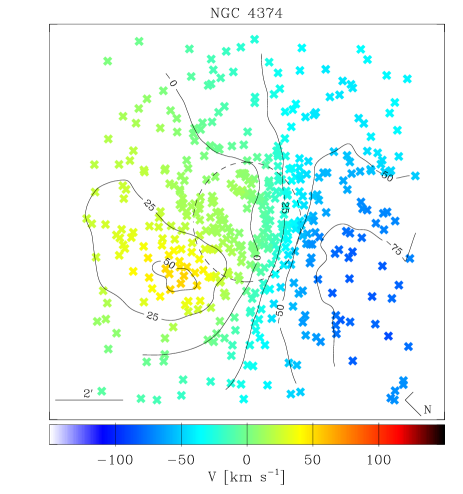
5.1.4 NGC 4374
NGC 4374 (M84) is a well-studied, bright E1 galaxy in the Virgo cluster. Mass models have been constructed by Kronawitter et al. (2000); Cappellari et al. (2007) using stellar kinematics within 1 . With our deep long-slit observations and 457 PNe radial velocity measurements obtained in this paper we are able to extend the kinematic information out to 6 .
We used the extended ground-based photometry given by Kormendy et al. (2008), which shows a very good agreement between stellar surface brightness and PNe number density. The data show large variations in the position angle of the photometric major axis. Beyond the photometric position angle increases from 120 to 180 degrees. The shift in position angle may be an effect of the interaction with the nearby galaxy NGC 4406.
The two-dimensional velocity field of NGC 4374 indicates that the kinematic rotation axis () is almost orthogonal to the photometric one (). Simulations carried out in Section 4.3 clearly indicate that the rotation along that axis is significant (see Figure 4). The misalignment between kinematic and photometric major axes is seen also in the stellar absorption-line kinematics, which agree well with the PNe data.
The mean velocity field obtained with the “unfolded” PNe catalogue (Figure 10) differs from the one calculated with the “folded” catalogue. In particular we noticed an asymmetry: the receding side reaches , while the approaching side reaches . This asymmetry in the velocity field is confirmed also in the stellar kinematics, as shown in Figure 11.
The “unfolded” and “folded” velocity dispersion fields do not differ significantly from each other. They both show almost constant velocity dispersion, with small fluctuations consistent with measurement errors.
The distortion of the velocity field in NGC 4374 is unlikely to be caused by contamination from PNe belonging to NGC 4406 because the two galaxies have very different systemic velocities. It could possibly be related to the presence of a diffuse intracluster light component in this part of the Virgo cluster (Arnaboldi et al. 1996), or to a current interaction of NGC 4374 with NGC 4406. The angular separation between NGC 4406 and NGC 4374 is kpc (at a distance of 17.6 Mpc). NGC 4406 is on the approaching (NE) side of NGC 4374 with a systemic velocity lower than NGC 4374 and it is closer by about Mpc (see Table 1).
We can exclude that the observed asymmetry is caused by background Ly galaxies at redshift because they are too few to generate such a major distortion of the velocity field. In fact, according to Ciardullo et al. (2002) we would expect Ly contaminants for our field of view (), redshift range (), and completeness magnitude (28 mag).
5.1.5 NGC 4564
NGC 4564 is an E4 galaxy in the Virgo cluster. The number of detections in our data (49 PNe, with 38 outside 2 ) is quite low, and a direct comparison of their radial distribution with the stellar surface brightness (Goudfrooij et al. 1994) suffers from small number statistics. The radial range where both data sets overlap is small, but there is a good agreement within error bars with the extrapolation of the Sérsic fit to the stellar data.
The two-dimensional velocity field shows a steep central velocity gradient parallel to the photometric major axis. The velocity dispersion field has a central peak of () and then it drops down.
Although the major axis stellar kinematics (Halliday et al. 2001) are not extended enough to have a large overlap with the PNe kinematics extracted along the major axis, the extrapolation of the stellar rotation curve agrees well with the PNe kinematics. The combined major axis rotation curve reaches a plateau ( at ) and then declines from 50” to at . The velocity dispersion decreases from the central 180 to at and then declines slowly to at . The NGC 4564 major axis rotation curve resembles that of an S0 galaxy rather than that of an elliptical galaxy.
5.1.6 NGC 5846
The E0 galaxy NGC 5846 is the brightest member and the central galaxy in the NGC 5846 group. Mass modelling of NGC 5846 has been performed by van der Marel (1991); Kronawitter et al. (2000); Cappellari et al. (2007), all using stellar kinematics within 1 effective radius. With the PNe measurements (124 detections) obtained with our PN.S instrument, we are able to extend the kinematic information of NGC 5846 out to 6 according to Table 1. A separate paper with detailed dynamical models combining stellar kinematics, PNe data and X-ray observations is in preparation (Das et al., in preparation).
Stellar photometric data in -band is taken from Kronawitter et al. (2000). PNe number density and stellar photometry agree well within the error bars.
The two-dimensional velocity field does not show significant rotation. The apparent rotation of 30 along degrees seems to be consistent with 0 within the measurement errors (see Figure 4).
Long-slit stellar data along the major (Kronawitter et al. 2000) and minor (Emsellem et al. 2004) axes are also consistent with no rotation, even if their radial coverage is not sufficient to ensure a proper comparison with PNe kinematics (Figure 7).
The velocity dispersion along the major axis shows a slightly declining profile, from the central 250 down to 170 at .
5.2 Sample B
5.2.1 NGC 1023
NGC 1023 is an S0 galaxy, the brightest member in the eponymous group. Noordermeer et al. (2008) studied the kinematic data of 204 PNe in the S0 galaxy NGC 1023, obtained with the PN.S. The combined velocity curve from stellar and PNe data shows a maximum value of 240 at followed by a remarkable decline to 50 at . The peak in the radial velocity of NGC 1023 occurs approximately at the same position as the minimum in the velocity dispersion. Outside the galaxy is dominated by a more pressure-supported component, and the velocity dispersion increases up to 140 .
This was interpreted as a signature of the complex evolutionary history of the galaxy: the inner regions with high rotation and low velocity dispersion indicate a quiescent disc formation process, while the outer parts with declining rotation and higher velocity dispersion indicate heating from a merger or strong interaction with the companion galaxy.
Figure 2 shows a good agreement between the stellar surface brightness and PNe number density within the relatively large errors. The PNe densities are different from the original values presented in Noordermeer et al. (2008) because the completeness correction was not performed there.
The two-dimensional PNe velocity and velocity dispersion fields are derived using the PNe catalogue of Noordermeer et al. (2008) and indicate rapid rotation in the central followed by a decline towards larger radii (Section A).
Approximate agreement is found between absorption-line and PNe kinematics (Figure 7) within the error bars. The small discrepancy in the rotation curve may be caused by the high inclination of the galaxy disk ( according to Noordermeer et al. 2008). Stellar kinematics are taken from Debattista et al. (2002) for the major axis and Simien & Prugniel (1997) for the minor axis.
5.2.2 NGC 1344 (NGC 1340)
NGC 1344 is an E5 elliptical galaxy in the Fornax cluster. We use the stellar long-slit kinematics and the radial velocities of the 195 PNe in NGC 1344 from Teodorescu et al. (2005), who estimated a dark matter halo of within (3.5 ) by combining the two datasets. The PNe number density profile agrees well with the stellar surface brightness (Sikkema et al. 2007); see Figure 2.
The PNe velocity field (see Appendix A) reaches and shows a misalignment of degrees with respect to the photometric major axis. The absorption-line kinematics taken from Teodorescu et al. (2005) extend to along the major axis. The rotation velocity reaches a maximum of at . The PNe velocities, which are measured outside this region show essentially no rotation (already reported in Teodorescu et al. 2005). The spatial overlap between the two systems is too small to ascertain the cause of this steep decrease in rotation. Along the minor axis both components show no rotation. The velocity dispersion profile declines from a central value of to at .
5.2.3 NGC 3379
NGC 3379 (M105) is an E1 galaxy in the Leo I group, close in projection (7’) to NGC 3384. The PNe system of NGC 3379 has been widely studied in the literature. Radial velocities are presented by Ciardullo et al. (1993, 29 PNe), Romanowsky et al. (2003, a preliminary sample of 109 PNe from the PN.S), Sluis & Williams (2006, 54 PNe) and by Douglas et al. (2007, the final sample of 191 PNe from the PN.S). Also the dynamical structure of NGC 3379 has been studied by several authors, using models derived from stellar kinematics (Kronawitter et al. 2000; Cappellari et al. 2007) or from the combination of stellar and PNe data (Romanowsky et al. 2003; Samurović & Danziger 2005; Douglas et al. 2007). The PNe kinematics at large radii show a steep decline in the velocity dispersion, which was previously interpreted as evidence for a lower content of dark matter than predicted by standard cosmological simulations.
In a recent paper, De Lorenzi et al. (2008a) presented a new approach to the analysis of NGC 3379 using an N-particle model (NMAGIC, De Lorenzi et al. 2007), combining stellar and PNe kinematics. They generalised previous works by relaxing the assumption of spherical symmetry and demonstrated that, due to the strong degeneracy between radial anisotropy, intrinsic shape of the galaxy and mass distribution, the data do allow moderately massive dark matter haloes.
The stellar surface brightness and PNe number density show good agreement (see Figure 2, confirming the analysis of Douglas et al. 2007).
In this paper we use the 191 PNe radial velocities published by Douglas et al. (2007). The smoothed two-dimensional fields are shown in Appendix A. Our smoothing technique is different from that used previously, but the general features of the kinematics derived from the two methods are consistent (in particular, the misalignment found between the photometric and kinematic major axes).
5.2.4 NGC 4494
NGC 4494 is an E1 galaxy in the NGC 4565 group. Together with NGC 821 and NGC 3379, it is the third galaxy studied in Romanowsky et al. (2003) in which the remarkable decline of the velocity dispersion radial profile was interpreted in terms of a low content of dark matter. A new detailed analysis is performed by Napolitano et al. (2008), using a catalogue with almost three times the number of detections obtained with the new PN.S pipeline version described in Douglas et al. (2007). Napolitano et al. (2008) also present deep long-slit data (see Figure 21) and new deep photometric data.
The two-dimensional fields presented in Appendix A are obtained using a different technique compared to that used in Napolitano et al. (2008). The main difference between the two velocity fields is the presence of a kinematic substructure rotating ∘ off the major axis. Nevertheless, the small amplitude of this rotation ( ) is consistent with zero, if we take into account the measurement errors and the errors determined by Monte Carlo simulations ( ), as described in Section 4.3.
Absorption-line and PNe kinematics show a good agreement, except at along the minor axis where the velocity dispersion measured from the PNe is higher than that measured from the stars (see also Napolitano et al. 2008).
5.2.5 NGC 4697
NGC 4697 is an E6 galaxy in the direction of Virgo. This galaxy has 535 PNe detections by Méndez et al. (2001, 2008). They constructed a spherical mass model using isotropic velocity dispersions and did not require a dark matter halo. In this data set, Sambhus et al. (2006) observed the presence of two distinct sub-populations of PNe with different luminosity functions, spatial distributions and radial velocities. The second population was particularly prominent in the brightest PNe. Therefore De Lorenzi et al. (2008b) used only a sub-sample of 351 PNe out of the Mendez catalogue for their new set of dynamical models, which also incorporates kinematic constraints from long-slit data. They found that a wide range of halo mass distributions was consistent with the kinematic data for the galaxy, including some with a dark matter content in agreement with cosmological merger simulations.
For this galaxy we could not correct the PNe data for the radial incompleteness because of the lack of original images (see Figure 2). This may explain why the PNe number density profile falls below the stellar surface brightness (Goudfrooij et al. 1994; De Lorenzi et al. 2008b) in the inner regions.
5.2.6 NGC 5128
NGC 5128 (Centaurus A) is a nearby merger remnant classified S0pec galaxy, in the NGC 5128 group. NGC 5128 is the early-type galaxy with the largest number of PNe detections. It was first studied by Hui et al. (1995), using radial velocities of 433 PNe out to 22 kpc, and then by Peng et al. (2004), using radial velocities of 780 PNe out to kpc. They found a total mass enclosed within 80 kpc of M⊙, depending on the particular model assumed for the dark matter halo.
The more recent analysis of Woodley et al. (2007) included the radial velocities of 320 globular clusters. They obtained a mass of M⊙ (using only PNe within 90 kpc) and M⊙ (using only globular clusters).
5.3 Sample C
5.3.1 NGC 1316
NGC 1316 (Fornax A) is a bright S0 galaxy in the Fornax cluster. Arnaboldi et al. (1998) measured the positions and radial velocities of 43 PNe in this galaxy, computing an enclosed mass of M⊙ within 16 kpc. Kinematic data (PNe and stellar long-slit) used in our work are taken from their paper. The relatively low number of PNe and their sparse distribution did not allow us to construct a reliable two-dimensional velocity field with our adaptive Gaussian kernel smoothing procedure. Also the comparison with the stellar surface brightness suffers from low number statistics. In addition, the stellar long-slit data (Arnaboldi et al. 1998) does not overlap sufficiently in radius with the PNe kinematics to make a comparison. The combined velocity dispersion radial profile is relatively flat for (see Section 6.4).
5.3.2 NGC 1399
NGC 1399 is an E1 galaxy in the centre of Fornax cluster. This galaxy has been modelled in detail by Saglia et al. (2000) using kinematic measurements from their stellar long-slit data, and globular cluster (Kissler-Patig et al. 1998) and PNe (Arnaboldi et al. 1994) radial velocities out to . They found a total mass of M⊙, consistent with the results obtained from X-ray determinations (Ikebe et al. 1996). A more detailed analysis of the PN sample was presented in Napolitano et al. (2002). They found that the PN dispersion profile, depending on the definition of outliers, is consistent with staying approximately flat at 200 but also with increasing to 400 outside as the globular cluster profile.
The small number of PNe (37 detections) is too low to derive reliable two-dimensional smoothed fields with our procedure. Moreover, there is no overlap between stellar and PNe data; therefore a comparison between the PNe distribution and stellar surface brightness or between PNe and stellar long-slit kinematics is not possible.
The combined velocity dispersion declines from at the centre to at ( ) (Saglia et al. 2000).
5.3.3 NGC 3384 (NGC 3371)
NGC 3384 is an S0 galaxy in the Leo I group, close in projection () to NGC 3379. The two galaxies have comparable systemic velocities, which makes the two PNe systems’ radial velocities overlap.
Mass models of this galaxy are mostly based on stellar kinematics and are confined to the innermost regions (e.g., Gebhardt et al. 2003; Cappellari et al. 2007). There are no large catalogues of PNe radial velocities for this galaxy: Tremblay et al. (1995, 63 PNe), Douglas et al. (2007, 23 PNe) and Sluis & Williams (2006, 50 PNe). For the analysis in this paper we use the catalogue of Tremblay et al. (1995). A cross-check between the Douglas et al. and Sluis & Williams catalogues is done in Douglas et al. (2007). In Tremblay et al. (1995) PNe positions are not published, therefore a cross-check with that catalogue is not possible.
The relatively low number of PNe and their sparse distribution did not allow us to construct a reliable two-dimensional velocity field or a reliable number density profile. The major axis stellar long-slit data (Fisher 1997) did not significantly overlap in radius with the PNe kinematics. This did not allow a comparison between the two data sets, but the combined velocity dispersion profiles is shown in Figure 15.
5.3.4 NGC 4406
NGC 4406 (M86) is an E3 galaxy in the Virgo cluster, near in projection to NGC 4374. Surface-brightness fluctuations (Table 1) place this galaxy at a distance of Mpc closer than NGC 4374. The X-ray emitting hot gas envelopes of both galaxies appear to be interacting (E. Churazov, private communication). NGC 4406 has a radial velocity of about and is falling towards M87 from behind. The catalogue of PNe radial velocities (Arnaboldi et al. 1996) consists only of 16 detections, but this has been sufficient to constrain the velocity dispersion profile out to 11 kpc ().
The relatively low number of PNe and their sparse distribution did not allow us to construct a reliable two-dimensional velocity field. Also the comparison with the stellar surface brightness suffers from low number statistics.
The stellar long-slit data (Bender et al. 1994) do not overlap sufficiently with the PNe kinematics for a comparison. The combined velocity dispersion ranges between 200 and 250 in the central , and then declines to 96 at .
6 Sample properties: Results and discussion
In this section we analyse the general properties of the whole galaxy sample (Table 1), combining the information from stars and PNe. In particular, we look for correlations between kinematic properties (such as the ratio and the velocity dispersion radial profile), photometric properties (such as the total luminosity, UV emission or the shape of the isophotes) and the ratio of PNe number to luminosity ( parameter). All quantities determined for this purpose in the following sections will be presented in Table 6.
6.1 The parameter
One important aspect of the comparison between PNe and the stellar surface brightness is the evaluation of the parameter (Jacoby 1980), which specifies the number of PNe associated with the amount of light emitted by the stellar population.
For the galaxies in the PN.S database we compute more specifically , the ratio between the number of PNe down to one magnitude fainter than the PNLF bright cut-off, , and the total stellar luminosity in the -band, , expressed in solar units, as follows:
-
•
We determine the number of PNe brighter than accounting for completeness correction factors at different radii from the galaxy centre. and were defined in Section 3.2.
-
•
We integrate the fitted Sérsic stellar surface brightness profile in the -band over the radial range in which the PNe have been detected, giving us . For NGC 4374 and NGC 5846 where the -band profiles are available instead, we convert the result into the -band using the total extinction-corrected colour as reported in the RC3 catalogue: for NGC 4374 and for NGC 5846.
-
•
We compute as the ratio . Uncertainties in the radial extent of the PNe detection range, in the Sérsic fit extrapolation and in the completeness corrections give us an error estimate for .
-
•
Finally, we scale the measured to by integrating over the PNLF. We have
(9) where is the analytic expression of the PNLF (Ciardullo et al. 1989b), which depends only on the cut-off magnitude observed in our galaxies.
For galaxies not included in our PN.S database we use the as listed by Buzzoni et al. (2006).
It is known that is related to the UV emission in galaxies (Buzzoni et al. 2006). We therefore compare the values to the UV excess of the sample galaxies. The latter is measured using the total FUV (1344-1786Å) magnitude from the GALEX database (where available) and the extinction-corrected total magnitude from the RC3 catalogue. GALEX FUV magnitudes are corrected for extinction using the relation as in Wyder et al. (2005). Values for the colour excess are taken from the NED database. The parameters and the colours are listed in Table 6. In Figure 12 we plot against the GALEX colours. The figure shows a clear anti-correlation: galaxies with a larger UV excess, which are the massive ellipticals, also have a smaller number of PNe per unit luminosity, .
Using stellar population models, Buzzoni et al. (2006) interpreted this trend as a consequence of the mean post-AGB (PAGB) core mass being smaller in massive ellipticals, which is a result of a higher rate of mass loss. If the mean PAGB core mass falls below one may expect a larger fraction of Horizontal-Branch (HB) stars to follow the AGB-manqué channel, i.e., the stars move directly onto the high-temperature white dwarf cooling sequence after leaving the HB, thus missing the AGB and PN phases entirely (Greggio & Renzini 1990). A larger fraction of AGB-manqué stars is consistent both with a lower value of and a strongly enhanced galaxy UV emission, as is observed for the more massive elliptical galaxies in the current PNe sample.

6.2 The average ratio for stellar and PNe systems
The average value of the ratio in a galaxy has traditionally been used to describe the relative importance of rotation and anisotropy for dynamical equilibrium and the shape. Usually, it has been calculated from long-slit kinematics using the formula
| (10) |
where is the maximum value of the observed radial velocity and is the average value of the velocity dispersion within 0.5 (e.g., Bender et al. 1994).
Binney (2005) revisited the calculation of the average , adapting it for two-dimensional data. The new formulation is in terms of the sky-averaged values of and , weighted by the surface density. For SAURON integral-field data, this was approximated by Cappellari et al. (2007):
| (11) |
where the sum extends over the data points in the two-dimensional field, on isophotes up to 1 , depending on the radial extent of the data. and are the velocity and velocity dispersion of the data point and is the flux associated with it.
“Classical” measurements (Equation 10) can be rescaled to the new “two-dimensional” values by multiplying by 0.57 (Cappellari et al. 2007).
-
•
Stellar
Stellar are taken from the SAURON survey (from Cappellari et al. 2007), where available. For the remaining sample galaxies in Table 1, we compute from long-slit data using Equation 10, and rescale to the two-dimensional values by multiplying with 0.57. Errors are taken to be 0.03 for SAURON values, or are computed using error propagation (on Equation 10) and are also rescaled by 0.57.
-
•
PNe
We compute for the PNe system using the smoothed two-dimensional fields (calculated in Section 4.2), summing over the positions of the detected PNe:
Table 6: Measured parameters for the sample galaxies Name , (FUV-V) (NGC) () () () () () () (mag, mag) () (mag) ( M⊙) (1) (2) (3) (4) (5) (6) (7) (8) (9) (10) (11) (12) (13) (14) (15) (16) 821 167 76 0.31 181 66 0.31 27.4, 28.6 9.1 0.2 1023 110 79 0.54 209 147 0.59 25.8, 27.3 7.6 0.1 – – 1316 152 152 1.00 184 179 0.97 -, - 7.2 0.2 1344 148 109 0.73 173 142 0.77 -, - 7.6 0.1 – – 1399 240 198 0.83 243 213 0.88 -, - 5.9 0.1 3377 67 77 0.75 110 64 0.58 25.2, 27.0 – – – 3379 153 69 0.30 162 77 0.29 25.5, 26.5 – 3384 63 72 0.93 162 157 0.80 -, - – 3608 130 169 0.99 141 191 0.98 27.1, 28.0 7.6 0.1 – – 3608N 102 107 0.55 134 134 1.00 27.2, 28.0 7.6 0.1 – – 4374 215 207 0.96 216 208 0.96 26.9, 28.0 7.5 0.1 – – 4406 147 96 0.65 219 219 1.00 -, - 7.2 0.1 4494 106 63 0.44 122 66 0.36 26.0, 27.0 – – – 4564 70 58 0.79 163 93 0.36 26.3, 27.8 6.9 0.1 – – 4697 154 92 0.60 180 106 0.59 -, - 7.9 0.1 5128 132 89 0.52 147 133 0.80 -, - – – – 5846 210 170 0.81 219 174 0.79 27.3, 28.3 6.7 0.1 Notes – Col.1: Galaxy name. NGC 3608N refer to the results obtained using half of the PNe sample, as explained in Section 5.1.3.
Col.2: Outermost value of the velocity dispersion as given by the fit.
Col.3: Velocity dispersion at 1, as given by the fit.
Col.4: Velocity dispersion at 5, as given by the fit.
Col.5: Minimum value of the velocity dispersion as given by the fit, scaled by (from Col.3).
Col.6: Outermost value of as given by the fit.
Col.7: at 1, as given by the fit.
Col.8: at 5, as given by the fit.
Col.9: Minimum value of as given by the fit, scaled by (from Col.7).
Col.10: Average value of for the PNe component. For the data from two-dimensional field, Equation 11 was used. For the data from major axis kinematics Equation 10 was used and values have been multiplied by 0.57 to rescale them to the two-dimensional case, as done by Cappellari et al. (2007).
Col.11: Average value of for the stellar component, calculated with Equation 10 on long-slit data and corrected by the factor 0.57, or using the value reported by Cappellari et al. (2007) if available.
Col.12: Bright cut-off magnitude and computed for the galaxies in Figure 2.
Col.13: The parameter computed using the PN.S data. Values marked by (a) are from Buzzoni et al. (2006), (b) from Ciardullo et al. (1989a) and c from Jacoby et al. (1990). Total band photometry for NGC 4374 and NGC 5846 has been converted into band using for NGC 4374 and for NGC 5846 (values taken from RC3).
Col.14: Difference between the extinction-corrected magnitudes in the far UV (from GALEX) and -band (from RC3). The symbol means that the galaxy is not present in the GALEX database.
Col.15: Mass-to-light ratio from single stellar population models listed in Napolitano et al. (2005). The symbol – means that the measurement is not available.
Col.16: Total stellar mass computed from the mass-to-light ratio (Col.15), and distance from Table 1.
(12) This implicitly incorporates the weighting by the local stellar surface density, which was shown earlier to be proportional to the PNe number density if the completeness correction factor (interpolated for ) is taken into account: Equation 12 weights every region according to the completeness-corrected number of PNe in the region (see Section 3.2). Note that Equation 12 is an average over the whole PNe field, and therefore probes a much larger region of the galaxy than the value for the stars, which was confined to within 1 .
For a few galaxies the number of PNe detections is too small for a reliable determination of the two-dimensional velocity fields. For these galaxies we use the PNe mean velocities and velocity dispersions in bins along the major axis as given in the respective paper from which the data were taken. We then take the maximum of these mean velocities and the average of all the velocity dispersion values to obtain a major-axis value analogous to the classical formula given in Equation 10, but not confined to within 0.5 . These values are then rescaled to the two-dimensional case by multiplying by 0.57.
In Figure 13 we compare these stellar and PNe , providing information on how the dynamics of a galaxy change from the inner to the outer region. From this figure we can see that many galaxies (nearly 50%) have , while for the rest, the two values are similar. Figure 13 also shows the differences between the distributions of flattened (E4) ellipticals (red), round (E3) ellipticals (black) and S0s (green). This shows that:
(i) Three of the galaxies (NGC 1023, NGC 3384 and NGC 4564) have large inner and even larger in the halo. The first two are S0 galaxies while the third exhibits S0-like properties (see Section 5.1.5). In these systems the rises from the centre to the disk-dominated region, like in the disky elliptical galaxies studied by Rix et al. (1999).
(ii) For flattened (NGC 821, NGC 1344, NGC 3377 and NGC 4697) and rotating, round galaxies (NGC 3379 and NGC 4494) in the sample, the inner and outer values for are equal to within the errors.
(iii) Galaxies with a small in the inner parts may have either small (NGC 4374 and NGC 5846) or larger (best exemplified by NGC 5128 and with larger uncertainities, NGC 1399 and NGC 3608) in the outer parts.
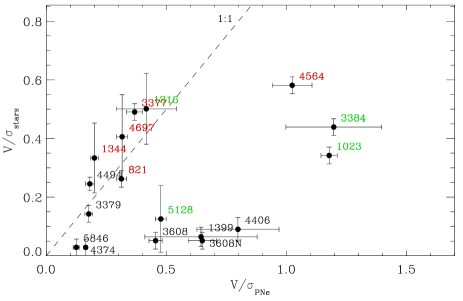
6.3 The radial profile for stellar and PNe systems
In Emsellem et al. (2007), a kinematic classification scheme for galaxies is proposed based on the profile, which measures the importance of rotation as a function of radius and is related to the angular momentum per unit of mass within :
| (13) |
where the sum includes data points within . Based on the profile within , galaxies can be divided into two main groups (Emsellem et al. 2007):
(i) Galaxies with are defined as fast rotators. These have a small misalignment between the photometric and kinematic major axes, and have rising profiles.
(ii) Galaxies with are defined as slow rotators. They exhibit a range of misalignments between the photometric and kinematic major axes and have flat or decreasing profiles.
To extend their analysis to the outer haloes of elliptical galaxies (beyond several ), we calculate the profiles using the PNe kinematics for the sample galaxies. For galaxies in which the two dimensional field is available, we use Equation 13, to sum over the velocity and velocity dispersion field values at the positions of the PNe, using the factor as the weight instead of the flux values . This incorporates the weighting by the stellar surface density as discussed in the case of Equation 12. For galaxies in which the kinematics are available only along the major axis, we use Equation 13 where the sum is meant to be extended only along the major axis, are extracted from the extrapolation of the stellar surface brightness and the 0.57 correction is applied. In Figure 14 we show the profiles derived using the stellar kinematics (which we used to separate between fast and slow rotators, to be consistent with previous works) and the PNe kinematics. To simplify matters, Figure 14 is divided into two panels separating galaxies for which the stellar is available from the SAURON data, from the remaining galaxies in our sample. Several results emerge from this figure, reflecting the changes in both the rotation and velocity dispersion profiles:
(i) In some galaxies, there is a marked change in the behaviour of at radii larger than 1 or 2 effective radii compared to that in the central regions. In the case of NGC 1023, NGC 1316, NGC 3377 and NGC 4494, after the initial increase of (as observed in the majority of fast rotators within ) the profiles drop, and they reach the “slow rotator” region (NGC 1316 and NGC 4494) or arrive close to it (NGC 1023, NGC 3377). According to Krajnović et al. (2008), the majority of fast rotators have structures with disk-like kinematics, which are responsible for the high values of . In these four fast rotators, the observed outer decrease in may imply that the light associated with the disk structure fades towards larger radii.
(ii) In the galaxies of the sample, which are slow rotators according to the SAURON classification, the profiles grow slowly to values of 0.1–0.3, thus entering the “fast rotator” regime (NGC 3608, NGC 5846 and partially for NGC 4374). A larger increase is visible in NGC 4406, but the small number of PNe for this galaxy makes its uncertain. The outward rise of for NGC 1399 is slower; this galaxy remains below the “slow rotator” demarcation line.
(iii) The remaining galaxies in the sample are “fast rotators” throughout the radial range probed. The profile either rises or stays almost flat throughout.
The large radial extent of the PNe data enables us to follow the rotation properties of elliptical galaxies out into the halo, providing new constraints on the processes involved in the formation of these galaxies (see Section 6.6).
Although the kinematics of the stars within as measured by SAURON (and most traditional long-slit studies) reflect half of the total stellar luminosity and mass, the same is not true for the total stellar angular momentum. As discussed in Appendix D, these stars may represent only % of the galaxy’s angular momentum, and an adequate global rotational picture of the galaxy requires observations to .
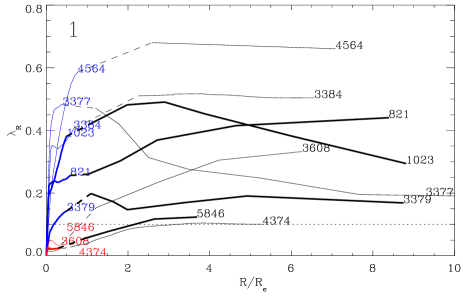
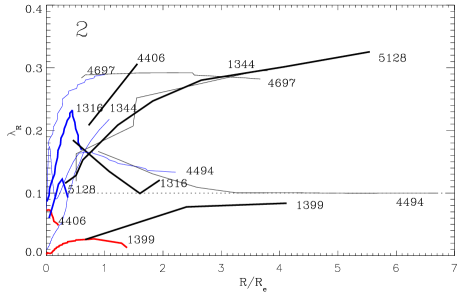
6.4 The shape of the velocity dispersion and radial profiles
In order to obtain a general overview of the shapes of the velocity dispersion profiles for our sample galaxies, we first parameterised the major axis profiles with suitable functions. There is no universally valid function for all the observed profiles, so we experimented with various ad hoc functions and selected the one that best matched the observations for each galaxy. The fitted velocity dispersion profiles were then scaled by the effective radius (values from Table 1) and normalised to the value of the velocity dispersion at . We did not use the central velocity dispersion value for the normalisation (i.e., ) because it might be artificially boosted by the presence of a central supermassive black hole or an unresolved central velocity gradient. We performed a similar paramerisation for the rotation profiles to compute the velocity profiles, where .
According to the normalized profiles shown in Figure 15, galaxies fall into two main groups. The larger part of the sample shows a slightly decreasing profile from the centre outwards. The second group of galaxies (NGC 821, NGC 3377, NGC 3379, NGC 4564, NGC 4494, NGC 4697) show strongly decreasing profiles. NGC 1023 appears to be anomalous in that its increases initially before falling steeply. This reflects the strong rotation in the disc of the galaxy combined with a steep central drop in the velocity dispersion profile (Figure 7, see also Noordermeer et al. 2008). For NGC 3608, the apparent increase in the profile is doubtful because of the possible contamination of PNe from NGC 3607 and the large errors associated with the velocity and velocity dispersion measurements (Figure 7); the radial profile of NGC 3608N (see Section 5.1.3) does not show anomalies, and belongs to the first group.
A greater variety of trends is visible in the velocity dispersion profiles, reflecting a larger variance in the individual contributions of ordered and random motions to the , e.g., due to the strong disc component in galaxies such as NGC 3377. There are galaxies in which the velocity dispersion remains high (i.e., the drop in velocity dispersion is less than 50% of the normalisation value); those, which exhibit a big drop (i.e., the last value of dispersion is less than 50% of the central value); and those that show an increase towards large radii, as in the case of NGC 1023, NGC 3377 and NGC 3608. In NGC 3608, the observed increase is again doubtful. In the case of NGC 4406, the massive drop is based on the results derived from a small number of PNe velocities, which show an associated increase in rotation velocity.
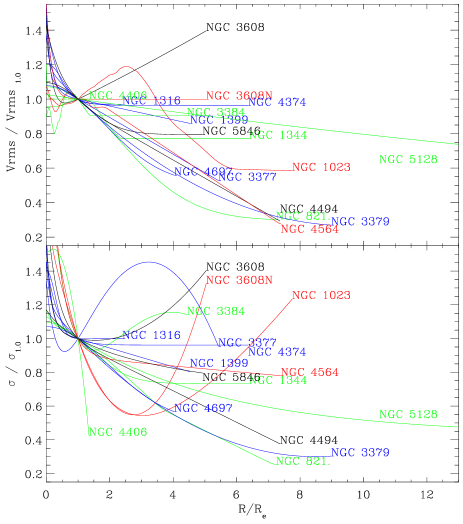
6.5 Correlations between kinematic, photometric and morphological properties of the sample galaxies
In this section we study the relations between some physical properties of early-type galaxies and their kinematic properties at large radii.
In the the left panels of Figure 16 we show how the outermost values of (, measured from the ad-hoc fitted profiles of Figure 15) are related to the galaxy’s X-ray luminosity, total -band luminosity, mean isophotal shape parameter , mean measured from the PNe data, and parameter. In the right panels of Figures 16 we show similar plots, using the minimum value of normalized by the value at , in place of .
Similarly, Figure 17 shows corresponding plots with the last values of the velocity dispersion (, measured from the ad-hoc fitted profiles of Figure 15) and , the minimum value of velocity dispersion normalized by the velocity dispersion at .
The outermost values of and velocity dispersion characterize their typical values in the galaxy halo and therefore also the galaxy mass, while the ratios between their minima and their values at give a measure of how much these profiles fall towards the outer radii.
We note that using the values of and velocity dispersion at a fixed radius of in these figures, instead of their outermost values, gives very similar results. Also, plotting the physical parameters against the logarithmic gradient of or velocity dispersion between and results in similar trends as shown in the right parts of Figures 16 and 17. For reference, the and interpolated from the parametric fits are given in Table 6.
From Figures 16 and 17 we notice that more luminous galaxies tend to have larger values of and . This is not surprising given that luminosity, and velocity dispersion are known to be related to the galaxy mass. What is new here is that we are exploring a larger radial range, probing the relation for the galaxy halo. We notice also that galaxies with higher and tend to have only boxy profiles (), while galaxies with low values of and have a wider range of shapes (). This is also a reflection of the known trend for massive ellipticals to be more boxy in shape (e.g., Bender et al. 1989). Napolitano et al. (2005) have also found the and other galaxy parameters (luminosity, stellar mass and central surface brightness profile) to correlate with the mass-to-light ratio gradients, showing that there might be a link between the galaxy structural parameters and the total mass of the galaxies.
In addition, galaxies which have the highest peaks in the parameter (NGC 1023, NGC 3384 and NGC 4564, see Figure 14) have fainter magnitudes and higher values of mean . Moreover, galaxies with higher and have smaller values (i.e., less PNe per unit luminosity). As discussed in Section 6.1, this is probably a consequence of massive early-type systems harbouring a larger proportion of stars on the Horizontal Branch that do not enter the PN stage. The correlation between and was already explored by Buzzoni et al. (2006), using the central velocity dispersion measurements.
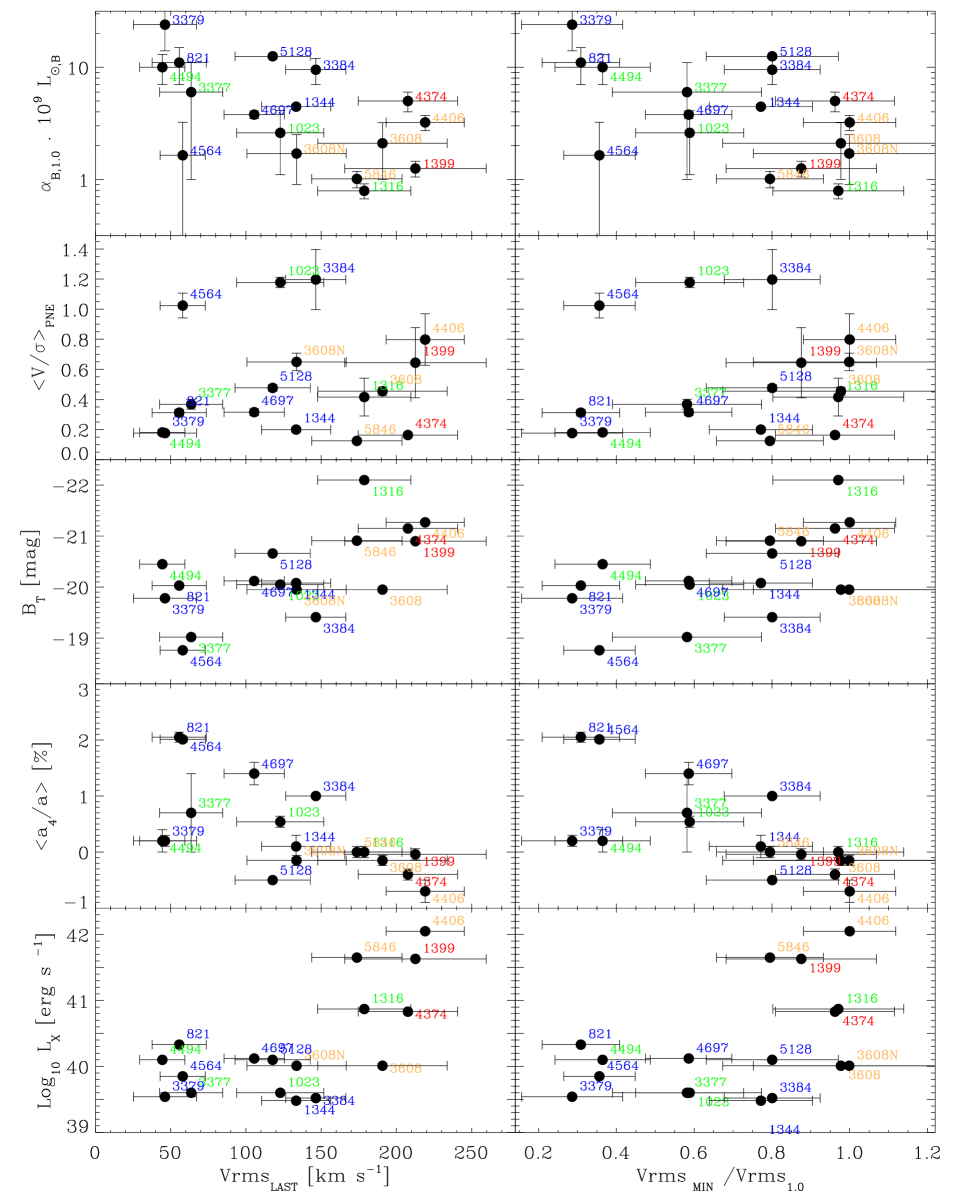
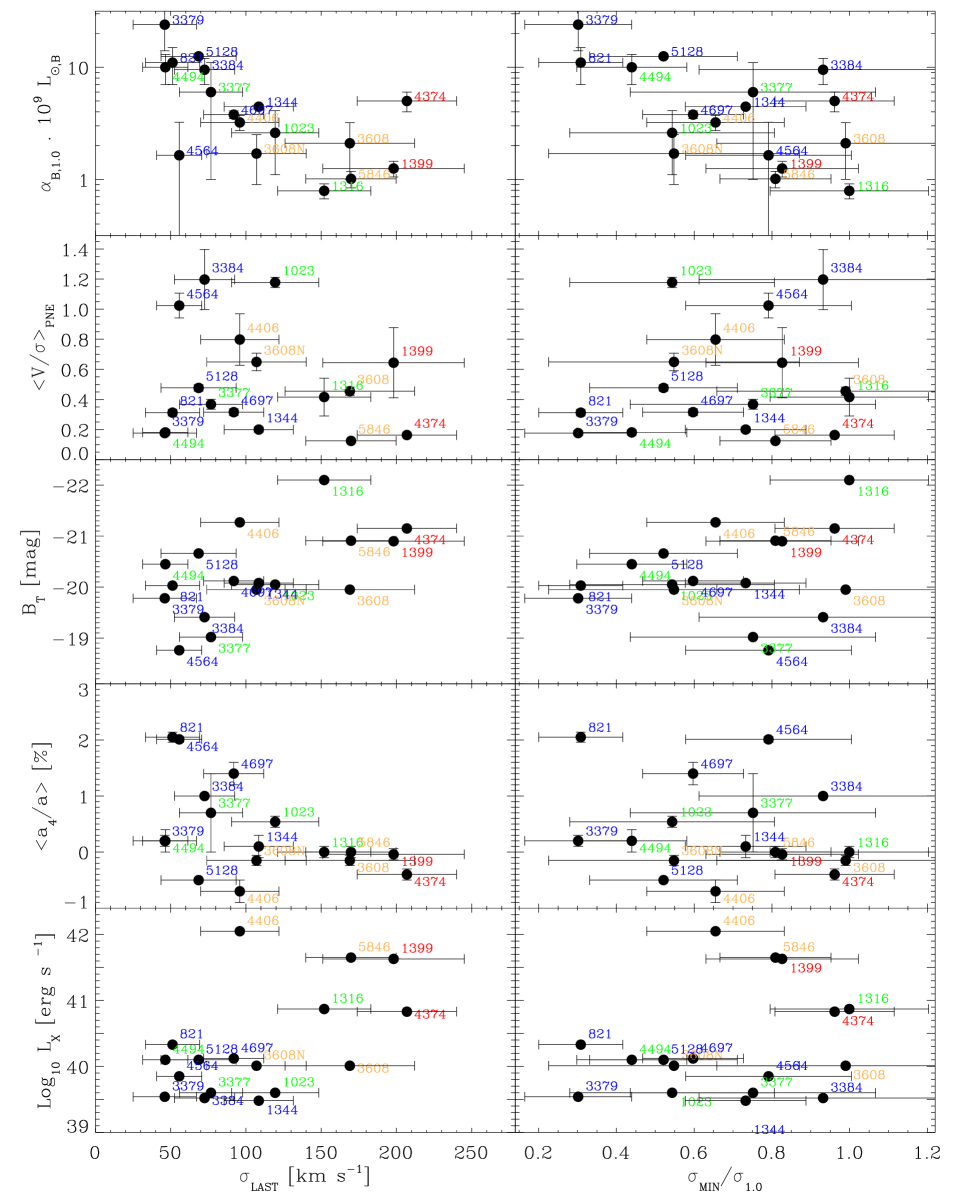
We see in the right panels of Figures 16 and 17 that these relations still hold if we replace with the normalized minimum of (i. e. ) and if we replace with the normalized minimum velocity dispersion (i. e. ), even if the scatter is larger 555Normalization at or gives similar results.. This is a consequence of more massive galaxies having preferentially larger values of , and flatter profiles of and velocity dispersion.
In Figure 18 we plot the total stellar mass computed for a subsample of galaxies as a function of , , , and the parameter. The stellar mass is computed using the total luminosity from Table 1 and the mass-to-light ratio in the -band listed in Napolitano et al. (2005) (where available). As expected from Figures 16 and 17, correlates with the parameter, , and with , although with larger scatter.
The general message we learn from Figures 16-18 is that galaxies with higher , and higher and flatter profiles (i.e., higher and higher ) tend to be the more luminous, more massive galaxies, are more pressure supported at large radii (i.e., ), with boxy isophotes (i.e., ) and tend to form less PNe. These results extend the picture described by Bender et al. (1989) based on stellar kinematics within 1 and of Buzzoni et al. (2006), to larger radii.
In Figures 16 and 17 we also differentiate between fast rotators, fast rotators with a declining profile in the halo, slow rotators and slow rotators with in the halo. On average, fast rotators fall on the left side of the plots, (i.e. they have lower values of , and more declining profiles) while slow rotators fall on the right side of the plots (i.e. they have higher values of , and flatter profiles). This is a reflection in the halo kinematics that fast (slow) rotators are on average less (more) massive and have more discy (boxy) isophotes (Emsellem et al. 2007).
6.6 Comparison with galaxy formation models
The results presented in Sections 4 and 6 on the outer halo kinematics of our sample galaxies provide new constraints for models of elliptical galaxy formation. Most of the merger simulation papers to date compare their remnants to data within an effective radius or so, but there are a few predictions for the kinematics at larger radii.
Line-of-sight velocity fields for binary disc merger remnants are published in Jesseit et al. (2007). The progenitor galaxies in these simulations include pure stellar discs as well as discs containing 10% of their mass in gas. Some 3:1 mergers with gas lead to remnants showing velocity fields with rapid rotation (e.g., their remnant 31GS19), with a peak velocity at 2-3, similar to the case of NGC 1023. Strong misalignments such as observed in NGC 821 are more characteristic of the 1:1 merger remnants (both dry and gas-rich, e.g., 11C10/11S8), which also include slowly rotating remnants with radially increasing rotational support (e.g., 11C6). Their models also include one which shows a ring-like depression of the velocity dispersion at associated with a corresponding increase in (11S2), somewhat similar to the case of NGC 3379 (see De Lorenzi et al. 2008b). Its velocity dispersion profile decreases by a factor of from the centre out to . This model originated from a merger of two disc galaxies with spin axis perpendicular to the orbital plane. Overall, the projected kinematics of the merger remnants analysed by Jesseit et al. (2007) show a variety of features seen also in our data. A more careful comparison including several diagnostics ( values, -profiles, velocity fields, dispersion profiles) would clearly be profitable.
Mean rotation and velocity dispersion profiles are shown by Naab et al. (2006) for a 3:1 merger remnant from the same set of simulations, out to . The kinematics of this object are characterised by rapid rotation and a falling dispersion profile (by a factor ), leading to a major axis profile increasing to at 2-4 . Only the S0 galaxies and NGC 4564 in Figure 13 reach these values. By contrast, the galaxies formed in a cosmological setting (described in Naab et al. 2007) rotate more slowly and are characterised by with similar values in the halo and the central parts (disregarding the counter-rotating core seen in one of the remnants). This is more typical for the slowly rotating galaxies in Figures 13 and 14.
The kinematics of the luminous haloes of isolated galaxies are investigated by Abadi et al. (2006). The outer haloes of these systems are predominantly made of stars accreted during previous merger events. These haloes have near-spherical triaxial density distributions, strongly increasing radial anisotropy, and correspondingly falling line-of-sight velocity dispersion profiles (by more than a factor of out to 0.1 times their virial radius). Our data probe only partially into these haloes, but it is possible that some of the strongly falling dispersion profiles in Figure 15 are related to such accreted haloes. On the other hand, the galaxies in our sample with slowly falling dispersion profiles or those with twisting (NGC 3377) or misaligned rotation (NGC 821) may not be easily reconciled with these models.
Oñorbe et al. (2007) studied the properties of elliptical-like galaxies generated in self-consistent hydro-dynamical simulations. These galaxies resemble the characteristics of slow rotators, i.e., are massive spheroidal systems without extended disk components and very low (cold) gas content. Their velocity dispersion profiles (normalized at ) are generally flat or slightly declining, with values of larger than 0.7 out to . These values are consistent with what we observe for the haloes of slow rotators (see Figure 17). Galaxies in our sample with more steeply declining velocity dispersion profiles are generally fast rotators, which are not included in the Oñorbe et al. (2007) simulations.
In summary, we expect that more detailed comparisons between data as presented in this paper and the halo kinematics predicted by galaxy formation models will shed new light on the merger formation histories of elliptical galaxies.

7 Summary
We explored the outer-halo kinematics and properties of early-type galaxies using the PNe data available for a sample of 16 objects. Out of the sample, 6 new catalogues with positions, radial velocities and magnitudes of PNe are presented for the first time (sample A, namely, NGC 821, NGC 3377, NGC 3608, NGC 4374, NGC 4564 and NGC 5846).
We compared the radial distribution of PNe with the stellar surface brightness profiles, for all galaxies in sample A, and for galaxies in sample B, which have extended photometry available from the literature (NGC 1023, NGC 1344, NGC 3379, NGC 4494 and NGC 4697). We found that:
-
1.
The PNe number density profile follows the stellar surface brightness profile in all the galaxies in which we have a spatial overlap between the stellar light and the PNe counts.
-
2.
In the galaxies in which we do not have a spatial overlap, the PNe counts follow the extrapolation of the stellar surface brightness profile.
-
3.
For the galaxies with a far UV magnitude measured with GALEX, we confirmed results from previous studies that the total number of PNe per unit luminosity ( parameter) is related to the UV colour excess (i.e., galaxies with higher UV emission tend to have fewer PNe).
We then determined smoothed two-dimensional velocity and velocity dispersion fields using an adaptive Gaussian kernel, for the galaxies in sample A and in sample B (namely NGC 1023, NGC 1344, NGC 3379, NGC 4494, NGC 4697 and NGC 5128). We compared the PNe kinematics with absorption-line kinematics available in the literature. For NGC 3377, NGC 4374 and NGC 4494 new long-slit data were presented. The kinematic analysis showed that:
-
1.
Rotation of the PNe system is observed in the majority of the studied galaxies.
-
2.
There is a good agreement between the absorption-line and PNe kinematics along the major and minor axes.
We combined the PNe and absorption-line kinematics along the photometric major axis for all 16 galaxies in our sample, extracting the information from the two-dimensional fields where available. This allowed us to probe their kinematics much further out than with the use of stellar kinematics alone (usually limited to the innermost ). This gave the following results:
-
1.
In several fast-rotator galaxies, kinematic twists and misalignments are observed at large radii, which are not seen in the SAURON data within (NGC 821, NGC 3377, and marginally, NGC 3379).
-
2.
The average of the stellar component (which probes the kinematics in the inner ) is equal to or lower than the average value computed for the PNe (which probes the kinematics for ). This indicates that for a fraction of galaxies, the kinematics become increasingly supported by rotation in the outer parts.
-
3.
The radial profiles of the parameter (related to the angular momentum per unit mass) show a more complex radial dependence when their values in the halo region are taken into account. While the majority of fast rotators remain so in their haloes, the profiles of slow rotators grow slowly to values of , therefore requiring a slight modification to the classification scheme proposed by Emsellem et al. (2007) (NGC 3608, NGC 4374 and NGC 5846). Some fast rotators however (NGC 1316, NGC 1023, NGC 3377 and NGC 4494), have profiles that strongly decrease outwards, probably due to the presence of disc-like structures that dominate the kinematics within 1–3 and then fade.
-
4.
The normalized profiles show that our sample galaxies fall into two main groups; the first group (NGC 1316, NGC 1344, NGC 1399, NGC 3384, NGC 4374, NGC 4406, NGC 5128 and NGC 5846) shows a slightly declining profile from the centre outwards, the second group (NGC 821, NGC 3377, NGC 3379, NGC 4494, NGC 4564 and NGC 4697) shows a strongly declining profile. An exceptional case is NGC 1023, where increases until , before falling steeply.
-
5.
The radial profiles of the velocity dispersion show a variety of shapes. There are nearly flat profiles, in which the velocity dispersion falls only by a few percent from the central values; strongly declining profiles, in which we observe a drop of a factor of 2 in the velocity dispersion towards outer radii; and a few anomalous galaxies, which exhibit rising profiles, again related to the presence of a disc.
-
6.
More luminous galaxies (brighter total magnitude and X-ray luminosity) tend to have flatter and flatter velocity dispersion profiles and larger values of and dispersion measured at the outermost observed point. This is related to the fact that more massive galaxies have nearly flat dispersion profiles, and generally higher values for the outer velocity dispersion. Moreover, there is evidence that more massive and luminous galaxies have on average a lower number of PNe per unit luminosity (smaller ) than less massive galaxies.
-
7.
Slow rotators have on average flatter and flatter velocity dispersion profiles and larger values of and . Conversely, fast rotators have on average more steeply declining and velocity dispersion profiles, with lower values of and .
-
8.
Galaxies with high values of or nearly flat velocity dispersion profiles (i.e., more massive galaxies) are preferentially boxy in shape () and have smaller values of . Galaxies with small values of or declining velocity dispersion profiles (i.e., less massive galaxies) have a larger range of shapes () and ratios.
These results show that a full picture of the kinematics and angular momenta of elliptical galaxies requires information about their outer velocity fields. When comparing to models of the formation of ellipticals it is important to take into account the halo kinematics – the dynamical timescales in the haloes are longer and therefore the imprint of the formation mechanisms are preserved more strongly.
Acknowledgments
We would like to thank Eric Emsellem for providing the radial profiles of the SAURON data, John Kormendy for providing surface photometry of NGC 4374 prior to publication, and Karl Gebhardt for useful discussion.
The minor axis absorption-line kinematics of NGC 5846 is based on data from the SAURON archive.
This research has made use of the NASA/IPAC Extragalactic Database (NED), which is operated by the Jet Propulsion Laboratory, California Institute of Technology, under a contract with the National Aeronautics and Space Administration.
PD was supported by the DFG Cluster of Excellence “Origin and Structure of the Universe”. FDL was supported by the DFG Schwerpunktprogram SPP 1177 “Witnesses of Cosmic History”. MRM was supported by an STFC Senior Fellowship. NRN has been funded by CORDIS within FP6 with a Marie Curie European Reintegration Grant, contr. n. MERG-FP6-CT-2005-014774, co-funded by INAF. AJR was supported by the National Science Foundation Grant AST-0507729, and by the FONDAP centre for Astrophysics CONICYT 15010003.
References
- Abadi et al. (2006) Abadi, M. G., Navarro, J. F., & Steinmetz, M. 2006, MNRAS, 365, 747
- Arnaboldi et al. (1998) Arnaboldi, M., Freeman, K. C., Gerhard, O., et al. 1998, ApJ, 507, 759
- Arnaboldi et al. (1996) Arnaboldi, M., Freeman, K. C., Mendez, R. H., et al. 1996, ApJ, 472, 145
- Arnaboldi et al. (1994) Arnaboldi, M., Freeman, K. C., Saha, P., et al. 1994, in Bulletin of the American Astronomical Society, Vol. 26, Bulletin of the American Astronomical Society, 941
- Baldry et al. (2006) Baldry, I. K., Balogh, M. L., Bower, R. G., et al. 2006, MNRAS, 373, 469
- Barnes & Hernquist (1996) Barnes, J. E. & Hernquist, L. 1996, ApJ, 471, 115
- Bender (1988) Bender, R. 1988, A&A, 193, L7
- Bender et al. (1988) Bender, R., Doebereiner, S., & Moellenhoff, C. 1988, A&AS, 74, 385
- Bender et al. (1994) Bender, R., Saglia, R. P., & Gerhard, O. E. 1994, MNRAS, 269, 785
- Bender et al. (1989) Bender, R., Surma, P., Doebereiner, S., Moellenhoff, C., & Madejsky, R. 1989, A&A, 217, 35
- Bertola et al. (1993) Bertola, F., Pizzella, A., Persic, M., & Salucci, P. 1993, ApJ, 416, L45
- Binney (2005) Binney, J. 2005, MNRAS, 363, 937
- Binney et al. (1990) Binney, J. J., Davies, R. L., & Illingworth, G. D. 1990, ApJ, 361, 78
- Blakeslee et al. (2001) Blakeslee, J. P., Lucey, J. R., Barris, B. J., Hudson, M. J., & Tonry, J. L. 2001, MNRAS, 327, 1004
- Bournaud et al. (2005) Bournaud, F., Jog, C. J., & Combes, F. 2005, A&A, 437, 69
- Burkert et al. (2008) Burkert, A., Naab, T., Johansson, P. H., & Jesseit, R. 2008, ApJ, 685, 897
- Buzzoni et al. (2006) Buzzoni, A., Arnaboldi, M., & Corradi, R. L. M. 2006, MNRAS, 368, 877
- Capaccioli et al. (1990) Capaccioli, M., Held, E. V., Lorenz, H., & Vietri, M. 1990, AJ, 99, 1813
- Cappellari et al. (2006) Cappellari, M., Bacon, R., Bureau, M., et al. 2006, MNRAS, 366, 1126
- Cappellari & Emsellem (2004) Cappellari, M. & Emsellem, E. 2004, PASP, 116, 138
- Cappellari et al. (2007) Cappellari, M., Emsellem, E., Bacon, R., et al. 2007, MNRAS, 379, 418
- Cattaneo et al. (2006) Cattaneo, A., Dekel, A., Devriendt, J., Guiderdoni, B., & Blaizot, J. 2006, MNRAS, 370, 1651
- Ciardullo et al. (2002) Ciardullo, R., Feldmeier, J. J., Krelove, K., Jacoby, G. H., & Gronwall, C. 2002, ApJ, 566, 784
- Ciardullo et al. (1993) Ciardullo, R., Jacoby, G. H., & Dejonghe, H. B. 1993, ApJ, 414, 454
- Ciardullo et al. (1989a) Ciardullo, R., Jacoby, G. H., & Ford, H. C. 1989a, ApJ, 344, 715
- Ciardullo et al. (1989b) Ciardullo, R., Jacoby, G. H., Ford, H. C., & Neill, J. D. 1989b, ApJ, 339, 53
- Ciotti et al. (2007) Ciotti, L., Lanzoni, B., & Volonteri, M. 2007, ApJ, 658, 65
- Cox et al. (2006) Cox, T. J., Dutta, S. N., Di Matteo, T., et al. 2006, ApJ, 650, 791
- David et al. (2006) David, L. P., Jones, C., Forman, W., Vargas, I. M., & Nulsen, P. 2006, ApJ, 653, 207
- De Lorenzi et al. (2007) De Lorenzi, F., Debattista, V. P., Gerhard, O., & Sambhus, N. 2007, MNRAS, 376, 71
- De Lorenzi et al. (2008a) De Lorenzi, F., Gerhard, O., Coccato, L., et al. 2008a, MNRAS submitted (ArXiv: 0804.3350)
- De Lorenzi et al. (2008b) De Lorenzi, F., Gerhard, O., Saglia, R. P., et al. 2008b, MNRAS, 385, 1729
- de Vaucouleurs et al. (1991) de Vaucouleurs, G., de Vaucouleurs, A., Corwin, Jr., H. G., et al. 1991, Third Reference Catalogue of Bright Galaxies (RC3)
- Debattista et al. (2002) Debattista, V. P., Corsini, E. M., & Aguerri, J. A. L. 2002, MNRAS, 332, 65
- Dejonghe et al. (1996) Dejonghe, H., de Bruyne, V., Vauterin, P., & Zeilinger, W. W. 1996, A&A, 306, 363
- Dekel et al. (2005) Dekel, A., Stoehr, F., Mamon, G. A., et al. 2005, Nature, 437, 707
- Douglas et al. (2002) Douglas, N. G., Arnaboldi, M., Freeman, K. C., et al. 2002, PASP, 114, 1234
- Douglas et al. (2007) Douglas, N. G., Napolitano, N. R., Romanowsky, A. J., et al. 2007, ApJ, 664, 257
- Emsellem et al. (2007) Emsellem, E., Cappellari, M., Krajnović, D., et al. 2007, MNRAS, 379, 401
- Emsellem et al. (2004) Emsellem, E., Cappellari, M., Peletier, R. F., et al. 2004, MNRAS, 352, 721
- Faber et al. (2007) Faber, S. M., Willmer, C. N. A., Wolf, C., et al. 2007, ApJ, 665, 265
- Fisher (1997) Fisher, D. 1997, AJ, 113, 950
- Forestell & Gebhardt (2008) Forestell, A. & Gebhardt, K. 2008, ApJ submitted (ArXiv: 0803.3626)
- Freedman et al. (2001) Freedman, W. L., Madore, B. F., Gibson, B. K., et al. 2001, ApJ, 553, 47
- Gebhardt et al. (2000) Gebhardt, K., Richstone, D., Kormendy, J., et al. 2000, AJ, 119, 1157
- Gebhardt et al. (2003) Gebhardt, K., Richstone, D., Tremaine, S., et al. 2003, ApJ, 583, 92
- Gerhard et al. (2001) Gerhard, O., Kronawitter, A., Saglia, R. P., & Bender, R. 2001, AJ, 121, 1936
- Gerhard (1993) Gerhard, O. E. 1993, MNRAS, 265, 213
- Goudfrooij et al. (1994) Goudfrooij, P., Hansen, L., Jorgensen, H. E., et al. 1994, A&AS, 104, 179
- Greggio & Renzini (1990) Greggio, L. & Renzini, A. 1990, ApJ, 364, 35
- Halliday et al. (2001) Halliday, C., Davies, R. L., Kuntschner, H., et al. 2001, MNRAS, 326, 473
- Hao et al. (2006) Hao, C. N., Mao, S., Deng, Z. G., Xia, X. Y., & Wu, H. 2006, MNRAS, 370, 1339
- Hargreaves et al. (1994) Hargreaves, J. C., Gilmore, G., Irwin, M. J., & Carter, D. 1994, MNRAS, 269, 957
- Hui et al. (1995) Hui, X., Ford, H. C., Freeman, K. C., & Dopita, M. A. 1995, ApJ, 449, 592
- Ikebe et al. (1996) Ikebe, Y., Ezawa, H., Fukazawa, Y., et al. 1996, Nature, 379, 427
- Jacoby (1980) Jacoby, G. H. 1980, ApJS, 42, 1
- Jacoby et al. (1990) Jacoby, G. H., Ciardullo, R., & Ford, H. C. 1990, ApJ, 356, 332
- Jedrzejewski (1987) Jedrzejewski, R. I. 1987, MNRAS, 226, 747
- Jensen et al. (2003) Jensen, J. B., Tonry, J. L., Barris, B. J., et al. 2003, ApJ, 583, 712
- Jesseit et al. (2007) Jesseit, R., Naab, T., Peletier, R. F., & Burkert, A. 2007, MNRAS, 376, 997
- Kang et al. (2007) Kang, X., van den Bosch, F. C., & Pasquali, A. 2007, MNRAS, 381, 389
- Kissler-Patig et al. (1998) Kissler-Patig, M., Brodie, J. P., Schroder, L. L., et al. 1998, AJ, 115, 105
- Kormendy & Bender (1996) Kormendy, J. & Bender, R. 1996, ApJ, 464, L119
- Kormendy & Djorgovski (1989) Kormendy, J. & Djorgovski, S. 1989, ARA&A, 27, 235
- Kormendy et al. (2008) Kormendy, J., Fisher, D. B., Cornell, M. E., & Bender, R. 2008, ApJS in press (ArXiv:0810.1681)
- Krajnović et al. (2008) Krajnović, D., Bacon, R., Cappellari, M., et al. 2008, MNRAS, 390, 93
- Kronawitter et al. (2000) Kronawitter, A., Saglia, R. P., Gerhard, O., & Bender, R. 2000, A&AS, 144, 53
- Lauer et al. (2005) Lauer, T. R., Faber, S. M., Gebhardt, K., et al. 2005, AJ, 129, 2138
- Magorrian et al. (1998) Magorrian, J., Tremaine, S., Richstone, D., et al. 1998, AJ, 115, 2285
- Méndez et al. (2001) Méndez, R. H., Riffeser, A., Kudritzki, R.-P., et al. 2001, ApJ, 563, 135
- Méndez et al. (2008) Méndez, R. H., Teodorescu, A. M., & Kudritzki, R.-P. 2008, ApJS, 175, 522
- Merrett et al. (2006) Merrett, H. R., Merrifield, M. R., Douglas, N. G., et al. 2006, MNRAS, 369, 120
- Merritt (1993) Merritt, D. 1993, ApJ, 413, 79
- Moré et al. (1980) Moré, J. J., Garbow, B. S., & Hillstrom, K. E. 1980, User Guide for MINPACK-1 (Argonne Nat. Lab. Rep. ANL-80-74; Argonne: Argonne National Laboratory)
- Naab & Burkert (2003) Naab, T. & Burkert, A. 2003, ApJ, 597, 893
- Naab et al. (1999) Naab, T., Burkert, A., & Hernquist, L. 1999, ApJ, 523, L133
- Naab et al. (2006) Naab, T., Jesseit, R., & Burkert, A. 2006, MNRAS, 372, 839
- Naab et al. (2007) Naab, T., Johansson, P. H., Ostriker, J. P., & Efstathiou, G. 2007, ApJ, 658, 710
- Napolitano et al. (2002) Napolitano, N. R., Arnaboldi, M., & Capaccioli, M. 2002, A&A, 383, 791
- Napolitano et al. (2001) Napolitano, N. R., Arnaboldi, M., Freeman, K. C., & Capaccioli, M. 2001, A&A, 377, 784
- Napolitano et al. (2005) Napolitano, N. R., Capaccioli, M., Romanowsky, A. J., et al. 2005, MNRAS, 357, 691
- Napolitano et al. (2008) Napolitano, N. R., Romanowsky, A. J., Coccato, L., et al. 2008, MNRAS in press (ArXiv:0810.1291)
- Noordermeer et al. (2008) Noordermeer, E., Merrifield, M. R., Coccato, L., et al. 2008, MNRAS, 384, 943
- Oñorbe et al. (2007) Oñorbe, J., Domínguez-Tenreiro, R., Sáiz, A., & Serna, A. 2007, MNRAS, 376, 39
- Oosterloo et al. (2002) Oosterloo, T. A., Morganti, R., Sadler, E. M., Vergani, D., & Caldwell, N. 2002, AJ, 123, 729
- O’Sullivan et al. (2001) O’Sullivan, E., Forbes, D. A., & Ponman, T. J. 2001, MNRAS, 328, 461
- Peletier et al. (1990) Peletier, R. F., Davies, R. L., Illingworth, G. D., Davis, L. E., & Cawson, M. 1990, AJ, 100, 1091
- Peng et al. (2004) Peng, E. W., Ford, H. C., & Freeman, K. C. 2004, ApJ, 602, 685
- Pinkney et al. (2003) Pinkney, J., Gebhardt, K., Bender, R., et al. 2003, ApJ, 596, 903
- Rix et al. (1999) Rix, H.-W., Carollo, C. M., & Freeman, K. 1999, ApJ, 513, L25
- Romanowsky et al. (2003) Romanowsky, A. J., Douglas, N. G., Arnaboldi, M., et al. 2003, Science, 301, 1696
- Romeo et al. (2008) Romeo, A. D., Napolitano, N. R., Covone, G., et al. 2008, MNRAS, 389, 13
- Saglia et al. (2000) Saglia, R. P., Kronawitter, A., Gerhard, O., & Bender, R. 2000, AJ, 119, 153
- Sambhus et al. (2006) Sambhus, N., Gerhard, O., & Méndez, R. H. 2006, AJ, 131, 837
- Samurović & Danziger (2005) Samurović, S. & Danziger, I. J. 2005, MNRAS, 363, 769
- Sánchez-Blázquez et al. (2006) Sánchez-Blázquez, P., Peletier, R. F., Jiménez-Vicente, J., et al. 2006, MNRAS, 371, 703
- Scarlata et al. (2007) Scarlata, C., Carollo, C. M., Lilly, S. J., et al. 2007, ApJS, 172, 494
- Sikkema et al. (2007) Sikkema, G., Carter, D., Peletier, R. F., et al. 2007, A&A, 467, 1011
- Simien & Prugniel (1997) Simien, F. & Prugniel, P. 1997, A&AS, 126, 519
- Sluis & Williams (2006) Sluis, A. P. N. & Williams, T. B. 2006, AJ, 131, 2089
- Statler & Smecker-Hane (1999) Statler, T. S. & Smecker-Hane, T. 1999, AJ, 117, 839
- Teodorescu et al. (2005) Teodorescu, A. M., Méndez, R. H., Saglia, R. P., et al. 2005, ApJ, 635, 290
- Thomas et al. (2007) Thomas, J., Saglia, R. P., Bender, R., et al. 2007, MNRAS, 382, 657
- Tonry et al. (2001) Tonry, J. L., Dressler, A., Blakeslee, J. P., et al. 2001, ApJ, 546, 681
- Tremblay et al. (1995) Tremblay, B., Merritt, D., & Williams, T. B. 1995, ApJ, 443, L5
- Treu et al. (2005) Treu, T., Ellis, R. S., Liao, T. X., et al. 2005, ApJ, 633, 174
- Valdes et al. (2004) Valdes, F., Gupta, R., Rose, J. A., Singh, H. P., & Bell, D. J. 2004, ApJS, 152, 251
- van der Marel (1991) van der Marel, R. P. 1991, MNRAS, 253, 710
- van der Marel & van Dokkum (2007) van der Marel, R. P. & van Dokkum, P. G. 2007, ApJ, 668, 756
- van Dokkum et al. (2004) van Dokkum, P. G., Franx, M., Förster Schreiber, N. M., et al. 2004, ApJ, 611, 703
- Weijmans et al. (2008) Weijmans, A.-M., Krajnović, D., van de Ven, G., et al. 2008, MNRAS, 383, 1343
- Weil & Hernquist (1996) Weil, M. L. & Hernquist, L. 1996, ApJ, 460, 101
- Woodley et al. (2007) Woodley, K. A., Harris, W. E., Beasley, M. A., et al. 2007, AJ, 134, 494
- Wyder et al. (2005) Wyder, T. K., Treyer, M. A., Milliard, B., et al. 2005, ApJ, 619, L15
Appendix A Two-dimensional velocity and velocity dispersion fields of galaxies in sample B
Different authors adopted their own procedures and criteria to create smoothed two-dimensional fields of the PNe, depending on the amount of available data. Here, for a homogeneous analysis, we determine the two-dimensional velocity and velocity dispersion fields for some of these galaxies, adopting the procedure described in Section 4.2. We do this only for the galaxies with a sufficient number of PNe (), namely NGC 1023, NGC 1344, NGC 3379, NGC 4494, NGC 4697 and NGC 5128 (i.e., sample B). Parameters used in the kernel smoothing procedure and typical errors obtained with Monte Carlo simulations are listed in Table 7. Results are shown in Figure 19.
| Name | ||||
|---|---|---|---|---|
| arcsec | ||||
| (1) | (2) | (3) | (4) | (5) |
| NGC 1023 | 0.48 | 1.36 | 30 | 20 |
| NGC 1344 | 0.53 | -2.50 | 30 | 20 |
| NGC 3379 | 0.57 | 14.92 | 30 | 30 |
| NGC 4494 | 0.48 | 11.36 | 30 | 20 |
| NGC 4697 | 0.40 | 12.80 | 40 | 20 |
| NGC 5128 | 0.08 | 18.56 | 15 | 15 |
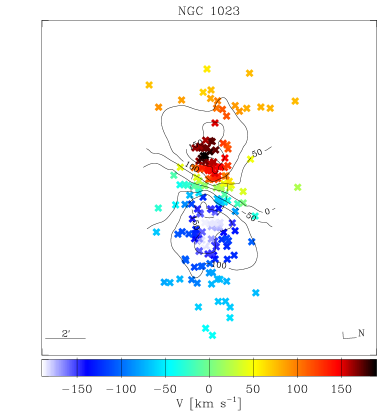
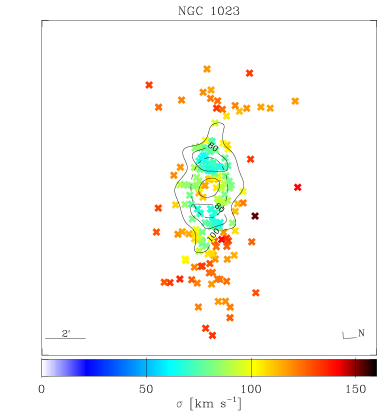
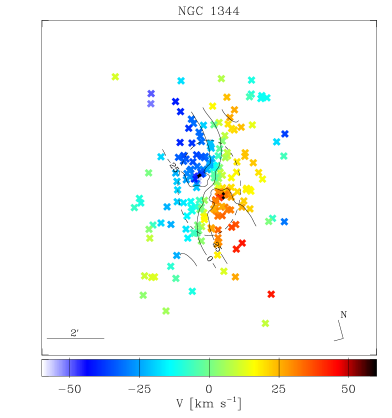
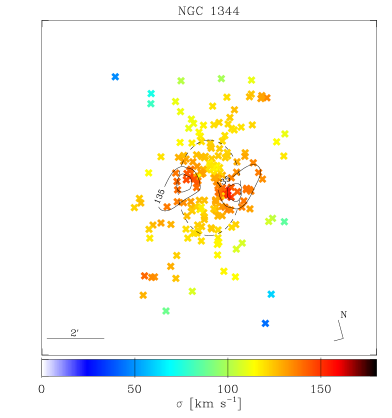
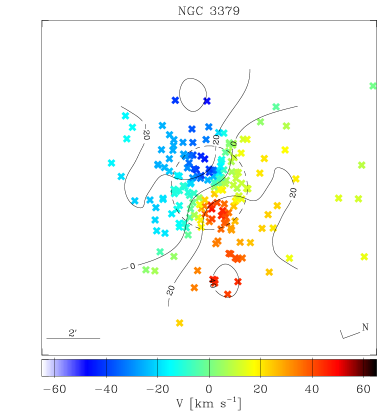
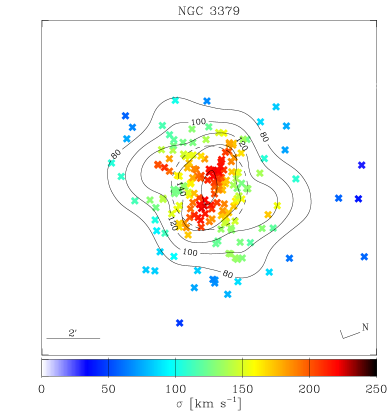
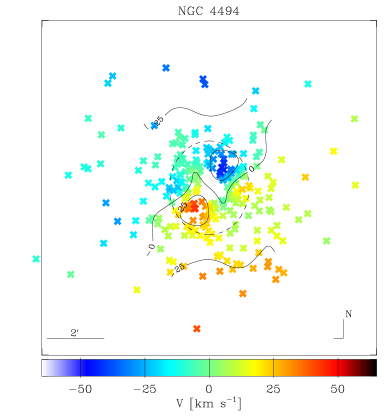
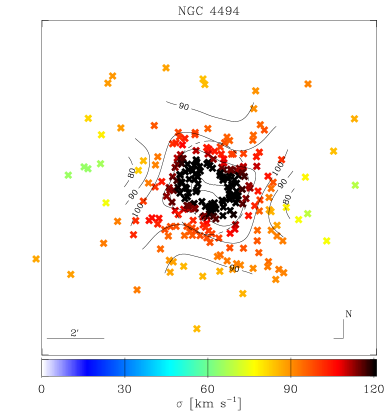
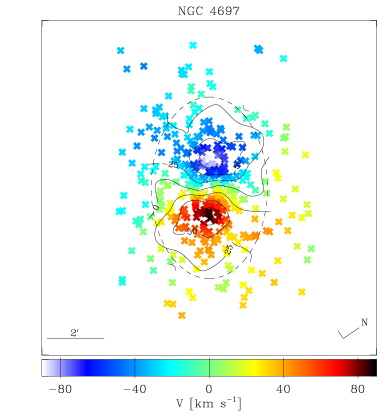
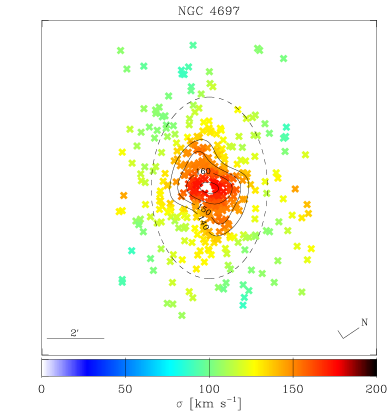
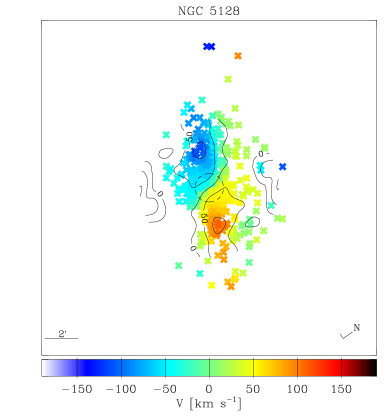
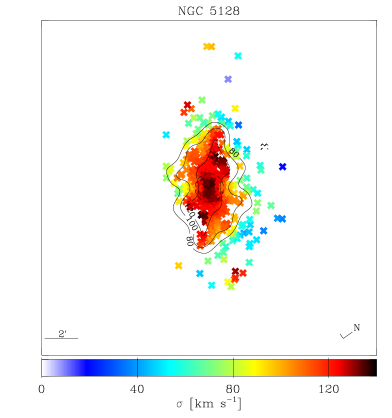
Appendix B Unsmoothed velocity fields
The smoothing technique described in Section 4.2 is required to measure the mean velocity and the velocity dispersion along the line of sight of the PNe system. A single PN radial velocity measurement randomly deviates from the local mean velocity by an amount that depends on the local velocity dispersion. One can ask how the unsmoothed map of PNe radial velocity measurements compares with the smoothed two-dimensional velocity field.
In galaxies with high , we expect that the velocity map of individual PNe radial velocity measurements preserves the characteristics of the mean velocity field. On the contrary, in galaxies with low we expect it to be chaotic and the mean rotation to be hidden in the scatter of the velocity dispersion, which dominates the kinematics. As examples, we show in Figure 20 the two-dimensional maps of individual PNe radial velocities for NGC 1023 (a system dominated by rotation) and NGC 4374 (a system dominated by velocity dispersion).
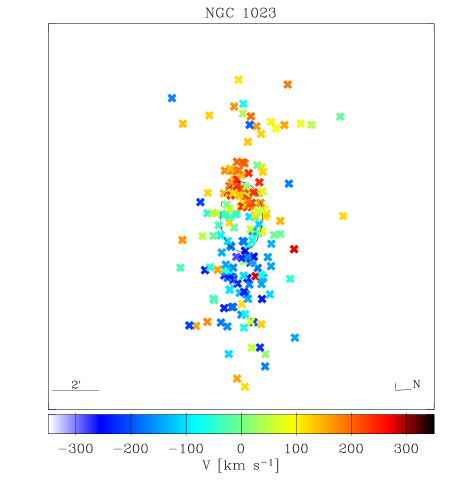
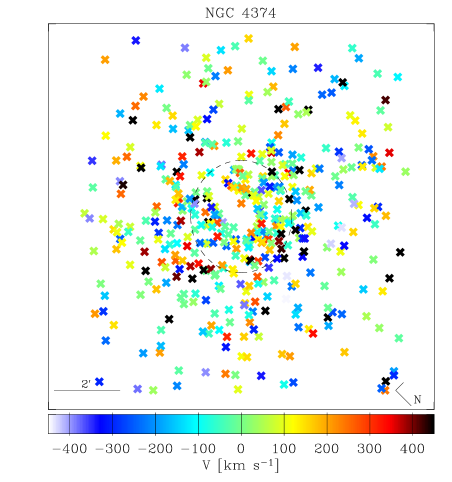
Appendix C Long-slit kinematics
Long-slit observations for NGC 3377, NGC 4374 and NGC 4494 were carried out with the Very Large Telescope (VLT) at the European Southern Observatory (ESO) in Paranal (Chile) from December 2005 to April 2006 (Proposal 76.B–0788A) in service mode under dark time conditions. The Unit Telescope 1 (Antu) was mounted with the Focal Reducer/low dispersion Spectrograph (FORS2), which was equipped with the 1400V Grism and the 05 slit. Spectra were taken along both the major and minor axes. Basic data reduction was performed using standard ESO-MIDAS666MIDAS is developed and maintained by the European Southern Observatory. and IRAF 777IRAF is distributed by NOAO, which is operated by AURA Inc., under contract with the National Science Foundation. routines. All the spectra were bias-subtracted, flat-field corrected by quartz lamp and twilight exposures, cleaned of cosmic rays, and wavelength calibrated. After calibration, the different spectra obtained for a given galaxy along the same position angle were co-added using the centre of the stellar-continuum radial profile as a reference. The contribution of the sky was determined at the two edges of the resulting frames where the galaxy light was negligible, and then subtracted. Spectra from adjacent rows had been binned together in order to ensure a signal-to-noise ratio of at least 25. The instrumental FWHM measured on the comparison spectra is .


The stellar kinematics (mean velocity, velocity dispersion, and Gauss-Hermite coefficients) was measured by means of the Penalized Pixel-Fitting method by Cappellari & Emsellem (2004), kinematic stellar templates were chosen from the Indo–U.S. Coudé Feed Spectral Library (Valdes et al. 2004) and the MILES library (Sánchez-Blázquez et al. 2006), and then convolved with a Gaussian function to match the instrumental FWHM. Spectral regions with known emission lines (H, [O III]) were masked and not included in the fit.
In Figure 21 we show the measured long-slit kinematics. Table C1 containing the measured absorption-line kinematics is available as Supplementary Material in the online version of this article.
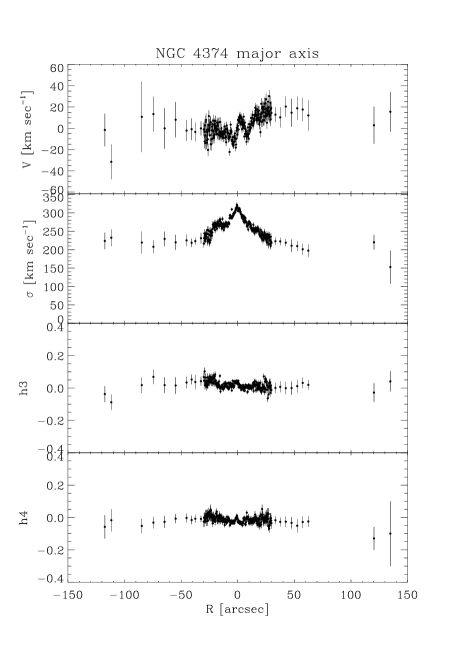


Appendix D Rotation and angular momentum considerations
Since the angular momentum of a star is weighted by its galactocentric radius, the outer regions of a galaxy are particularly important for estimating the total angular momentum. One cannot in general observe the three-dimensional positions and velocities necessary to calculate the full angular momentum, so we will use a two-dimensional projected proxy. This proxy angular momentum can be simplified to a one-dimensional problem by adopting the approximation that the rotation is aligned with the photometric major axis, and its azimuthal dependence is related to the major-axis velocity by (cf. Krajnović et al. 2008).
The cumulative proxy angular momentum inside a radius is then:
| (14) |
where the stellar surface density is . With the simplest assumptions that the galaxy light follows the law, and that the rotation velocity and the stellar mass-to-light ratio are both constant with radius, one can calculate that 9% of the total proxy angular momentum resides inside , and 50% inside 5.4 . The latter “angular momentum effective radius” (), is naturally larger if increases with or if the galaxy light is more extended (e.g. for Sérsic index ). It is smaller if decreases or if the light is more compact (e.g. for ).
These calculations show that probing well outside is essential for characterizing the angular momentum of an elliptical galaxy. The dimensionless cumulative angular momentum-like parameter introduced by Emsellem et al. (2007) can also be shown to have the same limitation, so that the global angular momentum requires measurements to .
An alternative approach is to consider the radius of gyration, , as the rule-of-thumb target radius for measuring the angular momentum. is defined as the radius where a point mass would have the same specific moment of inertia as the extended mass profile. Using the formula
| (15) |
we find very similar radii to the calculations reported above, e.g., for Sérsic .