Functional modularity of background activities in normal and epileptic brain networks
Abstract
We analyze the connectivity structure of weighted brain networks extracted from spontaneous magnetoencephalographic (MEG) signals of healthy subjects and epileptic patients (suffering from absence seizures) recorded at rest. We find that, for the activities in the 5-14 Hz range, healthy brains exhibit a sparse connectivity, whereas the brain networks of patients display a rich connectivity with clear modular structure. Our results suggest that modularity plays a key role in the functional organization of brain areas during normal and pathological neural activities at rest.
pacs:
89.75.-k, 87.19.le, 87.19.ljFrom the brain to the Internet and to social groups, the characterization of the connectivity patterns of complex systems has revealed a wiring organization that can be captured neither by regular lattices, nor by random graphs boccaletti . In neurosciences, it is widely acknowledged that the emergence of several pathological states is accompanied by changes in brain connectivity patterns varela01 . Recently, it has been found that functional connectivity patterns obtained from magnetoencephalography (MEG) and electroencephalography (EEG) signals during different pathological and cognitive brain states (including epilepsy) display small-world (SW) properties functionalNetsSW . Empirical studies have also lead to the hypothesis that brain functions rely on the coordination of a scattered mosaic of functionally specialized brain regions (modules), forming a web-like structure of neural assemblies varela01 . Modularity is a key concept in complex networks from RNA structures to social networks modularityDefinition ; Guimera2005 . A module is usually defined as a subset of units within a network, such that connections between them are denser than connections with the rest of the network. In biological systems, it is generally acknowledged that modularity results from evolutionary constraints and plays a key role in robustness, flexibility and stability stabilityModules .
Absence seizures are the most characteristic expression of non-convulsive generalized epilepsy. Their main characteristic in brain signals is the occurrence of high amplitude, rhythmic spike wave discharges synchronized over wide cortical areas, which manifests suddenly from a normal background. Current studies of brain connectivity mainly focus on the onset and evolution of epileptic discharges. Nevertheless, little is known about the organization of brain networks during spontaneous background activities of patients, and the role of these connectivity patterns on the emergence of absence seizures. In this Letter we study the modular organization of brain networks extracted from spontaneous MEG signals of epileptic patients and healthy subjects. The results of our analysis reveal a non-random structural organization in both normal and pathological brain networks. In particular, the functional networks of control subjects are characterized by a sparse connectivity between the modules. In contrast, brain connectivity of epileptic patients (recorded out of seizures) displays a configuration where nodes in a functional module are connected to different functional modules. This modular configuration might play a key role in the integration of large scale brain activities, facilitating the emergence of epileptic discharges.
The data used in this study were acquired from 5 healthy subjects and 5 epileptic patients suffering from absence seizures. The study was performed with written consent of the subjects and with the approval of the local ethics committee. During the recordings, subjects and patients were instructed to rest quietly, but alert, and keep their eyes closed. The brain signals were acquired with a whole-head MEG system (151 sensors; VSM MedTech, Coquitlam, BC, Canada), digitized at kHz with a bandpass of Hz. All the analyses were performed on 338 non-overlapping quasi-stationary segments (206 for all the patients and 132 for the healthy group) of 5 seconds without eyes or muscular artefacts, nor epileptic activities (as, e.g., seizures or epileptic-like activity) and far (at least 10 s) from recent epileptic discharge. In agreement with previous findings, surrogate data tests revealed that less than % of interdependencies between the spontaneous brain activities were nonlinear surrogate . Thus, weighted brain networks were constructed by means of a definition of functional links based on linear coherence. The squared modulus of the coherence between two time series and (normalized to zero mean and unit variance) was defined as: , where and (the spectral and cross-spectral densities) were estimated using the Welch’s averaged periodogram method brillingerBOOK .
Recent results show that correlations between magnetic fields sensors located at a distance less than cm can not distinguish between spontaneous activities of epileptic patients and control subjects absenceSeizures . To reduce the influence of these spurious correlations between MEG signals, we have excluded the nearest sensors (separated less than cm) from the computation of coherence values. To perform the statistical analysis of coherence values, we used Fisher’s Z transform of : . Under the hypothesis of independence, has a normal distribution with expected value 0 and variance , where is the number of non-overlapping blocks used in the estimation of spectral densities brillingerBOOK . To correct for multiple testing, the False Discovery Rate (FDR) method was applied to each matrix of values FDR . With this approach, the threshold of significance was set such that the expected fraction of false positives is restricted to . Finally, in the network construction, a functional connection between two of the nodes (brain sites) was assumed as an undirected weighted link, i.e. we set the weight of the link between and as when , and otherwise.
To characterize the network structure of healthy subjects and epilectic patients, we evaluated a list of measures for weighted graphs boccaletti . Namely, the node strength , the weighted clustering coefficient boccaletti , the efficiency of a node latora ; as well as the respective averages over the graph nodes , and the global efficiency of the graph . As null model, brain networks were compared to equivalent random graphs, obtained by randomly rewiring the links of the original networks while keeping the same degree distribution Maslov2002 . The statistical significance of a given metric is assessed by quantifying its statistical deviation from values obtained in the ensemble of randomized networks. Let and be the mean and SD of the parameter computed from such an ensemble. The significance is given by the ratio whose p-value is given by the Chebyshev’s inequality papulisBOOK . To assess significant differences between topological features of the two groups, we used standard nonparametric permutation methods, which account for spatial dependences in the data randomPermutat . We used exhaustive permutations () to estimate the empirical distribution under the null hypothesis of no difference between the two groups.
| CTL | 4.04 | 0.233 (0.096) | 0.649 (0.892) | 0.538 (0.001) | 13.7 |
| PAT | 7.34 | 0.300 (0.160) | 0.893 (1.101) | 0.503 (0.006) | 8.30 |
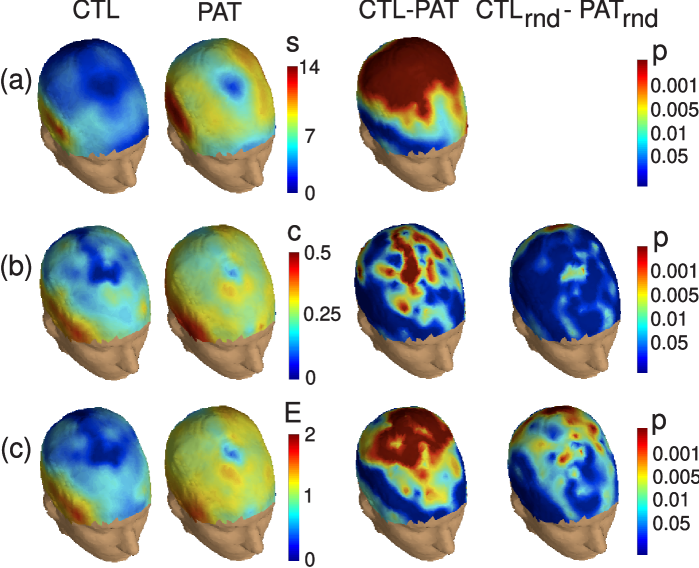
Although we applied our approach to connectivity graphs obtained from brain oscillations at the conventional frequency bands ( Hz, Hz, Hz, and Hz), statistically significant differences between normal and epileptic brain networks were observed only for the brain activities in the extended alpha range ( Hz). Henceforth, all results presented here refer to functional networks obtained at this frequency band. The basic network properties (averaged over subjects) are summarized in Table 1. The structure of functional brain networks was found to be significatively different from that of randomized counterparts. Namely, brain networks of both patients and healthy subjects yielded a clustering coefficient larger that that of randomized graphs (), and values of efficiency as large as those of random graphs, indicating a small-world behavior. These results agree with previous findings suggesting that brain sites have an optimal interaction with most other brain regions functionalNetsSW . Furthermore, average network properties (, and ) of epileptic patients were found to be different () from those of control subjects, supporting the hypothesis that neural disturbances are correlated with changes in functional network architectural features varela01 .
A more detailed information on the differences between patients and control subjects can be acquired by the analysis of the network at the level of node properties. In Fig. 1 we report the spatial distribution of node measures , and (averaged over all control subjects and over all patients) for each sensor of the network. Results indicate that epilectic patients have a richer node connectivity than control subjects. Difference maps clearly identify the centro-parietal regions as those brain areas with the highest contrast between patients and control group. Although the node strength of epileptic patients is twice as large as that of healthy subjects, if links of real networks are randomly rewired by keeping the same degree distribution, no significant differences are observed between the two groups. This rules out the possibility that the difference in the number of connections alone could account for differences in and . No significant difference between healthy subjects and patients was observed by direct comparison of the spatial maps of the –activity power supplementaryInfo .
A potential modularity of brain networks is suggested by the fact that the networks display a clustering coefficient larger than that obtained in random graphs Ravasz2002 . Previous studies over brain networks have used clustering methods to identify similar groups of brain activities. However, classical approaches such as those based on principal components analysis (PCA) and independent components analysis (ICA), make very strong statistical assumptions (orthogonality and statistical independence of the retrieved components, respectively) with no physiological justification pcaICA . To find the network modules we have instead used an algorithm based on a spectral embedding of graphs lafon2006 (similar theoretical frameworks have been recently proposed spectralMethods ). The algorithm is based on the definition of a Markov chain with a transition probability matrix with entries . If is the iterate of matrix , the element encodes the probability of moving from node to node through a random walk of length . For an undirected and connected graph, the Perron Frobenius theorem assures that is the unique stationary distribution of the Markov chain, such that . For directed networks, recent approaches are proposed to ensure this convergence directedNets .
The random walk gives rise to a geometric diffusion with an associated distance between nodes and defined as lafon2006 : , where the term is supposed to compensate for discrepancies in local densities. By construction, distance between nodes is strongly ruled by the connectivity of the graph, and it takes small values if nodes are connected by many paths. Considering the spectral representations of matrix , one has a set of eigenvalues and eigenvectors and such that and . The diffusion distance can be written as: where denotes the component of eigenvector . The diffusion distance can be approximated (note that and is a constant vector) to a relative precision using the first nontrivial eigenvectors and eigenvalues: . This is equivalent to embed the graph in a low dimensional space , converting the diffusion distance between nodes of the graph into Euclidean distance in lafon2006 . This approach has the main advantage that it defines a meaningful representation of the graph and it leads to explicitly define a distance metric on the space that reflects the connectivity of the network. Graph modules are then extracted by a -means clustering algorithm in the embedding space. The algorithm starts with a random assignment of cluster center. Then, the partition is updated by repeating the following steps: i) each point is assigned to the nearest center; ii) the new geometric center of each cluster are recomputed. The algorithm stops when the assignments of nodes are no longer changed. The algorithm reaches convergence in very few iterations after the initial generations, but it only guarantees a convergence towards a local optimum. In fact, the -means is sensitive to the initial choice of centroids. To overcome this drawback, we run the algorithm several times (500) for different number of modules () and return the partition yielding the largest modularity . The modularity for a given partition of a weighted network is defined as modularityDefinition : , where is the total weight of all connections in the network, is the weight of links between vertices in module , and is the total weight of links in module . To select the optimal number of diffusion coordinates, we have repeated the clustering algorithm for all possible values of , and looked for the largest value of .
The method has been tested on synthetic networks performance , and used to find modules in brain networks. The presence of modules is actually confirmed by the high values of obtained for the optimal partition of the brain networks of both control subjects and patients. The main result is that brain networks of epileptic patients have a structure consisting in a smaller number of modules () with respect to that of control subjects (). To assess the stability of the partition structure across healthy subjects and patients we used the adjusted Rand index randIndex , which yields a normalized value between (if the two partitions are randomly drawn) and (for an identical partition structure). The values of indicate a high stability of the partition structure across all the epileptic patients () and certain variability in the modular structure of control subjects ().
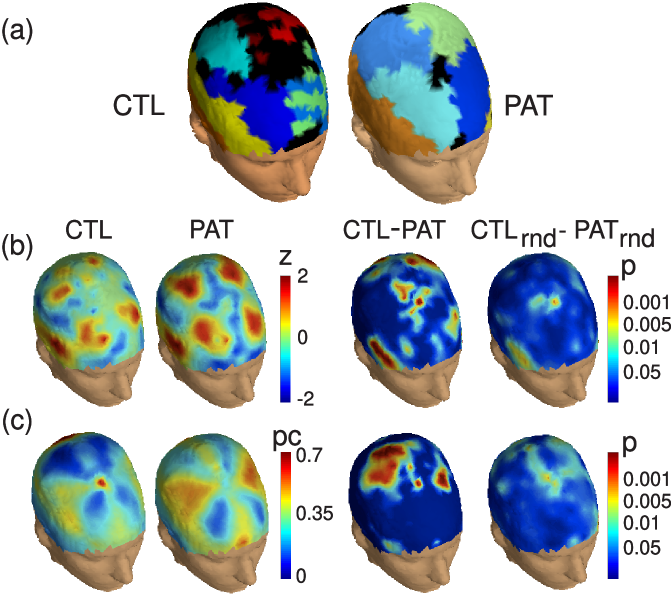
Fig. 2(a) illustrates the spatial distribution of the modules obtained for healthy subjects and patients. Despite the differences, some modules fit well some known brain regions including occipital, parietal, and frontal areas. Although a one-to-one assignment of anatomical brain areas to the retrieved modules is difficult to define, modules assignment provides the basis for the analysis of nodes according to their patterns of intra- and inter-modules connections Guimera2005 . The within-module degree -score measures how well connected the node is to other nodes in the same module, and is defined as ; where is total weight of links of node to other nodes in its module , while and are average node strength and standard deviation of nodes in . Thus node will display a large value of if it has a large number of intra-modular connections relative to other nodes in the same module. The participation coefficient quantifies instead to which extent a node is connected to different modules. This coefficient takes values of zero if a node has most of its links exclusively with other nodes of its module, and if they are distributed among different modules.
In Figs. 2(b-c) we report respectively the spatial distribution of the node participation coefficient and of the -score for control subjects and patients. The difference map for the -score reveals very small differences in the way the nodes are connected to other nodes in the same module. Conversely, the distribution of the participation coefficient in control subjects strongly differ from that obtained for epileptic patients where nodes (specially those of the right centro-parietal areas) participate with their links in several modules. The same modular partition did not reveal significant differences between the equivalent random configurations of both groups supplementaryInfo . This is a remarkable result as it supports the hypothesis that normal and pathological brain dynamics are characterized by different functional connectivity patterns typeIerror .
In conclusion, in this paper we have addressed a fundamental problem in neuroscience: characterizing the connectivity structure of functional networks associated to normal and pathological neural dynamics. From the analysis of spontaneous brain activities at rest, we found that the architecture of functional networks extracted from epileptic patients differs from that of healthy subjects. Interestingly, we identified a non-random modular structure of brain networks. Modularity analysis revealed that nodes of epileptic brain networks abnormally link different functional modules in the network. The connectivity of brain activities at the extended -band of epileptic patients might play a putative role in the emergence of absence seizures. This leads up to the need of more refined studies, as in Ref Srinivas2007 , to address the role of this architecture in the absences seizures.
A modular description of brain networks might provide, more in general, meaningful insights into the functional organization of brain activities recorded with others neuroimaging techniques (EEG, MEG or fMRI) during diverse cognitive or pathological states. Applied to other multivariate data (e.g., financial or epidemiological time series), our approach could provide new insights into the network structure of spatially extended systems.
The authors thank F. Amor and Y. Attal for kindly providing the data. This work was supported by the EU-GABA Project, contract no. 043309 (NEST).
References
- (1) S. Boccaletti, et al., Phys. Rep. 424, 175 (2006).
- (2) F. Varela, et al., Nat. Rev. Neurosci. 2, 229 (2001); O. Sporns, et al., Trends Cogn. Sci. 8, 418 (2004);
- (3) C. J. Stam, Neurosci Lett 355, 25 (2004); S. C. Ponten et al., Exp. Neurol. 217, 197 (2009).
- (4) M. E. J. Newman, Phys. Rev. E. 74, 036104 (2006)
- (5) R. Guimerà and L. A. N. Amaral, Nature 433, 895 (2005).
- (6) R. V. Solé, and S. Valverde, J. R. Soc. Interface 5, 129 (2008).
- (7) C. J. Stam, et al., Hum Brain Mapp 19, 63 (2003).
- (8) D. R. Brillinger, Time Series: Data Analysis and Theory. SIAM, Philadelphia, PA (2001).
- (9) L. Garcia Dominguez, et al., J. Neurosci. 25, 8077 (2005).
- (10) Y. Benjamini, and Y. Yekutieli, Ann Statist 29, 1165 (2001).
- (11) V. Latora, and M. Marchiori, Phys. Rev. Lett. 87, 198701 (2001).
- (12) S. Maslov and K. Sneppen, Science 296, 910 (2002).
- (13) A. Papoulis, Probability, Random Variables and Stochastic Processes. McGraw-Hill, Singapore, (1991).
- (14) D. Pantazis, et al., Neuroimage 25 383 (2005).
- (15) E. Ravasz, et al., Science 297, 1551 (2002).
- (16) T.-P. Jung, et al., Proc. IEEE 89, 1107 (2001)
- (17) R. R. Coifman and S. Lafon, Appl Comput Harmon Anal 21 5 (2006).
- (18) D. Gfeller, and P. De Los Rios, Phys. Rev. Lett. 99, 038701 (2007). I. Baruchi, et al., Chaos 16, 015112 (2006).
- (19) M. Meilă, and W. Pentney in Proceedings of the SIAM International Conference on Data Mining, Minnesota, April 2007.
- (20) The performance of the method has been tested on computer generated graphs with tunable modularity structure. Even when half of a node’s links points to outside modules, the accuracy of the method is high () and comparable to that of the algorithm in Ref. modularityDefinition
- (21) L. Hubert and P. Arabie, J. Classif. 2, 193 (1985).
- (22) See EPAPS Document No. [number will be inserted by publisher] for supplementary material.
- (23) For all the topological features, a nominal type I error control by permutation testing revealed no significant differences between two randomly subsets of each group data.
- (24) K. V. Srinivas, et al., Eur J Neurosci 25 3276 (2007).