Quantifying the fast outflow in the luminous Seyfert galaxy PG1211+143
Abstract
We report two new XMM-Newton observations of PG1211+143 in December 2007, again finding evidence for the fast outflow of highly ionised gas first detected in 2001. Stacking the new spectra with those from two earlier XMM-Newton observations reveals strong and broad emission lines of FeXXV and OVIII, indicating the fast outflow to be persistent and to have a large covering factor. This finding confirms a high mass rate for the ionised outflow in PG1211+143 and provides the first direct measurement of a wide angle, sub relativistic outflow from an AGN transporting mechanical energy with the potential to disrupt the growth of the host galaxy. We suggest PG1211+143 may be typical of an AGN in a rapid super-Eddington growth phase.
keywords:
galaxies: active – galaxies: Seyfert: quasars: general – galaxies: individual: PG1211+143 – X-ray: galaxies1 Introduction
An early XMM-Newton observation of the bright QSO PG1211+143 in 2001 provided strong evidence of a radial outflow of highly ionised gas with the remarkably high velocity of 0.13c (Pounds et al. 2003; Pounds and Page 2006). Unless viewed along the axis of a highly collimated flow, the high column density required to produce the observed Fe K absorption, combined with the high velocity, implied a mass outflow rate comparable to the accretion rate and transporting mechanical energy at a significant fraction of the bolometric luminosity. The broader potential importance of such energetic flows, which we have suggested might be typical of AGN accreting at the Eddington rate (King and Pounds 2003), is in offering a feedback mechanism that could link the growth of supermassive black holes in AGN with their host galaxy (Ferrarase and Merritt 2000, Gebhardt et al. 2000, Tremaine et al. 2002, King 2003, Kim et al. 2008). The greatly improved sensitivity of current X-ray observations in the Fe K energy band is now yielding more examples of highly ionised outflows with large column densities and high velocities (see Cappi 2006 for a recent review), but the lack of information on the outflow collimation and covering factors has left large uncertainties in the total mass and energy of these flows (Elvis 2006).
A second XMM-Newton observation, in 2004, found PG1211+143 to be in a brighter flux state, but with both the highly ionised and the moderately ionised spectral features responsible for the mid-band spectral curvature (and thereby contributing to a strong ‘soft excess’) significantly weaker. We now report two further XMM-Newton observations in December 2007, finding the integrated X-ray flux to be higher again than in 2004. However, while the flux increase appears to be dominated by a soft continuum component, consistent with previous modelling of the broad band X-ray spectrum of PG1211+143 (Pounds and Reeves 2007; hereafter P07), the blue-shifted Fe K absorption is again clearly detected. We now combine data from all four observations of PG1211+143 in an attempt to characterise and quantify the re-emission from the highly ionised outflow and use this to clarify the flow structure, mass and energy.
We assume a redshift for PG1211+143 of (Marziani et al. 1996).
2 Observation and data reduction
The 2007 observations of PG1211+143 by XMM-Newton took place on December 21 and 23, with on-target exposures of 65 ks and 50 ks. In this paper we use data from the EPIC pn and MOS cameras (Strüder et al. 2001,Turner et al. 2001) and the high resolution Reflection Grating Spectrometer (den Herder et al. 2001). Source counts from the EPIC cameras were taken from a circular region of 45′′ radius around the centroid position of PG1211+143, with simultaneous background spectra from a larger region, offset from but close to the target source. X-ray data were extracted with the XMM SAS v7.1 software and events selected corresponding to patterns 0-4 (single and double pixel events) for the pn camera and patterns 0-12 for the MOS cameras. Individual source spectra were integrated over the periods of low background and binned to a minimum of 20 counts per bin to facilitate use of minimalisation in spectral fitting.
Spectral fitting was based on the Xspec package (Arnaud 1996) and all fits included absorption due to the line-of-sight Galactic column of (Murphy et al. 1996). Errors on individual parameters are quoted at the 90% confidence level.
3 Visual examination of the EPIC data
Figure 1 displays the new pn spectral data of PG1211+143, together with data from the earlier XMM-Newton observations. In comparing such raw spectra, we note that each represents an integration of up to a day, with separations of 3 years, 6 years and 2-3 days. Visual examination of figure 1 suggests, however, that rather clear differences in such spectral ‘snapshots’ could be instructive in exploring spectral composition and variability. Thus, the ratio of the 2001 and 2004 EPIC count rate spectra (black and red in figure 1) led us to conclude (P07) that a decrease in continuum absorption was the main cause of the broad spectral change from 2001 to 2004. An important constraint on the nature of that variable absorption is the similarity in the ionising flux during the 2001 and 2004 observations indicated by the near-identical spectra above 3 keV, suggesting a change in covering factor rather than ionisation parameter.
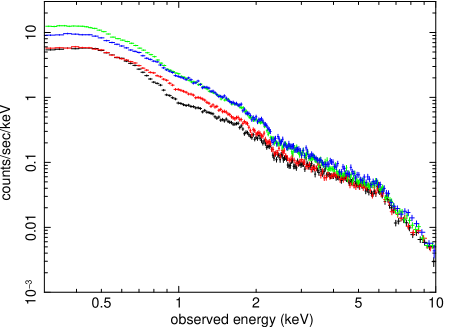
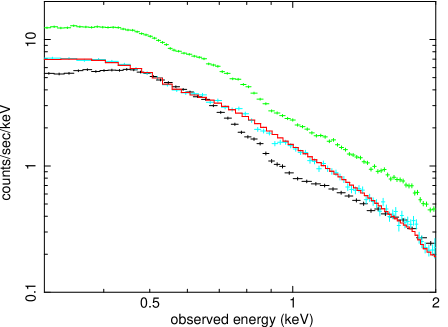
In both 2007 observations PG1211+143 was a factor 2-3 brighter still than in 2004, though again converging at the upper end of the EPIC energy band. In modelling the 2001 and 2004 spectra we introduced a second continuum component which contributed strongly in the soft X-ray band (P07). Direct comparison of the highest (2007a) and lowest (2001) flux spectra now allow that model to be tested over a wider flux range. Figure 2 shows the outcome, with the count rate difference spectrum being well fitted by a power law of 3, unaffected by continuum absorption.
We leave further discussion of this soft continuum component to another time while noting that - if a common property of luminous AGN - a soft, variable continuum substantially reduces the problem of the ‘soft excess’ widely debated over many years (e.g. Sobolewska and Done 2007 and references therein).
3.1 Further evidence for a high velocity outflow
The most important outcome of the 2001 observation of PG1211+143 was the detection of blue-shifted absorption lines of highly ionised Fe, S and Mg, initially interpreted (Pounds et al. 2003) as arising in highly ionised gas outflowing at 0.1c. A more complete analysis of pn and MOS spectra, based on the detection of 7 absorption lines of Ne, Mg, Si, S and Fe, removed an ambiguity on line identification, confirming a lower ionisation parameter and correspondingly higher velocity of 0.13c (Pounds and Page 2006). Emission lines were less well defined, and the model of P07 offered a possible explanation in terms of strong velocity broadening. The new observations in 2007 now provide the opportunity to test that proposal and further explore the properties of the ionised outflow in PG1211+143.
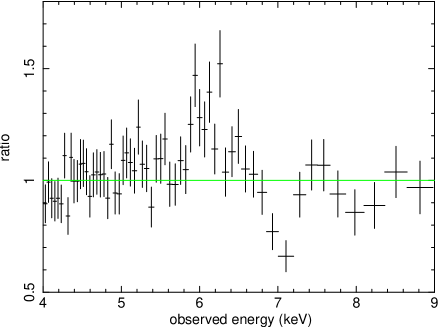
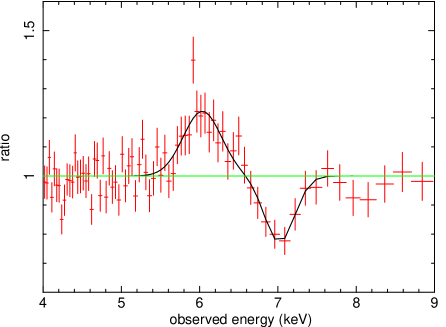
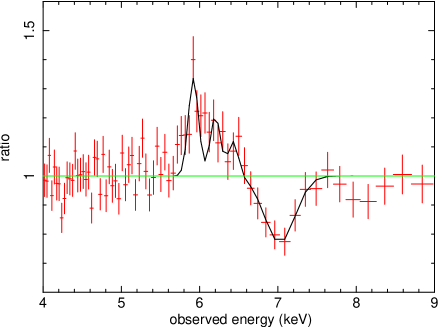
Figure 3 shows the Fe K emission/absorption profiles from the 2001 pn data and the sum of the two 2007 observations. Each profile is the ratio of observed counts to an underlying continuum modelled by an absorbed power law over the 3-10 keV band. The data have been binned to minima of 50 and 100 counts, respectively, to improve the statistics in the highest energy channels. While the overall profiles in figure 3 are similar, with significant emission to the low energy side of the 7 keV absorption line in both data sets, the statistical quality of the individual profiles is clearly limited.
Obtaining a better-defined Fe K profile is important as the strength and width of an ionised emission component potentially carries crucial information on the covering factor and collimation of the outflow. That, in turn, is the key to determining the mass rate and mechanical energy in an outflow whose velocity is known. As we are interested in the time-averaged emission to assess the covering factor of the ionised outflow, and noting the essentially constant underlying continuum in the Fe K energy band (figure 1), it should be appropriate to utilise the integrated spectrum from all four XMM-Newton observations. In stacking the data from the different time periods we used a weighted mean response function and adjusted the background scaling factor to account for the actual image areas used to collect individual data sets.
The Fe K profile from the stacked pn data is illustrated in figure 4 and resembles the PCygni profile characteristic of an outflow, with both emission and blue-shifted absorption components now better defined. While integrating the data from four observations, over 6 years, is likely to blur narrow or transient features, the improved statistics should offer a better measure of the average outflow properties.
We analyse the PCygni profile in Section 5. Before that, the spectral model developed in P07 is re-fitted to the stacked data over the whole EPIC band in order to characterise the broad band spectrum and possibly identify the spectral features that could contribute to the Fe K emission/absorption profile.


4 Modelling the overall X-ray spectrum
The spectral model of P07 provided a physically consistent description of the broad band X-ray spectra of PG1211+143 observed by XMM-Newton in 2001 and 2004. It has the form in Xspec of wa(po1*abs1 + g1*em1 + g2*em2 + po2)abs2, with the ‘primary’ power law (po1) modelling the energetically dominant continuum and a steeper continuum component (po2) found to dominate the soft X-ray variability. Photoionised absorption (abs1,2) and emission (em1,2) from highly and moderately ionised gas are modelled with the publicly available XSTAR grid 25, based on the revised treatment of Fe K (Kallman et al.2004). Grid 25 has an assumed turbulence velocity of 200 km s-1 111A higher turbulent velocity would result in lower column densities but would not significantly alter the main results of this analysis and element abundances fixed at solar values (Grevesse and Sauval 1998). Free parameters in fitting the absorption and emission spectra are the ionisation state, column density and apparent redshift, the latter being an indicator of the velocity of each photoionised gas component. Line broadening is allowed for in the model fit by convolving a separate Gaussian (g1,g2, modelled by gsmooth in Xspec) with each emission line spectrum.
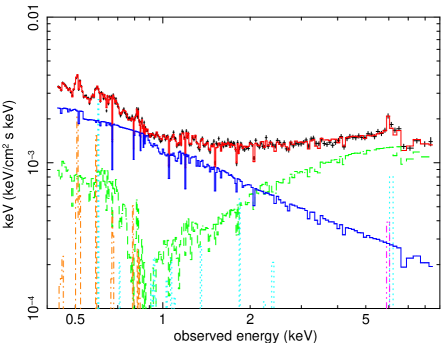
Applying this spectral model to the stacked pn and MOS data, separately, over the whole EPIC band yielded very similar fits, with the principal parameters listed in Table 1. The unfolded spectrum for the pn data is illustrated in figure 5.
The primary power law component (po1) has a photon index of 2-2.1 and is strongly absorbed by moderately ionised gas of column density cm-2 and ionisation parameter log2.0 erg cm s-1. The secondary power law (po2) has a much steeper slope (2.8-2.9) and is affected only by the more highly ionised absorber.
| 1 | 2 | log | redshift | log | redshift | /dof | |||
|---|---|---|---|---|---|---|---|---|---|
| pn | 2.090.09 | 2.920.02 | 7.8 | 2.040.02 | 0.0220.001 | 82 | 3.370.01 | -0.0260.004 | 548/478 |
| MOS | 2.030.10 | 2.780.04 | 7.7 | 2.030.03 | 0.0100.001 | 90 | 3.360.01 | -0.0240.01 | 398/354 |
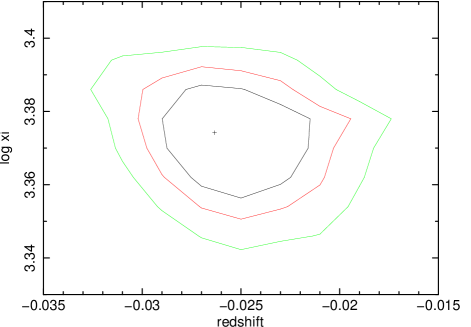
The highly ionised absorber has a well constrained ionisation parameter in both pn and MOS fits, with log 3.4 and a large column density NHcm-2. The ‘apparent redshift’ is -0.026, implying the absorbing gas is strongly blue-shifted in the rest frame of PG1211+143. As the redshift measure is dependent on the primary line identification (and hence ionisation parameter) in the modelling, these important parameters are not independent. To explore this dependence we obtained confidence contours for the ionisation parameter and redshift of the highly ionised absorber component with all other model parameters free. Figure 6 shows the outcome of this check, confirming an ionisation parameter of log 3.37 and apparent redshift of -0.0250.005. Converting apparent redshift to the rest frame of PG1211+143 gives an outflow velocity for the highly ionised gas of 0.0990.005c. The precision of this velocity measure, which derives from fitting to the strong Fe XXV line and an array of co-moving absorption lines best seen in the 2001 data (Pounds and Page 2006), is probably misleading given the assumption of a unique ionisation parameter for the fast outflow.
The model fit for the moderate ionisation absorber yielded an apparent redshift of 0.020.01 and a significantly lower outflow velocity of 0.060.01c. 222For ionisation parameters in the range log 1.8-2.4 the XSTAR models predict inner shell (1s-2p) absorption at 6.5 keV from FeXVIII-XXIII (Behar and Netzer 2002). For an outflow velocity of 0.06c this feature would be observed at 6.3 keV in PG1211+143. Intriguingly, figure 7 does show a small dip at 6.350.05 keV, although this is not statistically significant in the present data
The photoionised emission spectra were found to have ionisation parameters of log3.2 and log1.2, both with apparent redshifts of 0.080.01, indicating a low mean velocity relative to the AGN. Importantly, the coincidence of absorption and emission ionisation parameters for the fast outflow implies these are from the same flow component. In contrast, significant re-emission from the moderately ionised gas was not required in the spectral fit, suggesting it has a small emission measure.
Importantly, strong broadening of the high ionisation emission lines is implied by the parameter g1, for which a value 340180 eV at 6 keV (with constant ) significantly improved the quality of the fit (reducing by 17 for 1 fewer d.o.f.), while allowing the line fluxes to increase by a factor 5. In contrast, the Gaussian broadening parameter for the low ionisation gas, 60 eV, was found to make very little difference to the overall spectral fit.
Visual examination of figure 5 suggests that only the highly ionised gas (light blue in the figure) is likely to contribute significant line emission in the Fe K band, with a strong resonance line of He-like FeXXV (rest energy 6.7 keV). Blue-shifted FeXXV is also identified with the strongest absorption line arising from the highly ionised gas, while the lower ionisation column results in a significant Fe K absorption edge and curvature in the primary (po1) continuum.
It is particularly interesting that the spectral fit requires the highly ionised emission line spectrum to be strongly broadened. Deconvolution of the Fe K profile in the stacked data offers the promise of a direct measure of this broadening in the case of a dominant Fe XXV emission line, thereby providing a key indicator of the geometry of the outflow.
5 Resolving the PCygni profile of Fe K in the EPIC data
Figure 4 shows the profile of Fe K emission and absorption for the stacked pn data, plotted as a ratio to the best-fit continuum. Guided by the broad band model fitted in the previous section, the continuum is modelled over the 3-10 keV band with the form in Xspec wa(zwa*po1 + po2), where zwa allows for absorption of the primary power law at the redshift of PG1211+143. A best-fit continuum was found for power law indices of =2.2 and 2.9, with a cold absorbing column of cm-2. Tests showed these parameters are important in determining the details of the PCygni profile deconvolution, mainly in the deduced line strengths, but do not change the need for two dominant components, one in absorption at 7 keV and a broader emission component at a lower energy.
We initially analysed the PCygni line profile by adding a sequence of positive and negative Gaussians to produce a visual and quantitative fit. The main profile was found to be well fitted by the addition of just 2 lines, both broader than the resolution of the pn camera. Figure 7 shows this fit, with emission and absorption component energies (adjusted to the redshift of PG1211+143) of 6.510.04 keV and 7.650.05 keV, and 1 sigma line widths (which here include 65 eV for the pn resolution) of 21050 eV and 17050 eV, respectively. The statistical improvement by adding these 2 Gaussians is listed, together with the individual component parameters, in Table 2.
Although already a good fit, the emission component in figure 7 has an obvious high data point which lies close to 5.92 keV, which corresponds (at the redshift of PG1211+143) to the 6.4 keV Fe K line, often seen in the spectra of AGN and attributed to fluorescence from low velocity (distant?) cold matter. Adding a third Gaussian to the profile fit, with width constrained to the pn energy resolution, gave a further small but significant improvement to the fit, while increasing the energy of the broad emission component to 6.610.08 keV and its width to 26060 eV. The absorption line parameters were essentially unchanged. Figure 8 reproduces this 3-Gaussian fit with parameters summarised in Table 2.
| fit | energy | width | EW | energy | width | EW | energy | width | EW | /dof |
|---|---|---|---|---|---|---|---|---|---|---|
| 1 | 7.600.05 | 0.190.06 | -12030 | 49/3 | ||||||
| 2 | 7.650.05 | 0.170.05 | -11040 | 6.510.04 | 0.210.05 | 15045 | 47/3 | |||
| 3 | 7.650.05 | 0.160.06 | -11045 | 6.610.08 | 0.260.06 | 13545 | 6.4 | 65 | 2510 | 5/1 |
The broad emission component is now consistent with the resonance 1s-2p transition in He-like FeXXV, the same transition as identified in the absorption spectrum in the 2001 data (Pounds and Page 2006). Allowing for the pn camera resolution, an intrinsic emission line width of 25060 eV, or 280007000 km s-1 (FWHM) when interpreted solely in terms of velocity broadening, corresponds to a wide angle outflow of semi-angle 50 ∘. With the reasonable assumption that the FeXXV emission and absorption lines come from the same ionised outflow, the comparable equivalent widths of the two components is further strong evidence for the outflow having a large covering factor.
The significantly narrower absorption line in the stacked data constrains the effects of velocity variations and (unknown) turbulence, while also ruling out a significant change in the ionisation state of the highly ionised gas, for example from dominantly FeXXV to FeXXVI. We conclude that the greater broadening of the emission line with respect to the absorption line in the stacked data is most likely due to the spread of projected velocities in a wide angle flow.
To check the robustness of the broad ionised emission line in the stacked data, an alternative fit was tried with 3 narrow lines corresponding to neutral Fe K- (rest energy 6.4 keV), and the resonance emission lines of FeXXV (6.7 keV) and FeXXVI (6.97 keV). The fit was noticeably worse (= 38) than that with the narrow Fe K- plus broad FeXXV emission line (figure 9).

Finally, to confirm the broad emission line is not an artefact of the stacking procedure the 4 pn data sets (figure 12 in the Appendix) were fitted individually. Although less well determined, a broad Fe K emission line is preferred in each individual data set, with widths and line energies consistent, within the errors, with those derived for the stacked data (Appendix, table 4).
In summary, analysis of the Fe K line profile provides evidence for a velocity-broadened emission line at a rest energy consistent with the principal resonance transition of FeXXV. As FeXXV is also identified as the ionisation state in the highly ionised absorber, it is reasonable to interpret the emission component in the PCygni profile with the same outflow. We note that this conclusion, including the emission line broadening, is also consistent with the description of the broad band X-ray spectrum of PG1211+143 in Section 4.
6 A check for consistency in the RGS spectrum
The unfolded spectrum in figure 5 suggests that discrete spectral features might also be visible in the soft X-ray band. If so, the higher resolution of the XMM-Newton RGS could provide a further constraint on the broadening of emission lines from the highly ionised outflow, as H-like ions of O and Ne will co-exist with He-Like FeXXV.
To check this possibility the spectra from all four RGS observations were stacked in the same way as for the EPIC data, and the ratio derived of the background-subtracted data to a best-fit power law (we found 2.9, in agreement with the po2 component in Table 1) over the 14-28 Angstrom band. The data were then re-grouped in 9-channel bins to reduce random noise, giving an effective spectral resolution of 0.1 Angstrom.
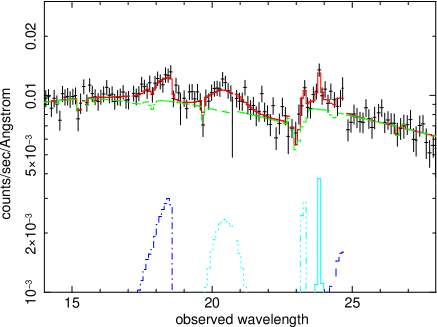
Figure 10 shows the resulting RGS data:continuum spectral ratio and marks the rest wavelengths of the principal emission lines of OVII and OVIII, together with the edge energies of the recombination continua of OVII and NVI. As with the Fe K line profile, Gaussians were fitted to the 3 most obvious emission lines, with wavelength, width and amplitude as free parameters.
Of particular interest is a well-defined - and strong - OVIII Lyman- line, as predicted in figure 5. The Gaussian fitting finds a wavelength of 20.480.08 Angstrom (18.950.08 Angstrom at the redshift of PG1211+143), with a line width of =0.420.08 Angstrom. Interpreted in terms of velocity broadening, the line width corresponds to 140005500 km s-1 (FWHM). While significantly lower than the value found from fitting the FeXXV emission line in the EPIC data, the higher intrinsic resolution of the RGS does hint at a narrower core and broader wings than modelled by the simple Gaussian line. Reference to figure 5 suggests that the narrow core might be due to a contribution from the lower ionisation, lower velocity gas.
The OVII (1s-2p) resonance line is also clearly detected in the stacked RGS data, at 23.220.06 Angstrom (21.480.05 Angstrom), but is significantly less wide than the higher ionisation OVIII line, with =0.160.05 Angstrom. Again, this result is consistent with the narrower Gaussian smoothing factor required for emission from the less ionised gas in the model of figure 5. Also seen in figure 10 is an unresolved line very close to the rest wavelength of the forbidden line in the OVII 1s-2p triplet. We surmise that this emission arises from a low density component of the outflow, presumably at a substantially larger radial distance than the velocity-broadened lines.
Two other spectral features in figure 10 are identified with radiative recombination continua (RRC) of OVII and NVI. Fitting a more appropriate delta function in Xspec yields an electron temperature of 0.030.01 keV for the stronger OVII RRC.
Table 3 lists the parameters of all 5 spectral features identified in the stacked RGS data, giving an overall improvement to the power law fit of = 102 for 15 additional degrees of freedom. Figure 11 shows the contribution of the 5 components to the overall spectrum.
In summary, the stacked RGS data confirm significant photoionised emission in the soft X-ray spectrum of PG1211+143 as indicated in the spectral model of figure 5, and provide further support (particularly from the strength and broadening of the OVIII Lyman- line) for the large covering factor of the highly ionised outflow implied by the strong and broad FeXXV resonance emission in the EPIC data.
| feature | obs.wavelength | lab wavelength | 1 line width | RRC kT (eV) | EW (eV) | / dof |
|---|---|---|---|---|---|---|
| OVII RRC | 17.20.1 | 16.80 | 309 | 12.63.5 | 38/3 | |
| OVIII Lyman- | 18.950.1 | 18.97 | 140003000 | 11.83.8 | 36/3 | |
| OVII 1s-2p (r) | 21.50.1 | 21.60 | 50001600 | 2.41.1 | 11/3 | |
| OVII 1s-2p (f) | 22.050.05 | 22.1 | 1500900 | 1.71.0 | 10/3 | |
| NVI RRC | 22.450.15 | 22.46 | 1510 | 3.72.0 | 7/3 |

7 Discussion
7.1 A persistent high velocity outflow
A significant, but variable strength absorption line has now been observed at 7 keV in 3 of the 4 XMM-Newton observations of PG1211+143, and also in an observation from Suzaku (Reeves et al. 2008). The most recent XMM-Newton observations, reported here, show the sub-relativistic, highly ionised outflow, originally discovered in the 2001 XMM-Newton observation, to be persisting.
Identifying the 7 keV absorption line with FeXXV, as in the initial 2001 spectrum (Pounds and Page 2006), is consistent with the ionisation parameter derived from modelling the broad band stacked data. That model, outlined in Section 4, finds a mean velocity for the highly ionised outflow of 0.10c, from both pn and MOS fits. Gaussian fitting to the Fe K profile in Section 5 finds a slightly higher absorption line energy, and implied outflow velocity of 0.12c. In the following discussion we assume a mean outflow velocity for the stacked data of 0.11c.
Evidence for actual variability in the outflow velocity is offered by the absorption component being broader in the stacked data than in the initial observation of 2001. On that interpretation the measured width of =16060 eV, or 14560 eV allowing for the pn resolution, corresponds to a velocity spread of 0.02c.
The persistence of the blue-shifted absorption over a 6 year period suggests, unless the flow is highly collimated or recombination times very short, that we should expect to find evidence for an extended region of re-emission integrated over the outflow. Detecting broad and strong emission lines of FeXXV and OVIII from the same highly ionised gas now provides confirmation of that expectation and provides the key information lacking in previous observations of high velocity outflows, namely the covering factor. In turn, the covering factor allows the actual mass and energy in the flow to be quantified.
7.2 An energetically important outflow
We now combine the fitted parameters for the stacked data from Sections 4, 5 and 6 to re-assess the structure and hence the wider significance of the fast outflow in PG1211+143.
We have 3 ways of assessing the flow geometry or covering factor of the highly ionised gas. The most direct is to compare the strength of the FeXXV absorption and emission components in the PCygni profile. The similar equivalent widths of the main absorption and emission components in the FeK profile deconvolution in Section 5 indicates a covering factor CF1 if the emission is simply from resonance line absorption and re-emission (scattering). While this estimate is subject to some uncertainty due to the different timescales of the absorption and emission measures, and to the density-dependance of an additional recombination emission component, a highly collimated flow is strongly ruled out, with a conservative CF0.5.
A second estimate of the CF can be obtained, as in P07, by comparing the total continuum energy absorbed and re-emitted by the highly ionised gas components in modelling the stacked broad band EPIC data. For the pn data we find the luminosity of the highly ionised line emission spectrum to be 4.3 erg s-1 while the energy absorbed from the continuum by the highly ionised gas is 1.3 erg s-1, yielding a CF0.33. The corresponding quantities in the MOS spectral fit are 9.8 erg s-1 and 1.7 erg s-1 giving a CF0.57. While these estimates are derived from a rather complex model, we believe they are reliable to a factor 2.
The third signature of flow geometry is from the observed emission line widths. In that respect it is significant that an acceptable fit to the broad band EPIC data required the highly ionised emission lines to be broad. Only by including the Gaussian broadening parameter in the spectral fitting was the emission line spectrum allowed to increase in strength to match the spectral structure in the data. For the pn data in Section 4 we found a Gaussian width of 340180 eV (at 6 keV), consistent with the value 25060 eV derived from the line profile fitting in Section 5. (We recall the emission line component in the Fe K profile in a 2005 Suzaku observation of PG1211+143 appears very similar to that in the stacked XMM-Newton data, with a mean energy of 6.5 keV and width of 250eV (Reeves et al. 2008)). Assuming a Gaussian width of 25060 eV and the assumption of velocity broadening in a radial flow then corresponds to a flow cone of half angle 50 ∘ and CF 0.3.
Importantly, all the above indicators show the highly ionised outflow is not highly collimated, and therefore involves a significant mass loss. The mass outflow rate in a uniform radial outflow of velocity v is given by = 4bnr2mpv, where b is the covering fraction, n is the gas density at a radial distance r, and mp is the proton mass. We obtain nr2 (= Lion/ ) from the broad-band model of Section 4 which has a relevant ionising X-ray luminosity L(7 keV) of 2 erg s-1 and an ionisation parameter (=L/nr2)2350, yielding nr2 cm-1. For a mean velocity of 0.11c, the mass loss rate is then = gm s-1 ( yr-1).
Assuming from the above estimates a value of b=0.4, we find an average outflow mass rate over the four XMM-Newton observations of yr-1. This compares with = 1.6 yr-1 for a non-rotating supermassive black hole of mass (Kaspi et al. 2000) accreting at an efficiency of 10%. The average mechanical energy in the fast outflow is then of order erg s-1.
7.3 A continuum driven outflow from a super-Eddington AGN
King and Pounds (2003), hereafter K03, described a simple model in which black holes accreting at or above the Eddington rate can drive winds which are, at small radii, Compton thick in the continuum. It seems likely that this mechanism is responsible for the highly ionised outflow in PG1211+143, as the line driving favoured to explain outflows in BAL is ruled out for such highly ionised gas.
The assumption in K03 is that the matter decouples from the photons at the boundary of the Compton thick flow (the photosphere) and is launched with an outflow velocity equal to the escape velocity at that radius . Here we have v0.11c, which corresponds to (where is the Schwarzschild radius), or cm for PG1211+143. The EPIC data show significant flux variability on timescales of 2-3 hours (figure 1 in Pounds et al. 2003), which would be compatible with the above scale size relating to the primary (disc/corona) X-ray emission region.
An important prediction of the Black Hole Winds model of K03 is that the outflow momentum will be simply related to the Eddington luminosity, viz /c, an equivalence that can be tested for PG1211+143. Using the mass rate and velocity for the stacked data we have .v = and, for an AGN mass of (Kaspi et al. 2000), /c = - in reasonably good agreement with the continuum driving model.
The location and structure of the lower ionisation absorber, responsible for most of the continuum absorption in our model, is unclear. The lower velocity indicated by our spectral fitting suggests a separate flow component. With an imprint only on the primary continuum, it seems that this log2 matter exists close to the inner accretion disc, while the absence of substantial line emission from that matter implies a small emission measure, possibly constrained in small, higher density clouds (e.g Risaliti et al. 2005). This possibility could be tested for PG1211+143 by more extended observations to constrain the timescale on which the primary continuum absorption is seen to change.
In an extension of the model of K03, a possible scenario might be where an inhomogeneous flow accretes through the inner disc to a radius R where radiation pressure causes the matter to be launched at the local escape velocity. As the outflow expands outward the mean density will fall, as will the filling factor of the cooler, more opaque, matter.
In conclusion, we suggest that the unusual properties of PG1211+143 (at least among local AGN) are due to a super-Eddington accretion rate, a condition expected to apply to galaxies in their rapid growth phase. In that sense PG1211+143 might be described as a late developer. However, we note that if the current outflow rate is maintained for years, the mechanical energy of ergs carried into the host galaxy would exceed the binding energy for a typical galactic bulge containing stars with a velocity dispersion of 300 km s-1.
8 Summary
(1) New XMM-Newton observations of PG1211+143 in 2007 have found the sub-relativistic outflow of highly ionised gas first seen in 2001 to be persisting.
(2) Stacking all existing EPIC data has shown a classical PCygni line profile to describe the emission and absorption components in the Fe K band. Deconvolving those components finds a broad emission line close to the rest energy of the resonance line of FeXXV, the principal ionisation state previously identified in the high velocity absorption spectrum.
(3) Interpreting the emission line width in terms of velocity broadening indicates the fast outflow is occurring over a wide cone, while the large equivalent width of the FeXXV emission line is further direct evidence of a strong and persistent outflow of highly ionised gas.
(4) Re-fitting the broad-band spectral model of Pounds and Reeves (2007) to the stacked data allows the time-averaged absorption and re-emission by the high ionisation gas to be quantified, yielding a separate estimate of the covering factor of the fast outflow, of0.3-0.6.
(5) These X-ray data provide the clearest evidence to date of an AGN outflow carrying sufficient mechanical energy to disrupt starburst growth and provide the predicted coupling of the growth of a supermassive black hole and the host galaxy.
(6) We suggest that PG1211+143 is a rare example of a bright, low redshift, type 1 AGN accreting at the Eddington limit.
Acknowledgements
The results reported here are based on observations obtained with XMM-Newton, an ESA science mission with instruments and contributions directly funded by ESA Member States and the USA (NASA). The authors wish to thank Valentina Braito for re-extracting the earlier PG1211+143 spectra and the SOC and SSC teams for organising the XMM-Newton observations and initial data reduction.
References
- [1] Arnaud K.A. 1996, ASP Conf. Series, 101, 17
- [2] Behar E., Netzer H. 2002, ApJ, 570, 165
- [3] Cappi M. 2006, Astron. Nachrichten, 327, 1012
- [4] den Herder J. et al. 2001, A&A, 365, L7
- [5] Done C., Sobolewska M.A., Gierlinski M., Schurch N.J. 2007, MNRAS, 374, L15
- [6] Elvis M. 2006, Mem. della Soc. Astron. Italiana, 77, 573
- [7] Ferrarese L., Merritt D. 2000, ApJ, 539, L9
- [8] Gebhardt K. et al. 2000, ApJ, 539, L13
- [9] Grevesse N., Sauval A.J. 1998, Space Sci. Rev., 85, 161
- [10] Kallman T., Palmeri P., Bautista M.A., Mendoza C., Krolik J.H. 2004, ApJS, 155, 675
- [11] Kaspi S. Smith P.S., Netzer H., Maoz D., Jannuzi B.T., Giveon U. et al.. 2000, ApJ, 533, 631
- [12] Kim M., Peng C.Y., Barth A.J., Im M., Mertini P., Nelson C.H. 2008, ApJ, 688, 159
- [13] King A.R., Pounds K.A. 2003, MNRAS, 345, 657 (K03)
- [14] King A.R. 2003, ApJ, 596, L27
- [15] Marziani P., Sulentic J.W., Dultzin-Hacyan D., Clavani M., Moles M. 1996, ApJS, 104, 37
- [16] Miller L., Turner T.J., Reeves J.N., George I.M., Kraemer S.B., Wingert B. 2007, A&A, 463, 131
- [17] Murphy E.M., Lockman F.J., Laor A., Elvis M. 1996, ApJS, 105, 369
- [18] Pounds K.A., Vaughan S. 2000, New Astron. Rev., 44, 431
- [19] Pounds K.A., Reeves J.N., King A.R., Page K.L., O’Brien P.T., Turner M.J.L. 2003, MNRAS, 345, 705
- [20] Pounds K.A., Reeves J.N., Page K.L., O’Brien P.T. 2004, ApJ, 616, 696
- [21] Pounds K.A., Page K.L. 2006, MNRAS, 372, 1275
- [22] Pounds K. A., Reeves J.N. 2007, MNRAS, 374, 823 (P07)
- [23] Reeves J.N. et al. 2008, MNRAS, 385, 108
- [24] Risaliti G., Bianchi S., Matt G., Baldi A., Elvis M., Fabiano F., Zezas A. 2005, ApJ, 630, L129
- [25] Sobolewska M.A., Done C. 2007, MNRAS, 374, 150
- [26] Strüder L.et al. 2001, A&A, 365, L18
- [27] Tremaine S. et al. 2002, ApJ, 574, 740
- [28] Turner M.J.L et al. 2001, A&A, 365, L27
- [29] Vaughan S., Fabian A.C. 2004, MNRAS, 348, 1415
9 Appendix
Implicit in using the stacked spectral data to determine the energy, width and strength of the emission and absorption components of the Fe K PCygni profile is an assumption that the derived parameters are a true representation of the time-averaged values. In particular it is important to confirm that the broad ionised emission line is not an artefact of the stacking procedure.
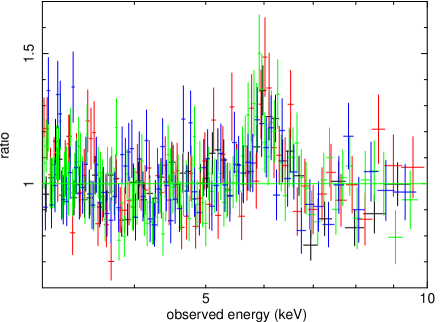
The ratio of each pn data set individually modelled to an absorbed power law in the energy band 3-10 keV is shown in figure 12. Absorption and emission lines were then added to each data set, with line energy, width and flux free, and a new best fit obtained in each case. Table 4 below shows the results. Although some individual parameters are not well constrained, and the absorption line is not formally detected in observation 2, the results are consistent with those from the stacked data. A broad emission line is preferred in each individual data set.
| fit | absorption line energy | width | EW | emission line energy | width | EW | /dof |
|---|---|---|---|---|---|---|---|
| obs 1 | 7.620.05 | 0.060.03 | -9530 | 6.630.08 | 0.330.10 | 13545 | 48/6 |
| obs 2 | - | - | - | 6.590.07 | 0.250.07 | 9545 | 24/6 |
| obs 3 | 7.590.07 | 0.100.06 | -13045 | 6.580.08 | 0.380.08 | 16065 | 47/6 |
| obs 4 | 7.510.15 | 0.250.15 | -10080 | 6.450.17 | 0.460.36 | 11065 | 14/6 |
For the RGS data, where we found evidence for a broad emission line of OVIII, the simultaneous detection of narrow lines of OVII provides direct support for the robustness of the stacking procedure. Again, as for the Fe XXV emission line, the large equivalent width of the broad OVIII emission line is incompatible with a highly collimated outflow.