100–109
The Ages of Stars: The Horizontal Branch
Abstract
Horizontal branch (HB) stars play a particularly important role in the “age debate,” since they are at the very center of the long-standing “second parameter” problem. In this review, I discuss some recent progress in our understanding of the nature and origin of HB stars.
keywords:
stars: abundances, stars: evolution, (stars:) Hertzsprung-Russell diagram, stars: horizontal-branch, stars: mass loss, stars: variables: other, Galaxy: formation, (Galaxy:) globular clusters: general, (Galaxy:) globular clusters: individual (M3, M13, NGC 1851), galaxies: dwarf1 Introduction
Horizontal branch (HB) stars have long played a central role in the age debate. These low-mass stars, which burn helium in the core and hydrogen in a shell, are the immediate progeny of the luminous, vigorously mass-losing red giant branch (RGB) stars. Most importantly in the present context, their temperatures depend strongly on their total masses. More specifically, the lower the mass of an HB star, the bluer it becomes, by the time it reaches the zero-age HB (ZAHB). Therefore, the HB morphology in globular clusters (GC’s) is naturally expected to become bluer with age.
It has long been known that the first parameter controlling HB morphology is actually metallicity, with more metal-rich GC’s presenting redder HB’s than their more metal-poor counterparts. Still, Sandage & Wallerstein (1960) first realized, based mainly on the early observations of the GC’s M3 (NGC 5272), M13 (NGC 6205), and M22 (NGC 6656) by Sandage (1953), Arp & Johnson (1955), and Arp & Melbourne (1959), that GC’s with a given metallicity might also present widely different HB types, due to the action of an unknown “second parameter.” We quote from their study:
“… the character of the horizontal branch is spoiled by the two clusters M13 and M22. (…) M13 appear[s] to be metal-rich, whereas the character of the horizontal branch simulates that of the very weak-lined group (M15, M92, NGC 5897). (…) M13 is younger than M2 or M5 (…) Consequently, in addition to chemical composition, the second parameter of age may be affecting the correlations.”
(Note that the sense of the correlation between age and HB morphology suggested by Sandage & Wallerstein is the opposite of what modern studies indicate to be necessary to account for the second-parameter phenomenon.)
It soon became clear that age was not the only possible second parameter candidate. By the early 1970’s, the list of candidates had increased sharply, and already included, in addition to age, the helium abundance and the abundances of the CNO elements (Rood, 1973). While the “age as the second parameter” scenario was to gain an important boost with the work by Searle & Zinn (1978), who noted that HB morphology tends to become redder with increasing Galactocentric distance – which was interpreted as an age effect, with more distant clusters being younger on average, and having possibly been accreted from “protogalactic fragments” of external origin over the Galaxy’s lifetime – many other second parameter candidates have also surfaced over the years. This includes, among others, cluster concentration, total mass, and ellipticity; stellar rotation; magnetic fields; planetary systems; and mass loss on the RGB (see Catelan, 2008, for extensive references).
While it seems clear now that age does play an important role, it has also become evident that it is not the only parameter involved. Indeed, the presence of bimodal HB’s in such GC’s as NGC 2808 have long pointed to the need for other second parameters in addition to age (e.g., Rood et al., 1993). Recent, deep CMD studies have revealed that some of the most massive globulars, NGC 2808 included, present a surprisingly complex history of star formation, with the presence of extreme levels of helium enhancement among at least some of their stars (e.g., Norris, 2004; D’Antona et al., 2005; Piotto et al., 2005, 2007). As noted by these authors, such He enhancement would provide a natural explanation for the presence of hot HB stars in these clusters. High helium abundances also appear to provide a natural explanation for some of the peculiarities observed in the CMD’s and RR Lyrae properties in the GC’s NGC 6388 and NGC 6441 (e.g., Catelan et al., 2006; Caloi & D’Antona, 2007, and references therein).
In the next few sections, we will address some empirical constraints that may be posed on some of these second parameter candidates.
2 Mass Loss in Red Giants
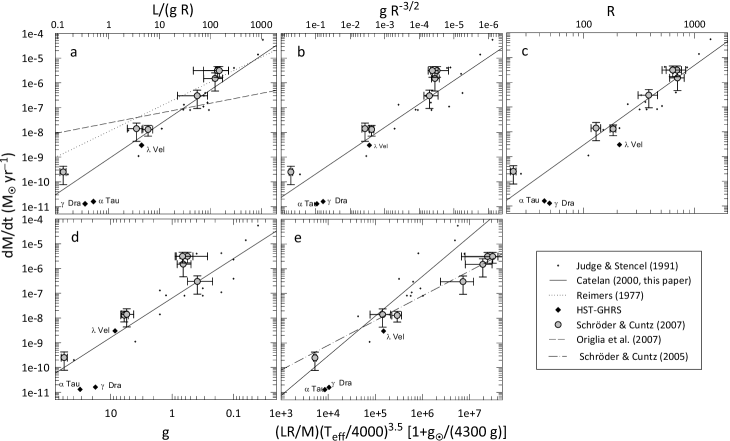
In order to reliably predict the temperature of an HB star of a given composition and age, we must know how much mass it loses on the RGB. Unfortunately, our knowledge of RGB mass loss remains rather limited. Most studies adopt the Reimers (1977) mass loss formula to predict the integrated mass loss along the RGB. However, recent evidence indicates that the Reimers formula is not a reliable description of RGB mass loss (e.g., Catelan, 2000, 2008; Schröder & Cuntz, 2005, 2007). In addition, there are several alternative mass loss formulations which may better describe the available data. We illustrate this point by comparing, in Figure 1, some empirical mass loss rates with the predicted rates from several of these alternative mass loss formulae (see Catelan, 2000, for extensive references). While the Reimers formula is clearly inconsistent with the data, the empirical data cannot conclusively distinguish among these alternative formulations.111Note that, while the Origlia et al. (2007) mass loss formula is inconsistent with the plotted data, this should not be taken as evidence against its validity, since this formula has been suggested to apply exclusively to low-metallicity stars. Still, some caveats regarding the Origlia et al. study have recently been raised (see Boyer et al., 2008).
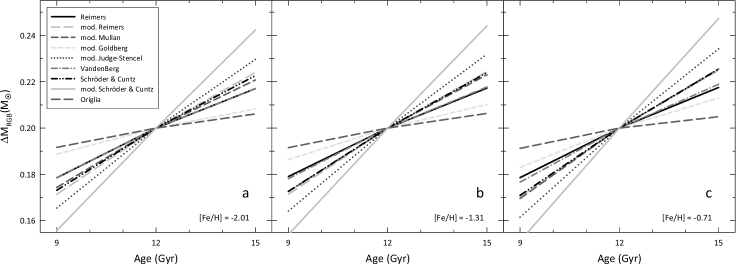
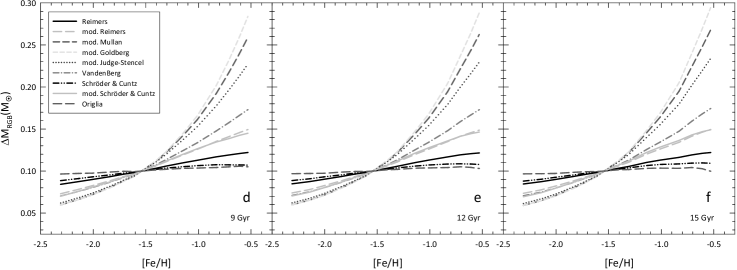
The serious problem which this uncertainty in the RGB mass loss poses for our understanding of HB morphology and its dependence on age and metallicity is apparent from Figure 2, where the integrated RGB mass loss is plotted as a function of the age for fixed metallicity (panels a through c) and as a function of metallicity for fixed age (panels d through f). More specifically, we know that only a very mild dependence can account for the observed relation between HB type and [Fe/H] without resorting to a significant age-metallicity relation (see, e.g., Fig. 1a in Lee et al., 1994). In this sense, we find that the Origlia et al. (2007) and Schröder & Cuntz (2005) mass loss formulae lead to the weakest dependence. All other formulae that we have tested lead to steeper dependencies between and [Fe/H] than the Reimers (1977) relation, thus implying steeper dependencies between age and metallicity as well. The precise dependence between and metallicity is also important in terms of explaining the ultraviolet upturn phenomenon of elliptical galaxies and spiral bulges (see Catelan, 2007, for a recent review).
Similarly, a stronger dependence between and age at fixed [Fe/H] makes it easier to account for a given second-parameter pair in terms solely of an age difference. According to Figure 2, the equation that is most successful in this regard is a modified version of the Schröder & Cuntz (2005) formula, in which the adopted power law exponents are obtained by a least-squares fit to the Judge & Stencel (1991) data, selected as in Catelan (2000) (see Fig. 1e). While not the steepest, the original Schröder & Cuntz formula provides a stronger dependence between and age than does the Reimers (1977) formula, which should reduce the required age difference between second parameter pairs. By contrast, the Origlia et al. (2007) equation shows the weakest dependence, with a remarkably constant integrated value over a wide range in ages.
3 Helium Enrichment in Globular Clusters
As previously noted (§1), high levels of helium enrichment have been detected among some of the most massive Galactic GC’s. Very recently, it has been suggested that such helium enhancements are in fact not the exception, but indeed the rule, among Galactic GC’s (D’Antona & Caloi, 2008). Here we provide a first test of this scenario, in the case of the GC’s M3 and NGC 1851.
3.1 The Case of M3
D’Antona & Caloi (2008) and Caloi & D’Antona (2008) claim that the blue HB component in M3 owes its origin to a moderate level of He enhancement in the cluster, between 2% and 6%. Is this supported by the available data?
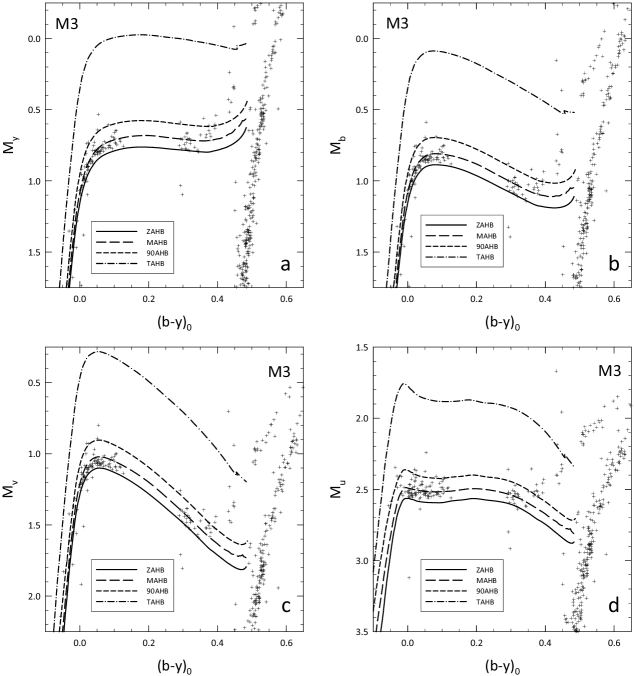
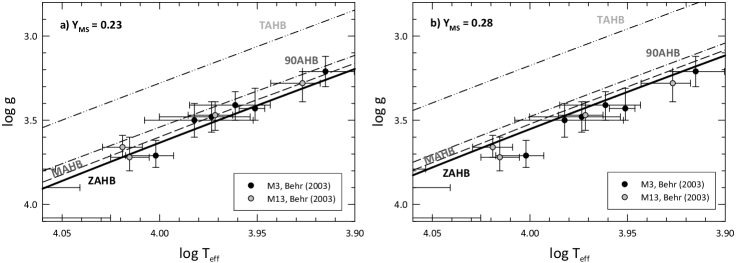
To answer this question, we compare, in Figure 3, canonical theoretical predictions from Catelan et al. (1998) and Sweigart & Catelan (1998) for a helium abundance of and a metallicity with high-precision photometry, in the Strömgren (1963) system, from Grundahl et al. (1998, 1999). The empirical data were corrected for reddening following Harris (1996). In these plots, the drawn lines represent different fiducial loci, as follows: ZAHB, middle-age HB (MAHB, or average locus occupied by the HB stars), 90%-age HB (90AHB, or locus below which one should expect to find about 90% of all HB stars), and terminal-age HB (TAHB, or He exhaustion locus). Except for a discrepancy between the predicted and observed numbers of highly evolved stars (both on the blue and red HB sides of the distribution) that was previously noted by Valcarce & Catelan (2008), one finds remarkable agreement between the model predictions for a constant and the observations. Such an agreement is also confirmed by the spectroscopic data from Behr (2003), as can be seen from Figure 4, where we limit the comparison to temperatures lower than 11,500 K due to the well-known complications brought about by the “Grundahl jump” phenomenon (Grundahl et al., 1999). Interestingly, this plot also appears to support a similar helium abundance between M3’s blue HB stars and the redder blue HB stars in M13.
3.2 The Case of NGC 1851
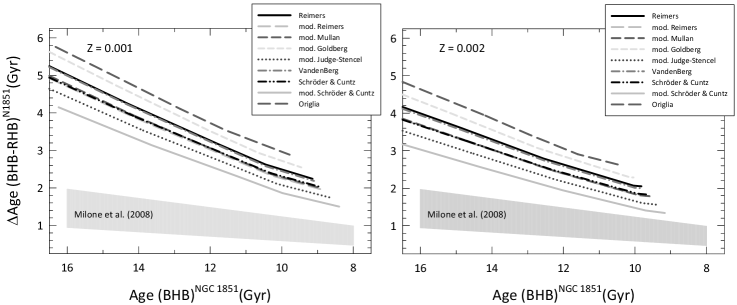
Milone et al. (2008) have recently discovered that the subgiant branch (SGB) of NGC 1851 is actually split into two separate components, which may be linked to the cluster’s well-known bimodal HB morphology. The most straightforward explanation for this split would be a difference in age by Gyr. However, as shown in Figure 5, this is inconsistent with the age difference that would be required to fully account for the separation between the blue and red HB components of the cluster, irrespective of the mass loss formula (§2) used. A difference in metallicity between the two components is also ruled out by recent spectroscopic data (Yong & Grundahl 2008). Here we apply the same CMD test as in the previous section to constrain the possibility of a difference in between the two components as being responsible for the well-known bimodal nature of the cluster’s HB.
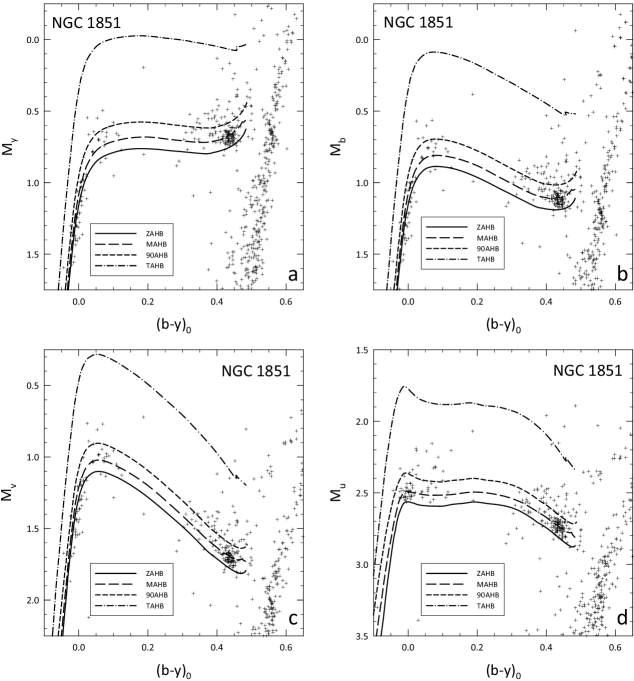
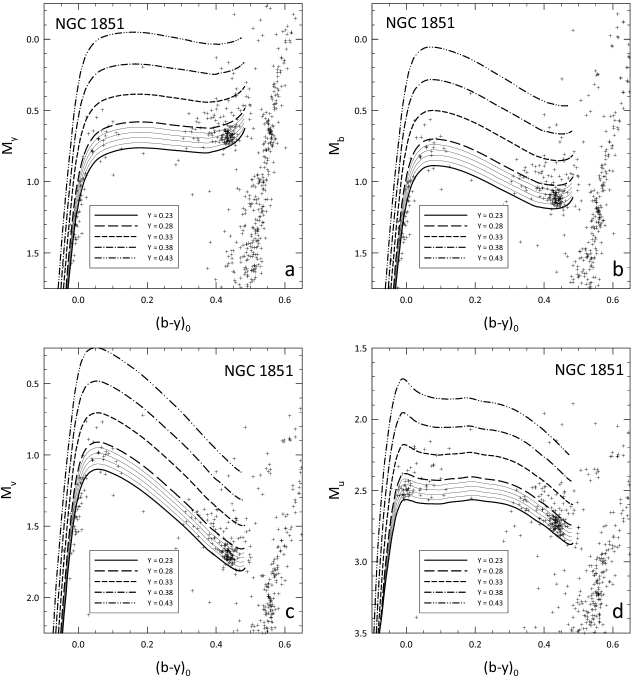
The result is shown in Figure 6. While the quality of the data is not as high as in the case of M3, one is still able to derive some general conclusions. First, the same theoretical ZAHB does appear to provide a reasonable description of the lower boundary of the data, both for the red and blue HB components – which suggests that at least some of the stars on the blue HB have the same as do the red HB stars. Second, there is a predominance of overluminous stars on the blue HB, at colors around . While these might in principle be interpreted in terms of a moderate level of helium enrichment, perhaps of the order of on average (see Fig. 7), the more straightforward explanation is that these stars actually represent the well-evolved progeny of the blue ZAHB stars that are found at higher temperatures. If so, this would again suggest that the late stages of HB evolution are somehow significantly underestimated by present-day HB tracks, similar to what was previously found elsewhere (Catelan et al., 2001; Valcarce & Catelan, 2008, and references therein).
4 The Oosterhoff Dichotomy and the Formation of the Milky Way
Irrespective of our ability to properly model HB stars, we can use RR Lyrae stars to derive entirely empirical constraints on the process of formation of the Milky Way. In the Searle & Zinn (1978) scenario, much like in modern CDM cosmology, one expects galaxies such as our own to have formed by the accretion of “protogalactic fragments” that may have resembled the early counterparts of the Milky Way’s present-day dwarf satellite galaxies. Useful constraints on recent accretion events may be posed by the presence of younger stellar populations in several of these galaxies (Unavane et al., 1996). Still, in order to probe what happened very early on, we must look at the ancient components – and RR Lyrae stars are especially useful in that regard (e.g., Catelan, 2008).
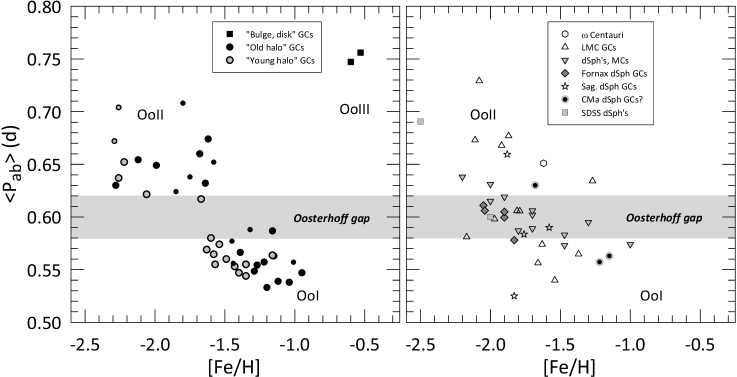
Are the ancient populations in the Milky Way’s dwarf satellites, as traced by their RR Lyrae pulsators, consistent with the Galactic spheroid having been built therefrom? The answer is provided in Figure 8, where we compare the average properties of the fundamental-mode (ab-type) RR Lyrae stars in Galactic (left panel) vs. nearby extragalactic (right panel) GC’s and field populations. While the Galactic distribution clearly presents the so-called Oosterhoff dichotomy, with a tendency for systems to clump around the “Oosterhoff I” (OoI) and “Oosterhoff II” (OoII) regions (see also Miceli et al., 2008, for the case of halo field stars), the opposite happens in the case of nearby extragalactic systems, which tend to be preferentially Oosterhoff-intermediate. This strongly suggests that the oldest components of the Galaxy cannot have been formed by accretion of even the early counterparts of its present-day dwarf galaxy satellites.
As indicated in Figure 8, at least one of the newly discovered SDSS dwarf galaxies (e.g., Belokurov et al., 2006, 2007), CVn I, is Oosterhoff intermediate (Kuehn et al., 2008), whereas the Bootes dwarf is OoII (Dall’Ora et al., 2006; Siegel, 2006). Unfortunately, some of the low-mass SDSS galaxies seem to harbor a mere one or two RR Lyrae stars, which makes it more difficult to assign a conclusive Oosterhoff status to them. Indeed, due to statistical fluctuations, and since the HB lifetime is of order 100 Myr, it is not entirely clear whether the same Oosterhoff types would necessarily be inferred for these galaxies if they were observed, say, a few hundred Myr in the future (which is very little, in terms of Galactic history), when these HB stars will have long left the HB phase, to be replaced by an entirely new generation of HB stars. Still, the present-day properties for several of the RR Lyrae stars that are found in these very low-mass galaxies do appear to be consistent with an OoII status (e.g., Greco et al., 2008).
5 Conclusions
-
•
HB stars play a central role in the age debate. Still, before we are able to predict how (ZA)HB temperature changes with age, we must properly describe RGB mass loss.
-
•
In studies of HB morphology, it is not sufficient anymore to analyze solely the “horizontal” HB morphology, meaning the temperature and/or color distribution of HB stars: “vertical” HB morphology, or the distribution of HB stars in luminosity at fixed temperature (or color), provides us with unique information to help us constrain theoretical scenarios for the origin and evolution of these stars. Indeed, the available data appears to strongly constrain, if not conclusively rule out, the possibility of significant He enhancements among M3’s blue HB stars, while at the same time suggesting that canonical HB models underestimate the duration of the late stages of HB evolution.
-
•
Irrespective of our ability to model them, HB stars – and RR Lyrae in particular – represent invaluable tools to probe into the Milky Way’s early formation history.
Acknowledgments. I would like to warmly thank Gisella Clementini, Frank Grundahl, Bob Rood, Horace Smith, Allen Sweigart, and Aldo Valcarce for useful discussions, comments and suggestions. Support for this work is provided by Proyecto Basal PFB-06/2007, by FONDAP Centro de Astrofísica 15010003, by Proyecto FONDECYT #1071002, and by a John Simon Guggenheim Memorial Foundation Fellowship.
References
- Arp & Johnson (1955) Arp, H. C., & Johnson, H. L. 1955, ApJ, 122, 171
- Arp & Melbourne (1959) Arp, H. C., & Melbourne, W. G. 1959, AJ, 64, 28
- Behr (2003) Behr, B. B. 2003, ApJS, 149, 67
- Belokurov et al. (2006) Belokurov, V., et al. 2006, ApJ, 647, L111
- Belokurov et al. (2007) Belokurov, V., et al. 2007, ApJ, 654, 897
- Boyer et al. (2008) Boyer, M. L., McDonald, I., van Loon, J. Th., Woodward, C. E., Gehrz, R. D., Evans, A., & Dupree, A. K. 2008, AJ, 135, 1395
- Caloi & D’Antona (2007) Caloi, V., & D’Antona, F. 2007, A&A, 463, 949
- Caloi & D’Antona (2008) Caloi, V., & D’Antona, F. 2008, ApJ, 673, 847
- Cassisi et al. (2008) Cassisi, S., Salaris, M., Pietrinferni, A., Piotto, G., Milone, A. P., Bedin, L. R., & Anderson, J. 2008, ApJ, 672, L115
- Catelan (2000) Catelan, M. 2000, ApJ, 531, 826
- Catelan (2007) Catelan, M. 2007, in: New Quests in Stellar Astrophysics II: The Ultraviolet Properties of Evolved Stellar Populations, in press (astro-ph/0708.2445)
- Catelan (2008) Catelan, M. 2008, to appear in Ap&SS(astro-ph/0507464)
- Catelan et al. (2001) Catelan, M., Bellazzini, M., Landsman, W. B., Ferraro, F. R., Fusi Pecci, F., & Galleti, S. 2001, AJ, 122, 3171
- Catelan et al. (1998) Catelan, M., Borissova, J., Sweigart, A. V., & Spassova, N. 1998, ApJ, 494, 265
- Catelan et al. (2006) Catelan, M., Stetson, P. B., Pritzl, B. J., Smith, H. A., Kinemuchi, K., Layden, A. C., Sweigart, A. V., & Rich, R. M. 2006, ApJ, 651, L133
- Dall’Ora et al. (2006) Dall’Ora, M., et al. 2006, ApJ, 653, L109
- D’Antona et al. (2005) D’Antona, F., Bellazzini, M., Caloi, V., Fusi Pecci, F., Galleti, S., & Rood, R. T. 2005, ApJ, 631, 868
- D’Antona & Caloi (2008) D’Antona, F., & Caloi, V. 2008, MNRAS, 390, 693
- Greco et al. (2008) Greco, C., Dall’Ora, M., Clementini, G., et al. 2008, ApJ, 675, L73
- Grundahl et al. (1999) Grundahl, F., Catelan, M., Landsman, W. B., Stetson, P. B., & Andersen, M. I. 1999, ApJ, 524, 242
- Grundahl et al. (1998) Grundahl, F., VandenBerg, D. A., & Andersen, M. I. 1998, ApJ, 500, L179
- Harris (1996) Harris, W. E. 1996, AJ, 112, 1487
- Judge & Stencel (1991) Judge, P. G., & Stencel, R. E. 1991, ApJ, 371, 357
- Kuehn et al. (2008) Kuehn, C., Kinemuchi, K., Ripepi, V., et al. 2008, ApJ, 674, L81
- Lee et al. (1994) Lee, Y.-W., Demarque, P., & Zinn, R. 1994, ApJ, 423, 248
- Mackey & van den Bergh (2005) Mackey, A. D., & van den Bergh, S. 2005, MNRAS, 360, 631
- Miceli et al. (2008) Miceli, A., Rest, A., Stubbs, C. W., et al. 2008, ApJ, 678, 865
- Milone et al. (2008) Milone, A. P., Bedin, L. R., Piotto, G., & Anderson, J. 2008, A&A, in press (astro-ph/0810.2558)
- Mullan et al. (1998) Mullan, D. J., Carpenter, K. G., & Robinson, R. D. 1998, ApJ, 495, 927
- Muñoz et al. (2006) Muñoz, R. R., Carlin, J. L., Frinchaboy, P. M., Nidever, D. L., Majewski, S. R., & Patterson, R. J. 2006, ApJ, 650, L51
- Norris (2004) Norris, J. E. 2004, ApJ, 612, L25
- Origlia et al. (2007) Origlia, L, Rood, R. T., Fabbri, S., Ferraro, F. R., Fusi Pecci, F., & Rich, R. M. 2007, ApJ, 667, L85
- Piotto et al. (2007) Piotto, G., Bedin, L. R., Anderson, J., et al. 2007, ApJ, 661, L53
- Piotto et al. (2005) Piotto, G., Villanova, S., Bedin, L. R., et al. 2005, ApJ, 621, 777
- Reimers (1977) Reimers, D. 1977, A&A, 57, 395
- Robinson et al. (1998) Robinson, R. D., Carpenter, K. G., & Brown, A. 1998, ApJ, 503, 396
- Rood (1973) Rood, R. T. 1973, ApJ, 184, 815
- Rood et al. (1993) Rood, R. T., Crocker, D. A., Fusi Pecci, F., & Buonanno, R. 1993, in: G. H. Smith & J. P. Brodie (eds.), Proc. ASP Conf. Ser., Vol. 48, The Globular Cluster-Galaxy Connection, (San Francisco: ASP), p. 218
- Salaris et al. (2008) Salaris, M., Cassisi, S., & Pietrinferni, A. 2008, ApJ, 678, L25
- Sandage (1953) Sandage, A. R. 1953, AJ, 58, 61
- Sandage & Wallerstein (1960) Sandage, A., & Wallerstein, G. 1960, ApJ, 131, 598
- Schröder & Cuntz (2005) Schröder, K.-P., & Cuntz, M. 2005, ApJ, 630, L73
- Schröder & Cuntz (2007) Schröder, K.-P., & Cuntz, M. 2007, A&A, 465, 593
- Searle & Zinn (1978) Searle, L., & Zinn, R. 1978, ApJ, 225, 357
- Siegel (2006) Siegel, M. H. 2006, ApJ, 649, L83
- Strömgren (1963) Strömgren, B. 1963, QJRAS, 4, 8
- Sweigart & Catelan (1998) Sweigart, A. V., & Catelan, M. 1998, ApJ, 501, L63
- Unavane et al. (1996) Unavane, M., Wyse, R. F. G., & Gilmore, G. 1996, MNRAS, 278, 727
- Valcarce & Catelan (2008) Valcarce, A. A. R., & Catelan, M. 2008, A&A, 487, 185
- Yong & Grundahl (2008) Yong, D., & Grundahl, F. 2008, ApJ, 672, L29