22email: mathias@obs-besancon.fr 33institutetext: Astronomy Department, Ohio State University, Columbus, OH 43210, USA
33email: sellgren@astronomy.ohio-state.edu 44institutetext: IPAC, Caltech, Pasadena, CA 91125, USA
44email: solange@ipac.caltech.edu 55institutetext: Spitzer Science Center, Caltech, Pasadena, CA 91125, USA
55email: stolovy@ipac.caltech.edu 66institutetext: Physical Research Laboratory, Astronomy & Astrophysics Division, Ahmedabad, India
66email: shashi@prl.res.in 77institutetext: South African Astronomical Observatory, PO Box 9, Observatory 7935, South Africa 88institutetext: Osservatorio di Padua, Italy
Interstellar Extinction and Long-Period Variables in the Galactic Center
Abstract
Aims. To derive a new map of the interstellar extinction near the Galactic Center (GC) extending to much higher values of than previously available. To use the results obtained to better characterise the long-period variable star population of the region.
Methods. We take the Spitzer IRAC catalogue of GC point sources (Ramírez et al. 2008) and combine it with new isochrones (Marigo et al. 2008) to derive extinctions based on photometry of red giants and asymptotic giant branch (AGB) stars. We apply it to deredden the LPVs found by Glass et al. (2001) (Glass-LPVs) near the GC. We make period-magnitude diagrams and compare them to those from other regions of different metallicity.
Results. Our new extinction map of the GC region covers 2.0o 1.4o (280 200 pc at a distance of 8 kpc). The Glass-LPVs follow well-defined period-luminosity relations (PL) in the IRAC filter bands at 3.6, 4.5, 5.8, and 8.0 m. The period-luminosity relations are similar to those in the Large Magellanic Cloud, suggesting that the PL relation in the IRAC bands is universal. We use ISOGAL data to derive mass-loss rates and find for the Glass-LPV sample some correlation between mass-loss and pulsation period, as expected theoretically. Theoretical isochrones for a grid of different metallicities and ages are able to reproduce this relation. The GC has an excess of high luminosity and long period LPVs compared to the Bulge, which supports previous suggestions that it contains a younger stellar population.
Key Words.:
ISM: dust, extinction – Galaxy: stellar content – Infrared: stars1 Introduction
The variable stars of the Galactic Center (GC) region are of great interest, both as population and distance indicators. Long-period, large-amplitude variables situated on the asymptotic giant branch (AGB), comprising Miras and OH/IR stars, are the easiest objects to detect thanks to their high luminosities. Thus, they are one of the few stellar populations that can be observed in their entirety towards the GC. As is well-known, in the innermost parts of the Galaxy, surveys are hampered by high interstellar extinction (e.g. Frogel et al. Frogel99 (1999); Schultheis et al. Schultheis99 (1999)); observations must therefore be carried out in the infrared where can be as low as 0.04 for m m (Indebetouw et al 2005). Sensitive surveys at the latter wavelengths have only recently become possible thanks to the Spitzer satellite.
For these reasons, Glass et al. (Glass2001 (2001)) conducted a -band (2.2 m) survey for variable stars covering 24 24 arcmin2 (56 56 pc at a distance of 8 kpc) and centered on the GC in a study spanning 4 years. The majority of the variable sources they found were, as expected, Miras and OH/IR stars with periods ranging from 150 d to about 800 d. Uncertainty as to the foreground extinction unfortunately precluded any detailed comparison of their luminosities with similar populations in other well-studied areas, such as the the solar neighbourhood, the Baade’s Windows and the Magellanic Clouds, where period-luminosity relations have been determined.
The inner Galaxy has also been searched intensively in the radio region for OH sources (see e.g. Lindqvist et al. Lindqvist92 (1992), Sjouwerman et al. Sjouwerman98 (1996), Wood et al. Wood98 (1998), Blommaert et al. Blommaert98 (1998), Vanhollebeke et al. vanhollebeke06 (2006)). From these surveys, it is clear that a number of the large amplitude variables remained undetected in the Near-infrared, owing to the extremely high extinction in some regions. Nevertheless, from OH and SiO observations, (see e.g. Messineo Messineo04 (2004) and Deguchi et al. Deguchi08 (2008)) radial velocities are available for many of these sources, making them extremely valuable for studies of stellar kinematics near the GC.
Because the large-amplitude variables have very high mass-loss rates they also play an important role in the chemical evolution of the Galaxy. It is therefore desirable that they should be characterised as fully as possible.
Previous studies in the near-IR using 2MASS or DENIS data have yielded extinction maps with a typical resolution of several arcmin (see e.g. Schultheis et al. Schultheis99 (1999), Marshall et al. Marshall2006 (2006)). These maps, however, were limited by the sensitivities of the near-IR surveys and are only realistic in regions where is less than 25 magnitudes. Unfortunately, this limit is generally exceeded towards the GC.
In this paper we show that an improved map of the interstellar extinction around the GC can be made by fitting mid-IR data on AGB/RGB stars obtained by the IRAC camera on Spitzer to isochrones (see also Ganesh et al., in preparation). Extinctions have been determined for much more heavily obscured areas than was possible previously, especially towards the GC itself. We apply the new extinction values to a discussion of the long-period variables in the region, concentrating on the period-magnitude relations that they obey in the IRAC bands and their mass-loss rates.
2 The data set
2.1 The Spitzer IRAC Point Source Catalog of the Galactic Center (GALCEN)
The central of the GC have been mapped with Spitzer/IRAC between 3.6 and 8.0 m (Stolovy et al. 2006 and Stolovy et al. 2008, in preparation). Ramírez et al. (2008) performed point-source extraction on the IRAC data and published a confusion-limited catalogue of point sources that also included photometry from 2MASS. The IRAC magnitudes are referred to as [3.6], [4.5], [5.8] and [8.0], corresponding to their central wavelengths. The average confusion limits are 12.4, 12.1, 11.7 and 11.2 magnitudes, respectively, but can vary by 2 or 3 magnitudes within the survey. The whole catalogue (referred to here as GALCEN, see Ramírez et al. 2008 for more details) consists in total of about one million sources. Most of these show the characteristics of red giants or AGB stars, but there are several hundreds of extremely red sources which may be massive Young Stellar Objects (YSOs). A major problem that must be faced in the study of the LPV component is the bright-star limit of the IRAC camera. According to the Spitzer Observer’s Manual (Version 7.1), saturation starts at 7.9, 7.4, 4.8 and 4.8 magnitudes respectively. Saturated sources are however retained in the GALCEN catalogue but if a flux is greater than the limit it is flagged with the number ‘3’ (see Ramírez et al. 2008 for a more detailed discussion). We have excluded photometry with flux flag values of 3 from our analysis.
2.2 GALCEN vs GLIMPSE-II
Recently, the GALCEN IRAC observations have been processed independently by the GLIMPSE-II team (see http://www.astro.wisc.edu/sirtf/docs.html). Different data reduction and source extraction procedures from those of the GALCEN survey were used (see http://www.astro.wisc.edu/glimpse and Benjamin et al. Benjamin03 (2003)). These data were kindly made available to us in advance of publication by the GLIMPSE-II team. As discussed in the online document, they found systematic offsets between the GALCEN and GLIMPSE-II photometry that was larger than the combined uncertainty in both observations, at the bright and faint ends of the observed range. To look for any possible systematic effects on our work we have also calculated the extinction maps that we discuss in Sect. 3 using the GLIMPSE-II results. We find that the differences in the values of the extinctions derived from GALCEN and from GLIMPSE-II are smaller than the uncertainties in the determinations.
The locations of the LPVs in the IRAC colour-colour diagrams, the IRAC colour-magnitude diagrams, and the period-luminosity relations (see Sections 4–5) also differ slightly between the GALCEN and GLIMPSE-II photometry. The GALCEN and GLIMPSE-II photometry differ by 0.05 mag in the mean, with a standard deviation of 0.12 mag, over the brightness range of the LPVs. We find no statistically significant dependence of the difference between the GALCEN and GLIMPSE-II photometry on magnitude, or on the periods of the LPVs (which can be regarded as a proxy for their de-reddened magnitudes). The scatter in this difference, however, is large and we conservatively place a limit of 0.2 mag on any possible variation in its value over the brightness range occupied by the LPVs. Our conclusions in this paper are, however, unaffected by photometric uncertainties at this level.
2.3 Long-Period Variables
The Glass et al. (Glass2001 (2001)) survey covered an area of 24 24 arcmin2 around the GC, as mentioned, and found about 400 periodic variables with Mira-like amplitudes and an average period of 427 d. (Among these are 64 OH/IR stars included in the Wood et al. 1998 sample). We refer to the survey list hereafter as the Glass-LPV catalogue. Compared to the well-explored SgrI Baade’s window of low extinction which lies at and , the GC field contains more than ten times the number of variables per arcmin2. The average period in the SgrI field is much lower, at 333 d. Due to the limited photometric precision of the Glass et al. (2001) survey, small amplitude variables such as semi-regulars were not detected.
2.4 ISOGAL observations
The details of the ISOGAL observational procedure with ISOCAM (Cesarsky et al. Cesarsky96 (1996)) and the general processing of the data are described in Schuller et al. (Schuller2003 (2003)). In this paper we will discuss only the ISOGAL FC field (hereafter called FC), centered at . It was observed with the narrow filters LW5 (6.5–7.1 m) and LW9 (13.9–15.9 m), using 3″ 3″ pixels, in order to avoid saturation. More specific details about this field can be found in Schuller et al. (Schuller2006 (2006)). The parts of the region closest to the GC itself could not be observed by ISOGAL due to saturation problems even when the narrow-band filters were used. Nevertheless, 25% of the Glass-LPV area is overlapped by the ISOGAL survey at 7 and 15 m, mainly towards the south-western corner.
2.5 Cross-identifications
Cross-identification of stellar catalogues in these extremely crowded regions, which are often confusion limited, is a very difficult issue. In order to minimize spurious associations we used the following method when comparing the different catalogues mentioned above. We first calculated the offsets of the 400 brightest sources between a given pair of catalogues and determined the second-order distortion matrix. Following application of the offset and distortion corrections, we made the subsequent cross-identifications using a search radius of 2 arcsec:
-
•
First, we cross-identified the LPVs of Glass et al. (2001) with the GALCEN catalogue. By limiting the GALCEN catalogue to the area covered by the Glass-LPV survey, it was reduced to a total of 46314 sources. Of the 421 LPVs, 410 were found in the GALCEN list (97%). Many of them are, however, saturated, especially at [3.6] and [4.5]. (From the Glass-LPV sample there were 162, 178, 36, and 58 saturated sources at [3.6], [4.5], [5.8], and [8.0], respectively).
-
•
Second, we cross-identified the Glass-LPV catalogue with ISOGAL. We found 183 matches, despite the small overlap.
3 Interstellar extinction
3.1 Derivation of the extinction values
As stated, interstellar extinction remains a serious obstacle to the interpretation of stellar populations in the GC region.
The present work follows the method of Ganesh et al. (in preparation) who recently mapped the extinction towards the inner Bulge with a spatial resolution of 2′. GLIMPSE-II and 2MASS data are compared to the latest isochrones for evolved stars (Marigo et al. Marigo2007 (2008)) in order to derive . Several studies of this type, using only the 2MASS data, have been undertaken before (e.g. Schultheis et al. Schultheis99 (1999), Marshall et al. Marshall2006 (2006)).
In the method of Ganesh et al, colour-magnitude diagrams are constructed within sampling boxes of 2′ square and the amount by which each individual data point has to be de-reddened for it to fall on the isochrone is determined. The extinction values for are derived using the [3.6][5.8] colour, while 2MASS and data are used for .
With the large number of filter combinations available (three from 2MASS and four from GLIMPSE-II) several possible combinations had to be considered. The [5.8] vs. [3.6][5.8] colour-magnitude diagram was selected since it was found to yield the smallest dispersion, i.e. the colour excess was found to be the most suitable one for determining the interstellar extinction (see e.g. Indebetouw et al. Indebetouw05 (2005)). This pair of filters has, in fact, the advantage of simultaneous observations (the other two IRAC colours were observed at different times) and also has better completeness (more stars detected through high extinction). Further, at 3.6 m and 5.8 m, the observed flux is dominated by stellar photospheric emission while at 8.0 m interstellar PAH emission becomes prominent. The models indicate that metallicity effects are negligible in the [3.6][5.8] colour, in contrast to , where the RGB/AGB branch of a metal-rich stellar population shifts to redder colours (Schultheis et al. Schultheis2004 (2004)). For more detailed information see Ganesh et al. (in preparation).
In the following, we took the GALCEN catalogue of Ramírez et al. (Ramirez2008 (2008)) and limited ourselves to stars with and . We have also excluded sources with [3.6]–[4.5] 0.8 and [5.8]–[8.0] 0.5 from our extinction calculation, because sources with these colors are typical of YSOs (see Allen et al. 2004) and the inclusion of their extreme colors would bias the results. We again chose a sampling box of 2′ square in order to get a sufficient numbers of stars for the isochrone fitting. For each sampling box the average extinction value was taken.
The values of that we use to make the extinction maps were derived by using the infrared colour-colour diagram vs. [IRAC] as proposed by Jiang et al. (Jiang03 (2003)), Indebetouw et al. (Indebetouw05 (2005)) and Ganesh et al. (2008). We used the vs. [3.6] and the vs. [5.8] diagrams to determine and . We assumed that most of the sources are luminous RGB stars or AGB stars with moderate mass-loss and similar intrinsic colours. We further adopted the values and as used by Schultheis et al. (Schultheis99 (1999)). Fitting straight lines in these diagrams gives us the following values: and . These values were determined using the whole GALCEN catalog. Ganesh et al. (2008) will discuss more in detail how the extinction coefficients vary with different line of sights using the whole GLIMPSE-II dat set. Our value agrees within the errors with those from Indebetouw et al. (2005), Lutz (1999), Flaherty et al. (Flaherty07 (2007)) and Román-Zúñiga et al. Roman07 (2007), while our derived is a litte bit lower, but still lies inside the errors of the quoted authors.
Lutz et al. (1996) and Lutz (1999) measured a flat mid-IR extinction curve towards the GC. However Flaherty et al. (Flaherty07 (2007)) and Román-Zúñiga et al. Roman07 (2007) have shown that extinction coefficents may vary somewhat depending in which line of sight one is looking (e.g. especially towards star forming regions). Recently, Chapman et al. (2008) have also studied the mid-infrared extinction law in three molecular clouds and found that as the overall extinction increases, the curve flattens out. The coefficients evidently vary according to whether the dust is located in the general ISM or in dense molecular clouds.
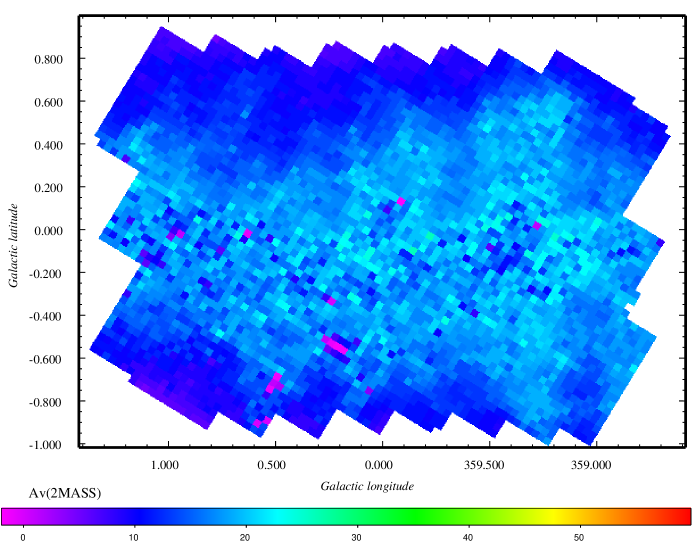
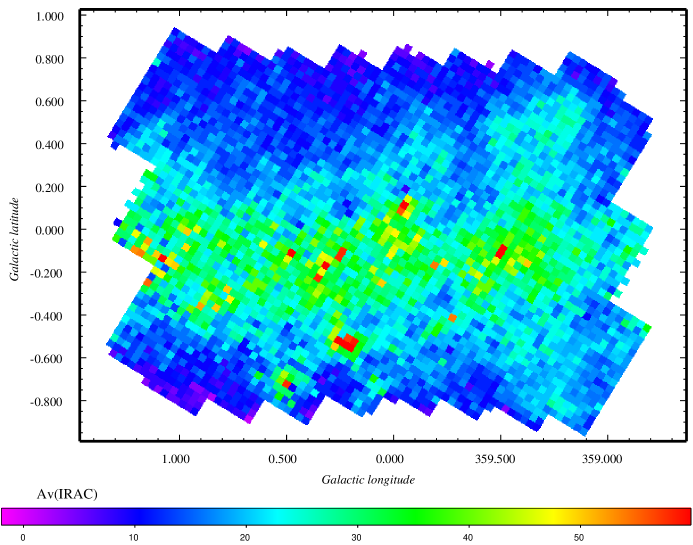
Figure 1 shows the map derived from the 2MASS filters (upper panel) and that from the IRAC [3.6] and [5.8] filters of GALCEN (lower panel). There is a great similarity in the overall distribution of the two extinction maps. Where 2MASS gives lower limits for the extinction or is unable to probe the extinction due to lack of sources, the GALCEN extinction map exhibits high values for the extinction (). Within Figure 1 there are regions of low extinction according to the 2MASS data but which are seen to have very high extinction when looked at by IRAC (e.g. the region around and ). These areas are mostly associated with infrared dark clouds. 2MASS gives artificially low values of extinction in such cases because it detects only those stars located in front of the dark cloud whereas IRAC penetrates to much greater depth.

Since the – colour is less than – , for a given amount of reddening the precision it yields in is not as high. The loss of accuracy at low can, however, be avoided by using the near-infrared derived values for mapping when they are available. At larger , the results from the and map are, of course, to be preferred.
Different ages or metallicities for the Bulge population do not significantly affect the mid-infrared colours of RGB stars, as will be seen. The sequences in the sampling fields are well defined in the case of low extinction while there is some scatter when it is high. This scatter arises from variable extinction on small scales within the Bulge and along the line of sight. Towards regions with very high extinction ( 60), the number densities in the CMD can drop significantly due to the loss of the fainter stars. Such points have relatively large errors.
Figure 2 compares the extinction values derived from and 2MASS data and those derived from the IRAC colours. There is a tendency towards a linear relation between (2MASS) and (IRAC) up to with a dispersion of 3. For higher values, 2MASS can no longer detect the most reddened stars at the GC and is biased towards less reddened foreground stars. For those regions where 2MASS gives low values and IRAC high ones, different optical depths are obtained. The values of derived from are representative of the foreground population rather than the regions hidden by high extinction, while the IRAC bands relate to stars that are deeper within the clouds.
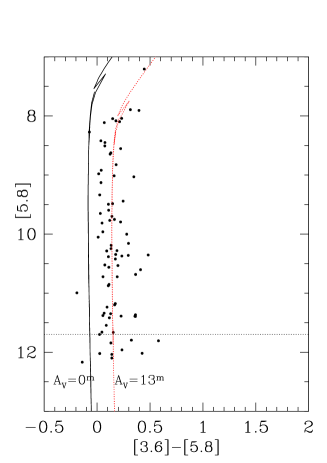
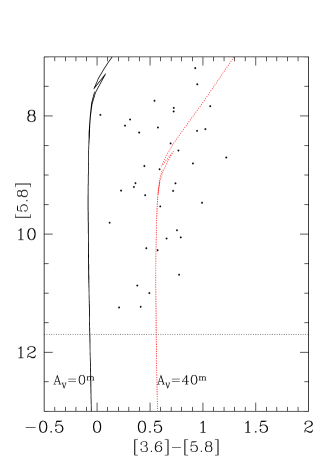
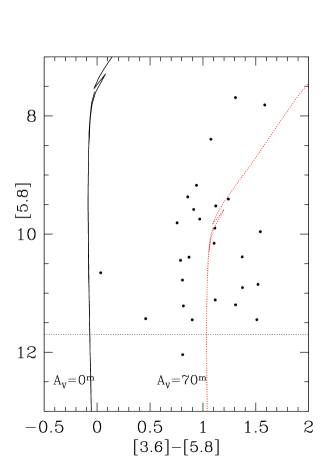
Figure 3 shows the CMDs towards three regions of different extinction in the GALCEN survey. While for the low extinction field (left panel) the red giant branch is well defined and the dispersion is low, the CMD is more scattered in the high extinction regions. Despite the high extinction, however, we get a sufficient number of sources to determine .
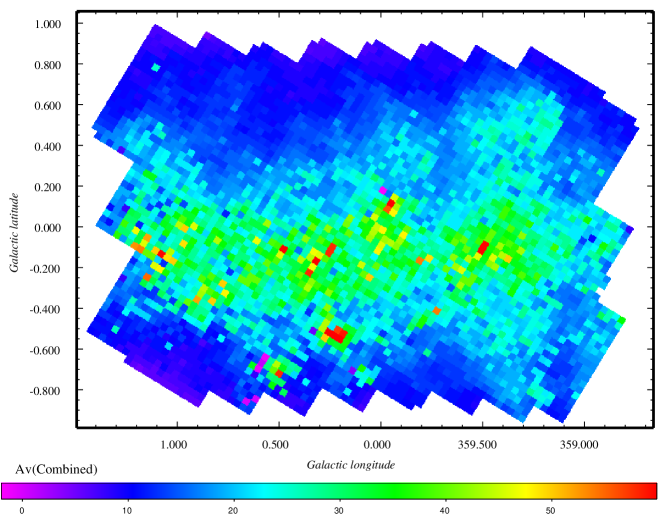
3.2 The combined extinction map
Figure 4 shows the combined extinction (2MASS and IRAC) map as well as an intrinsic uncertainty map derived from the isochrone fitting. As explained before, for the 2MASS colour was used, while for the IRAC [3.6][5.8] colour was used. The highest values we can detect correspond to about . These are mostly associated with clouds that are dark even in the infrared.
We will provide in electronic form (at CDS) the three extinction maps as well as the error map in the form of individual FITS files.
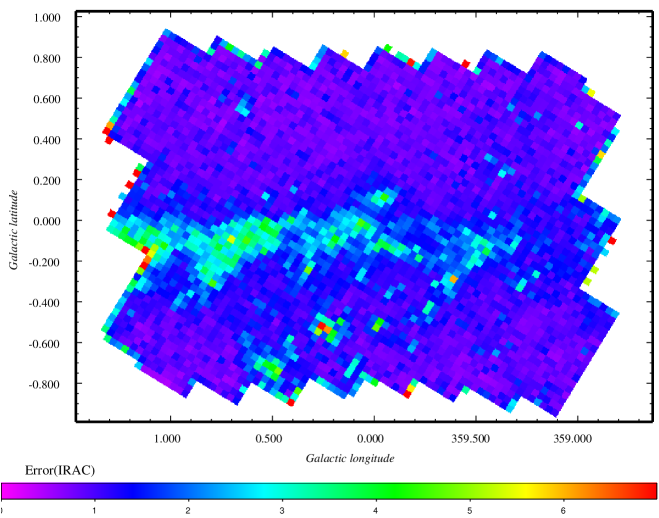
3.3 The uncertainty map
The intrinsic uncertainty map corresponding to the combined interstellar extinction map is shown in Fig. 4 (lower panel). The uncertainty map is calculated as the standard deviation of the distribution. For the intrinsic uncertainty is about 2-3 mag while for it can go up to 6-7 mag. Figure 5 shows the comparison between our determinations based on GALCEN and on the GLIMPSE-II catalogue (see also Sect. 2.2). Despite the differences found in the photometry between these two pipelines, no systematic offset is found between derived from GALCEN and derived from GLIMPSE-II. The typical r.m.s standard deviation between GALCEN and GLIMPSE-II is 6 mag in which is the overall uncertainty in the derived extinction map. For very high ( 40), the differences between GALCEN and GLIMPSE become larger. Howver, for those regions the CMD is less well defined and the intrinsic uncertainty increases (see Fig. 4).
It should be noted that Nishiyama et al. (Nishiyama06 (2006)) found that the behaviour of near-IR extinction varies slightly though significantly from one direction to another near the GC so that there is no universally valid extinction law for the region. These results were confirmed by Bandyopadhyay et al. (Bando08 (2008)). Variations with direction of in the IRAC bands do not appear to be significant at the accuracy that is currently available, at least in the fields studied by Indebetouw et al (2005) and Ganesh et al. (in prepration).

Gosling et al. (Gosling06 (2006)) found complex small-scale structure in the infrared extinction towards the GC, with a typical size of 5–15″, corresponding to 0.2–0.6 pc. They demonstrated that significant granularity appears to be present in high and variable extinction fields, indicating that extinction at and may have significantly higher values on smaller scales than those previously derived for the GC as a whole.
4 The Long Period Variables near the Galactic Center
In the remainder of this work we discuss the long-period variables of the Galactic Center region. Figure 7 shows the 2MASS image of the GC region at . The known LPVs of Glass et al. (2001) are superimposed and are bright in . We note that patchy and filamentary dark clouds (appearing white in Fig. 7) often vary on size scales smaller than the 2′sampling boxes used here to calculate the extinction. This can contribute to the photometric errors in the extinction correction towards individual sources.
4.1 Stellar isochrones
The newest set of isochrones for the RGB/AGB phase include an improved treatment of the thermally pulsing asymptotic giant branch (TP-AGB) phase (Marigo et al. Marigo2007 (2008)). These isochrones predict realistic tracks for the TP-AGB, taking into account mass-loss and pulsation. The whole of TP-AGB evolution is now treated in a realistic way, especially the crucial effects of the third dredge-up, hot bottom burning and variable molecular opacities.
The dust models incorporated in these isochrones are an extension of the work by Groenewegen (Groenewegen06 (2006)). They have been calculated with a 1-dimensional dust radiative transfer code that solves the radiative transfer equation and the thermal balance equation in a self-consistent way.
The main physical inputs to the model are the luminosity, distance, photospheric spectrum, mass-loss rate, dust-to-gas ratio, expansion velocity, dust condensation temperature and composition of the dust. For oxygen-rich stars two main species of dust are considered: aluminium oxide () and silicate dust. Blommaert et al. (Blommaert06 (2006)) studied the CVF ISOCAM spectra of a sample of AGB stars with low mass-loss in the Galactic bulge and found that the dust content is dominated by grains.
Isochrones for different metallicities, Z=0.008, Z=0.019 and Z=0.038, and ages between 0.5 and 10 Gyr, have been calculated for the Spitzer IRAC filters. In the present work, we consider the isochrones placed at the distance to the GC (8.0 kpc, Reid Reid1993 (1993)).
4.2 LPVs in the Spitzer colour-magnitude and colour-colour diagrams
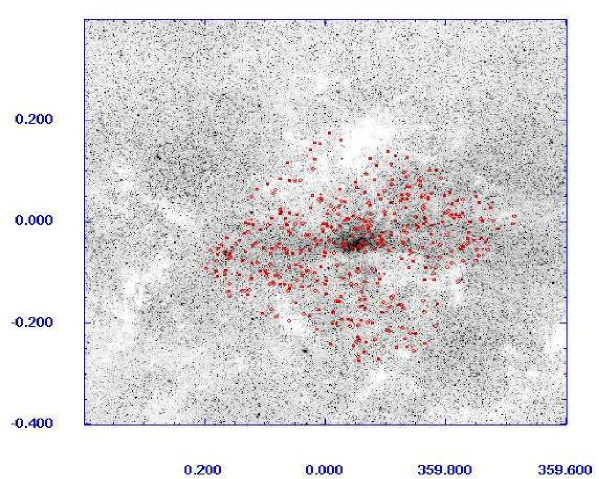
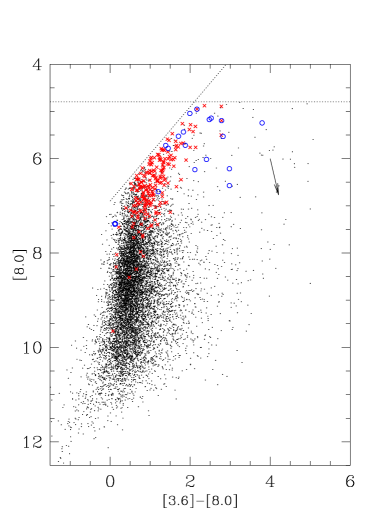
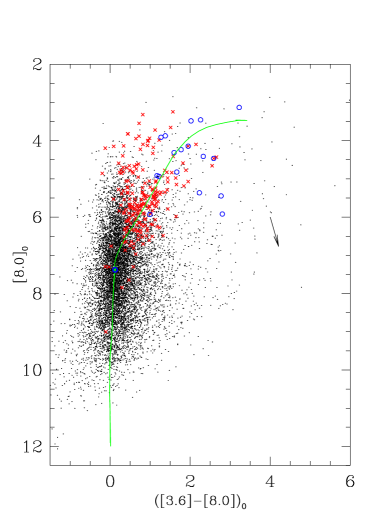
Figure 8 (left panel) shows the [3.6][8.0] vs [8.0] diagram. Indicated are also the approximate saturation limits at [3.6] and [8.0]. In total, only 248 known LPVs have reliable (unsaturated) IRAC photometry. On the right panel of Fig. 8, the dereddened [3.6][8.0] vs [8.0] diagram, derived using the extinctions given in Fig. 4, shows clearly that the locus of the known AGB stars is above the RGB tip (). As can be seen, the isochrones of Marigo et al. (2008) are a good fit to the dereddened CMD. This agreement confirms the correctness of the derived extinctions. The locations of the isochrones change only marginally with age and/or metallicity (e.g. from 1 to 10 Gyr and in these bands. The AGB stars show a large scatter in this diagram due to strong variability (we only have single-epoch measurements) and also to the infrared excesses arising from heavy mass-loss (see Sect. 6). A similar diagram can be drawn for LPVs at [4.5] where we find only 84 AGB variables to be unsaturated.
4.2.1 Comparison with Spitzer observations of LMC LPVs
Cioni et al. (Cioni01 (2001)) examined a field of about 0.5 square degrees around the optical center of the Large Magellanic Cloud. Light curves in the EROS V and R bands were obtained for 334 variables, most of which are of long period (including Miras and semiregulars). In addition they obtained spectroscopy of about 100 AGB variables whose visible spectra were classified as carbon- or oxygen-rich. We used their sample of known AGB stars and cross-identified their catalogue with the SAGE (Surveying the Agents of a Galaxy’s Evolution) MIPS and IRAC imaging survey (Meixner et al. Meixner06 (2006)). In the latter work, a field of 7 sq degrees of the LMC was surveyed between 3.6 and 160 m. In total, 331 objects were found in the SAGE catalogue. For further discussion, we will refer to this as the LMC-AGB sample.
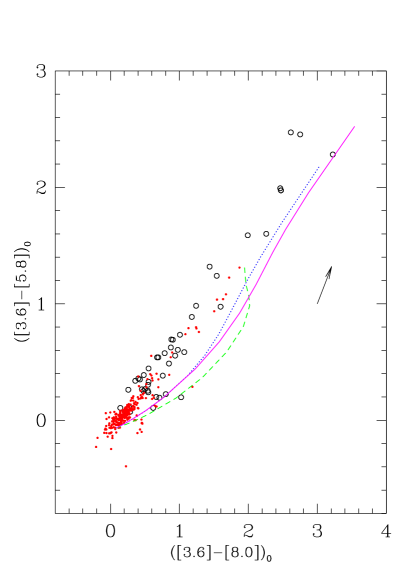
Figure 6 shows the dereddened [3.6][8.0] vs [3.6][5.8] colour-colour diagram for both the Galactic Center and the LMC AGB LPVs. We have superimposed for comparison theoretical dust models by Groenewegen (Groenewegen06 (2006)). These utilise several types of dust for the O-rich AGB stars: 100% aluminium oxide, a combination of 60% aluminium oxide and 40% silicate, and pure silicate dust (see Groenewegen 2006 for a discussion). All three models fail to match the observed colours and a significant offset is clearly visible.
Our comparison is restricted to oxygen-rich AGB stars (283 stars). It should be noted that we split the LMC-AGB sample into oxygen-rich and carbon-rich AGB stars using only the colour. Though Cioni et al. (Cioni01 (2001)) showed that carbon stars can in general be eliminated by avoiding colours in the range , they warn (see their Fig. 3) that stars selected in this way will contain a certain fraction of carbon stars.
Figure 6 shows that the GALCEN variables and LMC oxygen-rich variables only partly overlap in the colour-colour diagram. The GALCEN LPVs show much redder colours in [3.6][8.0] and [3.6][5.8] than the LMC sample. These stars also have a higher proportion of long periods (Groenewegen & Blommaert 2005) relative to the LMC and the remainder of the Galactic Bulge. The redder colours in the IRAC bands may indicate that mass-loss rates of AGB stars in the GC are higher in general than in the LMC. However, the differing circumstellar dust-to-gas ratios between the LMC and GC makes direct comparison difficult. The differences can also be a manifestation of the strong relation between period and mass-loss (see Sect. 6).
5 The Period-magnitude relations
AGB variable stars in the Galactic Bulge follow a well-defined period-magnitude relation in the near infrared. Glass et al. (2001) showed that the mean magnitude for the Glass-LPVs, measured over a complete cycle, showed some tendency to follow a log vs. relation in spite of a very high dispersion due to the large and unknown variations in . Some of the scatter may also have arisen because of crowding effects or insufficient observations having led to incorrect periods, especially at the long (log ) and short ends (log ) of the range. The Glass et al. (2001) sample contains a higher fraction of long periods than e.g. the SgrI field. Thus, circumstellar reddening due to heavy mass-loss affects the log vs. relation by depressing the emergent fluxes at longer wavelengths.
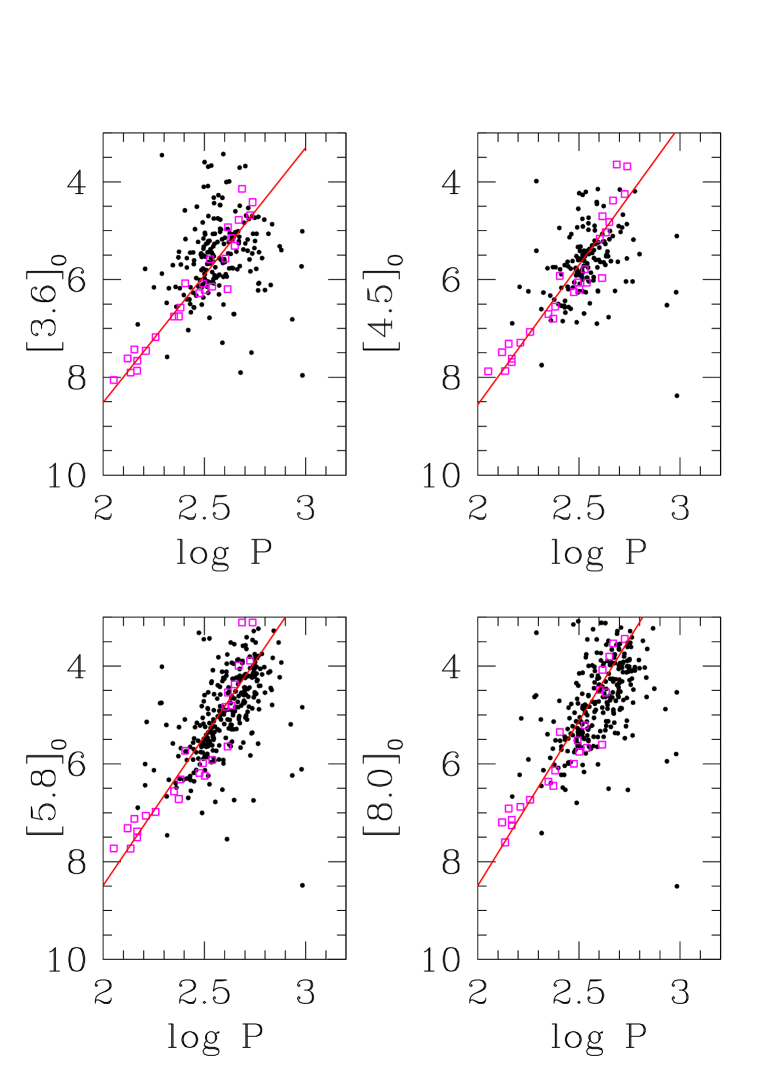
Figure 9 shows the IRAC magnitude vs. log relations for the
Glass-LPVs, after correction of the photometry for interstellar extinction.
We find following relations for the Glass-LPV sample:
= log P -5.21 +18.94
= log P -5.71 +19.98
= log P -6.10 +20.70
= log P -6.73 +21.96
The typical r.m.s deviation for the four [IRAC] bands are 0.71 , 0.62, 0.60 and 0.61 mag in the period range between . This is smaller than at where the r.m.s is 0.95 mag (corrected according to the extinctions determined in this work) as the IRAC bands are less affected by any residual errors in the extinction. Even within the IRAC bands, the dispersions at the longer wavelengths are less than that at 3.6 m. The Glass-LPVs with periods greater than 900 days do not follow the log P vs. [IRAC] relations. Their periods could be incorrect as these only have a few observations (see Glass et al. 2001) and in addition these stars suffer heavy mass-loss which depress their [IRAC] fluxes.
Superimposed on Fig. 9 is the LMC-AGB star sample. Again, we have chosen only oxygen-rich Mira variables in order to make direct comparisons with the Glass-LPV sample. We have put the LMC LPVs at the distance of the GC using a distance modulus difference of mag. Within the errors, the Glass-LPVs do follow the LMC relation.
As mentioned, the scatter in the period-magnitude relations for the Glass-LPVs is much higher than in the LMC-AGB sample. This is due to the uncertainties in the extinction determination. No attempt has been made to compensate for the triaxial distribution of stars in the Bulge. Recent studies of the central region of our Galaxy suggest a smaller bar-like structure within the main bar (see e.g. Alard Alard2001 (2001), Nishiyama et al. Nishiyama05 (2005)) which might be partly responsible for the observed scatter. However, the parameters of the central bar (such as its angle, length and orientation) are still poorly known.
In contrast to the light curves obtained by Glass et al. (2001), we have only single epoch measurements in the IRAC bands. The amplitude distribution of the Glass-LPVs peaks around 0.8 mag, going up to 1.5 mag for the OH/IR stars. In order to estimate the expected amplitude of LPVs in the IRAC filter bands, we used the calculated colours of Galactic oxygen-rich AGB stars by Marengo et al. (Marengo06 (2006)). Several such objects were observed by ISO at different epochs. Mira variables, such as Z Cyg, can show variations up to 1 mag in each IRAC channel, while in the most extreme cases, such as the dust-enshrouded OH/IR star V1300 Aql, variations of 1.4 mag may occur in each filter.
Up to now, period-magnitude relations have been mainly studied in the intermediate Bulge (such as Baade’s Window) and the LMC, where the log vs relations seem to be independent of the galactic environment (see e.g. Schultheis et al. Schultheis2004 (2004), Glass & van Leeuwen Glass07 (2007)). Groenewegen & Blommaert (Groenewegen05 (2005)), by using OGLE data, also compared the period-magnitude relations in the Galactic bulge and the Magellanic Clouds and concluded that there is no difference in their slopes. Rejkuba (Rejkuba04 (2004)) found that even Miras in Cen A follow a similar relation.
The Galactic Center, however, has up to now been excluded from this comparison. In asking whether substantially different behaviour should be expected we first summarize recent abundance studies in order to place the GC in context with the Bulge ([Fe/H] ; alpha-enhanced) and the LMC ([Fe/H] ; no alpha-enhancement). Studies have shown that in the GC the mean [Fe/H] is nearly solar; [Fe/H] 0.1 (Ramírez et al. Ramirez2000 (2000); Najarro et al. Najarro04 (2004), Najarro08 (2008); Cunha et al. Cunha07 (2007)). On the other hand, Ramírez et al. (Ramirez2000 (2000)) found that the distribution in metallicity is significantly narrower than in the Bulge, emphasizing the difference between its stellar population and that of the GC.
Figure 9 shows clearly that the slopes of the period-magnitude relations at the IRAC wavelengths for the Glass-LPVs are similar to those of the LMC. This suggests that any dependence of the log vs. relations on abundance, if present at all, must be small. Within the uncertainties, there is no evidence for a significant difference between the period-magnitude relations in the LMC and in the GC. This is in agreement with Whitelock et al. (Whitelock08 (2008)) who found, after reanalyzing published lightcurves of AGB variables in the LMC, similar zero points in the period- relations for systems with different metallicities. They did not, however, include in their analysis the variables towards the GC, which is thought to be the most metal-rich environment. Thus, our analysis shows that the apparent universality of the PL relations extends to the IRAC bands.
6 Mass-loss
AGB stars contribute more than 70% towards the enrichment of the dust component of the interstellar medium (ISM) in the solar neighbourhood (Sedlmayr Sedlmayr94 (1994)) and hence it is important to study their mass-loss in other parts of the Galaxy. One of the most promising tools for determining mass-loss rates is the combination of near-IR and mid-IR colours such as the IRAS or the ISOGAL colours (see e.g. Whitelock et al. 1994; Habing 1996; Le Bertre & Winters 1998; Omont et al. 1999; Jeong et al. 2002, Ojha et al. Ojha03 (2003), Ojha07 (2007)).
We used the dust radiative transfer code for oxygen-rich AGB stars from Groenewegen (2006) to derive theoretical mass-loss rates. The procedures described by Ojha et al. (Ojha07 (2007)) to derive observed mass-loss rates based on the colour (see Equ. 1).
| (1) |
where
As in Ojha et al. (Ojha07 (2007)) we are considering an AGB star model with and 100% silicate composition. Note that the empirical values determined by Groenewegen (2006) are for mass-loss rates smaller than 2 M⊙ yr-1. For the high mass-loss end we extrapolate the empirical relation.
The distribution of mass-loss rates is displayed in Fig. 10. The derived values of range from to M⊙ yr-1. The distribution, however, is definitely incomplete for 1 M⊙ yr-1. We emphasize that the determination of these rates is very uncertain as discussed by Schultheis et al. (Schultheis2003 (2003)). The uncertainties could easily reach a factor of 3.

There is some correlation between mass-loss rates and period, in the sense that longer periods show higher rates. Theoretical isochrones by Marigo et al. (2008) which include mass-loss and pulsation periods predict that there should be such a correlation; however there is still some disagreement with the observational data indicating that self-consistent dust models of oxygen-rich AGB stars are in need of further improvement.
7 Luminosities
We have derived a bolometric magnitude () for each Glass-LPV from its de-reddened magnitude, an assumed bolometric correction (BCK), and a distance modulus of 14.5 for the GC. We used an approximate relation between BCK and (–[15])0 derived by Ojha et al. (Ojha03 (2003)) for AGB stars, using data from Frogel & Whitford (1987). We refer here to Ojha et al. (Ojha03 (2003)) for a more detailed description of the method. These authors conclude that the rms uncertainty in the luminosities of the Bulge sources that they observed with ISO is about 0.5 mag.

Fig. 11 shows the luminosity function of the Glass-LPVs. These include high luminosity stars, with , which are not observed in the inner Bulge AGB stars (Ojha et al. 2007). However, one should note that the sample of Ojha et al. (2007) excludes the GC region and are only single-epoch measurements. The luminosity distribution of the Glass-LPVs, compared to that of the inner Bulge AGB stars (Ojha et al. 2007), is also broader and less strongly peaked. Due to the variability of our sources, the luminosity distribution will be widened. Thus, compared to the Bulge sample of Ojha et al., we find an excess in the GC of luminous stars.
Such an excess of luminous stars in the GC, compared to Bulge fields such as Baade’s Window, has previously been found in the infrared stellar luminosity function by Blum et al. (Blum96 (1996)), Narayanan et al. (Narayanan96 (1996)), Launhardt et al. (Launhardt02 (2002)), Genzel et al. (Genzel03 (2003)), Van Loon et al. (vanLoon03 (2003)), and Figer et al. (Figer04 (2004)). In addition, Blommaert et al. (1998) and Wood et al. (1998) found a similar excess of high luminosity OH/IR stars in the GC compared to the Bulge. All these authors conclude that this is generally evidence for recent star formation in the GC. Blum et al. (Blum96 (1996)), Figer et al. (Figer04 (2004)), and Maness et al. (Maness07 (2007)), among others, have derived detailed star formation histories for the GC by fitting models to the observations. Their studies suggest that star formation has occurred within the last 10 Myr within the central 30 pc, and that it has been more or less continuous over the Hubble time.
Groenewegen & Blommaert (Groenewegen05 (2005)) studied the Mira period distribution of six fields at similar longitudes but spanning latitudes . They found for all these fields a similar period distribution, consistent with the average period in Baade’s Window of 333 d (Glass et al. Glass95 (1995)). By comparing their fields with the LPVs of Glass et al. (Glass2001 (2001)) they found that there is a significant overabundance of LPVs with periods 500 d in the GC compared to Bulge fields at higher latitudes. This excess of LPVs with long periods in the GC is not surprising, considering the excess of luminous sources in the GC generally (see Fig. 11), when combined with the period-luminosity relation. Groenewegen & Blommaert (Groenewegen05 (2005)) explain this difference in the period distribution as due to a younger population in the GC with a higher initial mass in the range of 2.5–3 compared to 1–2 for higher latitude Bulge fields.
We conclude that the GALCEN-LPVs show an excess of luminous, young stars compared to the galactic Bulge. It is unfortunate that the isochrones in the [IRAC] bands are not very sensitive to metallicity and/or age; thus no estimation of initial masses or metallicities in this wavelength range can be made.
8 Conclusions
We have presented a high resolution interstellar extinction map of the Galactic Center (GC), derived from the Spitzer IRAC catalogue of GC point sources (Ramírez et al. 2008). It combines observations of the RGB/AGB population with the newest isochrones (Marigo et al. 2008). We have improved on previous near-IR extinction maps by using extinctions derived from mid-IR colours to resolve all regions of high . The maximum value we found is . By using this extinction map, we have studied the Spitzer (IRAC) properties of the long-period variables (LPVs) of in the GC. They follow well-defined period-magnitude relations in the IRAC bands and are similar to those observed in the LMC, lending support to the suggestion that the log vs. [IRAC] relations are universal, independent of metallicity. Further, mass-loss rates for the Glass-LPVs have been determined by using additional data from ISOGAL. These LPVs show some correlation between mass-loss and pulsation period as predicted by theoretical isochrones (Marigo et al. 2008). Finally, the long periods of the Glass-LPVs as well as their luminosity function agree with the suggestion of Groenewegen & Blommaert (Groenewegen05 (2005)) that one is dealing with a young and more massive population in the GC.
Acknowledgements.
We want to thank the referee J. Blommaert for his very fruitful comments. We are thankful to M. Marengo for making the colours of AGB stars in the IRAC bands available to us, and to the GLIMPSE team for sharing data in advance of publication. We would like to thank M. Groenewegen for the fruitful discussion and his comments on the paper This work is based on observations made with the Spitzer Space Telescope, which is operated by the Jet Propulsion Laboratory (JPL), California Institute of Technology under NASA contract 1407. K.S., R.S., and S.S. are grateful for financial support from NASA through an award issued by JPL/Caltech. ISG acknowledges receipt of a travel grant under the CNRS-NRF bilateral agreement. M.S. and L.G. acknowledge support by the University of Padova (Progetto di Ricerca di Ateneo CPDA052212). SG’s visit to the Observatoire de Besancon was supported by an EARA-Marie Curie fellowship. Work at the Physical Research Laboratory is supported by the Department of Space, Govt of India. This research has made use of the NASA/IPAC Infrared Science Archive, which is operated by JPL, California Institute of Technology, under contract with the National Aeronautics and Space Administration. This publication makes use of data products from the Two Micron All Sky Survey, which is a joint project of the University of Massachusetts and the Infrared Processing and Analysis Center/California Institute of Technology, funded by the National Aeronautics and Space Administration and the National Science Foundation.References
- (1) Allen L.E., Calvet N., Alessio P., et al., 2004, ApJS 154, 363
- (2) Alard C., 2001, A&A 379, L44
- (3) Bandyopadhyay R.M., Eikenberry S.S., Curtis D., 2008, astro-ph/0803.2721
- (4) Benjamin R.A., Churchwell E., Babler B.L. et al., 2003, PASP 115, 953
- (5) Blommaert J.A.D.L., van der Veen W.E.C.J., van Langevelde H.J. et al., 1998, A&A 329, 991
- (6) Blommaert J.A.D.L.L, Groenewegen M.A.T., Okumura K., 2006, A&A 460, 555
- (7) Blum R.D., Sellgren K., DePoy D.L. 1996, ApJ 470, 864
- (8) Cesarsky C.J., Abergel A., Agnese P., et al., 1996, A&A 315, L32
- (9) Chapman N.L., Mundy L.G., Shih-Ping L., 2008, astro-ph/0809.1106
- (10) Cioni M.R., Marquette J.B., Loup C., et al., 2001, A&A 377, 945
- (11) Cunha K., Sellgren K., Smith V.V., et al., 2007, ApJ 669, 1011
- (12) Deguchi S., Fuji T., Ita Y., et al., 2008, in “Mapping the Galaxy and Nearby Galalxies”, Astrophysics and Space Science Proceedings, Springer, p33
- (13) Dutra C.M., Bica E., 2001, A&A 376, 434
- (14) Figer D.F., Rich R.M., Kim S.S., et al. 2004, ApJ 601, 319
- (15) Flaherty K.M., Pipher J.L., Megeath S.T., et al., 2007, ApJ 663, 1069
- (16) Frogel, J. A., Tiede, G. P., & Kuchinski, L. E. 1999, AJ, 117, 2296
- (17) Frogel J.A., Whitford A.E., 1987, ApJ 320, 199
- (18) Ganesh S., Omont A., Baliyan K.S., et al., 2008, astro-ph/0809.1741
- (19) Genzel R., Schödel R., Ott T., et al. 2003, ApJ 594, 812
- (20) Glass I.S., Whitelock P.A., Catchpole R.M., et al., 1995, MNRAS 273, 383
- (21) Glass I.S., Matsumoto S., Carter B. S., Sekiguchi K., 2001, MNRAS 321, 77
- (22) Glass I.S., van Leeuwen F., 2007, MNRAS 378, 1543
- (23) Gosling A., Blundell K.M., Bandyopadhyay R., 2006, AJ, 640, L171
- (24) Groenewegen M.A.T., 2006, A&A 448, 181
- (25) Groenewegen M.A.T., Blommaert J.A.D.L., 2005, A&A 443, 143
- (26) Habing, H. J. 1996, A&AR 7, 97
- (27) Indebetouw R., Mathis J.S., Babler B.L., et al., 2005, ApJ 619, 931
- (28) Jeong, K. S., Winters, J. M., Le Bertre, T., et al. 2002, in Mass-losing Pulsating stars and their Circumstellar Matter, ed. Y. Nakasa, M. Honma, & M. Seki
- (29) Jiang B.W., Omont A., Ganesh S., et al., 2003, A&A 400, 903
- (30) Launhardt R., Zylka R., Mezger P.G., 2002, A&A 384, 112
- (31) Le Bertre, T., & Winters, J. M. 1998, A&A, 334, 173
- (32) Le Bertre T., Tanaka M., Yamamura I., et al., 2003, A&A, 403, 943
- (33) Lindqvist M., Winnberg A., Habing H.J., et al., 1992, A&AS 92, 43
- (34) Lutz D., Feuchtgruber H., Genzel R., et al., 1996, A&A 315, L269
- (35) Lutz D., 1999, in “The Universe as Seen by ISO”, ESA-SP 427, p.623
- (36) Maness H., Martins F., Trippe S., et al. 2007, ApJ 669, 1024
- (37) Marengo M., Hora J.L., Barmby P., astro-ph/0611346
- (38) Marigo P., Girardi L., Bessan A., et al., 2008, A&A 482, 883
- (39) Marshall D.J., Robin A.C., Reylé C., 2006, A&A 453, 635
- (40) Meixner M., Gordon K.D., Indebetouw R., et al., 2006, AJ 132, 2268
- (41) Messineo M., “Late-type Giants in the Inner Galaxy”, PhD thesis, Leiden
- (42) Najarro F., Figer D.F., Hillier D.J., et al., 2004, ApJ 611, L105
- (43) Najarro F., Figer D.F., Hillier D.J., et al., 2008, astro-ph/0809.3185
- (44) Narayanan V., Gould A., DePoy D.L. 1996, ApJ 472, 183
- (45) Nishiyama S., Nagata T., Baba D., et al., 2005, ApJ 621, L105
- (46) Nishiyama S., Nagata T., Matsunaga N., 2006, ApJ 638, 839
- (47) Ojha D. K., Omont A., Schuller F., et al. 2003, A&A, 403, 141
- (48) Ojha D.K., Tej A., Schultheis M., et al., 2007, MNRAS 381, 1219
- (49) Omont A., Ganesh S., Alard C., et al. 1999, A&A, 348, 755
- (50) Ramírez S.V., Sellgren K., Carr J.S., et al., 2000, ApJ 537, 205
- (51) Ramírez S.V., Arendt R.G., Sellgren K., et al., 2008, ApJS 175, 147
- (52) Reid M.J., 1993, ARA&A 31, 345
- (53) Rejkuba M., 2004, A&A 413, 903
- (54) Román-Zúñiga C.G., Lada C.J., Muench A., 2007, ApJ 664, 357
- (55) Schuller F., Ganesh S., Messineo M.., et al., 2003, A&A 403, 955
- (56) Schuller F., Omont A., Glass I.S., et al., 2006, A&A 453, 535
- (57) Schultheis M., Ganesh S., Glass I.S., et al., 1999, A&A 349, L69
- (58) Schultheis M., Lançon A., Omont A., et al., 2003, A&A 405, 531
- (59) Schultheis M., Glass I.S., Cioni M.R., 2004, A&A 427, 945
- (60) Sedlmayr, E. 1994, in Molecules in the Stellar Environment, ed. U. G. Jorgensen (Berlin: Springer), 163
- (61) Sjouwerman L., van Langevelde H.J., Winnberg A., 1996, A&AS 128, 35
- (62) Stolovy S., Ramírez S.V., Arendt R.G et al., 2006, Journal of Physics: Conference Series, Volume 54, 176
- (63) Stolovy S., et al., 2008, in preparation
- (64) Vanhollebeke E., Blommaert J.A.D.L, Schultheis M., et al., 2006, A&A 455, 645
- (65) van Loon, J., Gilmore G., Omont A., et al., 2003, MNRAS 338, 857
- (66) Whitelock P.A., Menzies J.W., Feast M.W., et al., 1994, MNRAS 267, 711
- (67) Whitelock P.A., Feast M.W., van Leeuwen F., 2008, MNRAS 386, 313
- (68) Wood P.R., Habing H.H., McGregor P.J., 1998, A&A 336, 925