A model of underground ridership during the severe outbreaks of the SARS epidemic in a modern city
Kuo-Ying Wang
Department of Atmospheric Sciences
National Central University
Chung-Li, Taiwan
Abstract The outbreaks of the severe acute respiratory syndrome (SARS) epidemic in 2003 resulted in unprecedented impacts on people’s daily life. One of the most significant impacts to people is the risk of contacting SARS while engaging daily routine activity. In this work we use data from daily underground ridership in Taipei and daily reported SARS cases in Taiwan to model the dynamics of the public underground usage during the wax and wane of the SARS period. We found that for each reported SARS case there is an immediate loss of about 1200 underground ridership. These loss rates propagate to the following days with an -folding decay time of about 28 days, reflecting the public perception on the risk of contacting SARS disease when travelling with the underground system. About 50% of daily ridership was lost during the peak of the 2003 SARS period, compared with the loss of 80% daily ridership during the closure of the underground system after Typhoon Nari, the loss of 50-70% ridership due to the closure of the governmental offices and schools during typhoon periods, and the loss of 60% daily ridership during Chinese New Year holidays.
Keywords: SARS, modeling, risk, ridership
1. Introduction
The 2003 SARS epidemic is a recent vivid example, demonstrating the deep impacts that an infectious disease can have on human society. For example, TIME magazine called Taiwan a SARS Island (16), that SARS sinks Taiwan (17), and China as a SARS Nation (18). One of the best ways to understand the response of people living through an emerging disease is by examining the change of people’s daily activity with respect to the variations of the reported SARS cases during the epidemics. However, there is a lack of study showing the dynamics of public’s response to the perceived risk associated with the daily reported SARS cases. Previous works studied the dynamics of the daily accumulated infected cases during the SARS outbreaks in Beijing, Canada, Hong Kong, Singapore, and Taiwan (1, 2, 3, 12), respectively. A study examined the impact of influenza on death rates in tropical Singapore (4). Since confined environment with short distance is conducive for infectious transmission between species (5, 6), the perceived risk associated with staying in any confined space during the SARS epidemics alters people’s daily activity. In this work, we use the Taipei underground mass transportation system, which is a typical of confined space, and reported SARS cases in Taiwan, to show that the dynamics of the underground usage can be modeled by the daily variations of the reported SARS cases.
2. Methods
2.1. Daily Underground Ridership Data
The Taipei underground system transports about 1 million people per day (7). These daily ridership exhibits a strong weekly cycle. A lower amount of people traveling on Wednesday (a short weekend), a weekly peak on Friday (before the long weekend), the lowest amount of people traveling on Saturday and Sunday, and the rest of the week days are about the same. Except for occasional events such as typhoon and the Chinese New Year (8), the weekly pattern is roughly the same through the year. This stability in the daily ridership provides a good quantifiable measure of public reaction when an unprecedented risk occurs in the society.
Since weekly patterns of the passengers are less perturbed during the weeks from early spring to early summer than other periods, we can determine mean daily underground ridership in a week based on the average of the twelve weeks, started from the week with the first Monday in March, for the years 2001, 2002, 2004, and 2005, respectively. The statistical daily ridership for 2003 is calculated as the mean of the daily ridership from 2001, 2002, 2004, and 2005. Hence, if without the disturbance of significant factors such as an approaching typhoon, a long holiday, festivals, and epidemics, the daily ridership will normally maintain a constant pattern throughout the week.
2.2. A Dynamic Model
In order to model the daily variations of the underground ridership with respect to the daily reported SARS cases, a dynamical model was developed to simulate day-to-day variations of the underground ridership in the periods before, during, and after the SARS epidemics. Since the model is dynamic in nature, the model variables and the external forcing that governs the time evolution of the model variables must be established so that the model is able to make prediction based on the change of external forcing.
During the 2003 SARS period, we observed two significant relationships between the daily underground ridership and the daily reported SARS case. Firstly, there exists a quick response of the underground ridership with respect to the daily reported SARS cases that made headlines almost everyday in the mass media during the SARS period. The overwhelming reports from these public media appear to have big impacts on the willingness of the public in using the underground as a mean for going to schools and offices (both schools and offices were not closed during the SARS period). The public perception of risk in associating with the use of the underground system vividly reflected in the significant drops of underground ridership (9). Secondly, the gradual increases in underground ridership during the final stage of the SARS epidemic. This indicates the return of public confidence in using the underground system as a mean for daily transportation to offices and schools. These two observations indicate that a dynamic model should represent these effects, i.e., the sharp drops in the ridership associated with increases in the reported SARS cases, and a gradual return of the underground ridership as the reported SARS cases gradually faded away from the headlines.
Based on the daily ridership from 2001 to 2005 and daily reported SARS cases in 2003, we can write a model of daily ridership with respect to the daily reported SARS cases as
Here, on a given day , is the daily normal underground usage predicted by the statistics as described above; is the loss of the underground ridership, due to the perceived risk if traveling with the underground system; is the loss rates of the underground ridership per reported SARS case; is the daily reported SARS cases; is the day number since the simulation started (1 Mar 2003); andis the -folding time.
Notice that the real-time reported probable SARS cases (9) were used in this work. These were the information affecting people’s decision during the height of the SARS epidemics. The SARS cases published after the SARS epidemics are slightly different (10, 11, 12). The instantaneous passenger loss rate on day will propagate exponentially to the following days with an -folding time of days. Here the e-folding time measures the damping of the perceived risk factor due to each new reported SARS cases, reflecting the public expectation of the risk of contacting the disease arises from each newly reported SARS cases. Hence, the amount of passengers at each day is determined by the daily normal ridership, subtracted the loss of ridership due to the number of reported SARS cases at that day and the accumulated impacts from the days before.
3. Results
3.1. The Underground Ridership During Non-SARS Years
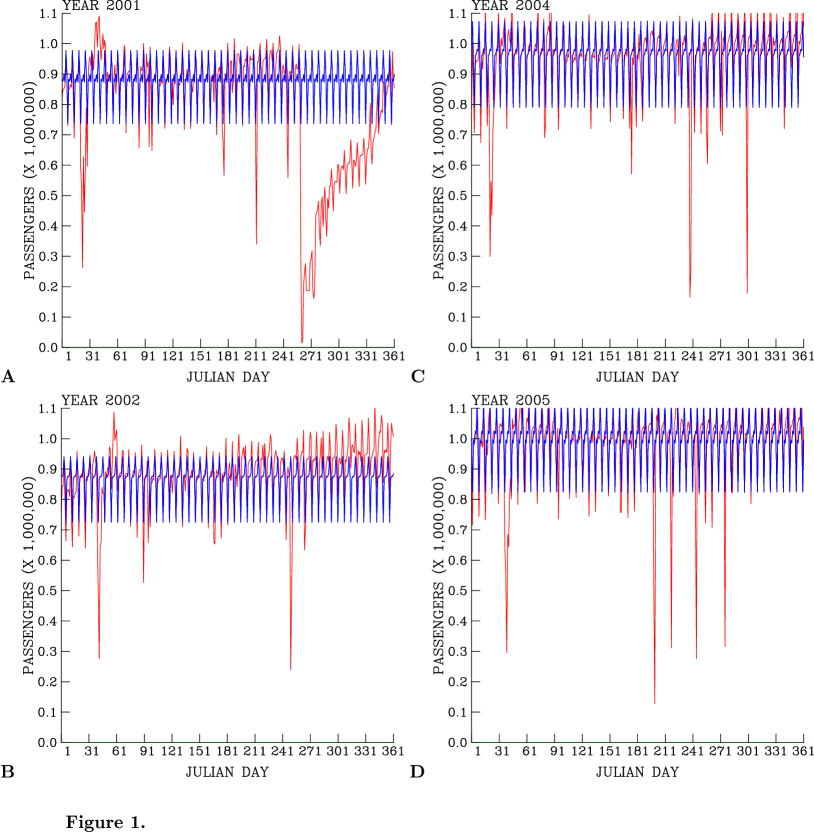
Figure 1 shows a time-series plot of recorded and modeled daily underground ridership during the non-SARS years of 2001, 2002, 2004, and 2005, respectively. During these years, the daily underground ridership can be approximated by the statistical average daily ridership ( of each year. During most of the days the actual amount of people traveling with the underground is close to the statistical predictions, indicating that the underground usage during normal days are very regular. However, there are days when the model and the actual underground ridership show big discrepancies. These are the days when special events (e.g., Chinese New Year, spring holiday, and typhoons) occurred. For example, Figure 1B shows a typical example of the time-series plot of daily ridership using the Taipei underground system in 2002. We note that the first big drop in ridership after day 31 corresponds to the Chinese New Year holiday, the second big drop in numbers after day 91 is due to students’ spring holiday, and the drop after day 241 Julian is due to a typhoon. Similar situations applied to other years as well. We note that a big drop of ridership during the days 241-271 in 2001 is due to the closure of two main lines of the underground system, which was flooded by the severe rainfall during the passing of Typhoon Nari (8).
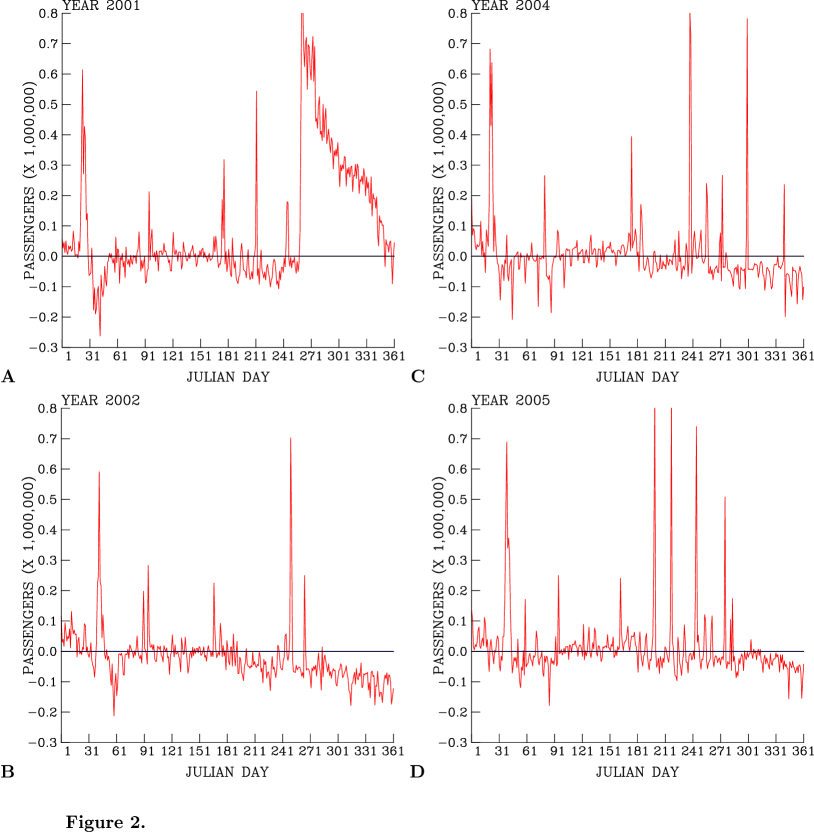
Figure 2 further compares the discrepancies in ridership between the statistical predictions and the actual numbers. During the spring months (days 61-150) of each year, the statistical model predicts the daily ridership that are, in most of the days, close to within 10% of the actual numbers of people taking the underground. Exceptions occur during rare events (e.g., long holidays, festivals, typhoons, etc). We find that the underground flooding in 2001, casued by Typhoon Nari, resulted in a loss of about 80% daily ridership; the Chinese New Year holiday causes a loss of 60-70% daily ridership; and the close of the governmental offices and schools during typhoon periods caused a loss of 50-80% daily ridership. The increases in people taking the underground toward the end of 2002, 2004, and 2005, respectively, could be due to the factors that the underground ridership was steadily growing and also more people tend to take underground during the winter months.
3.2. The Underground Ridership During the 2003 SARS Year
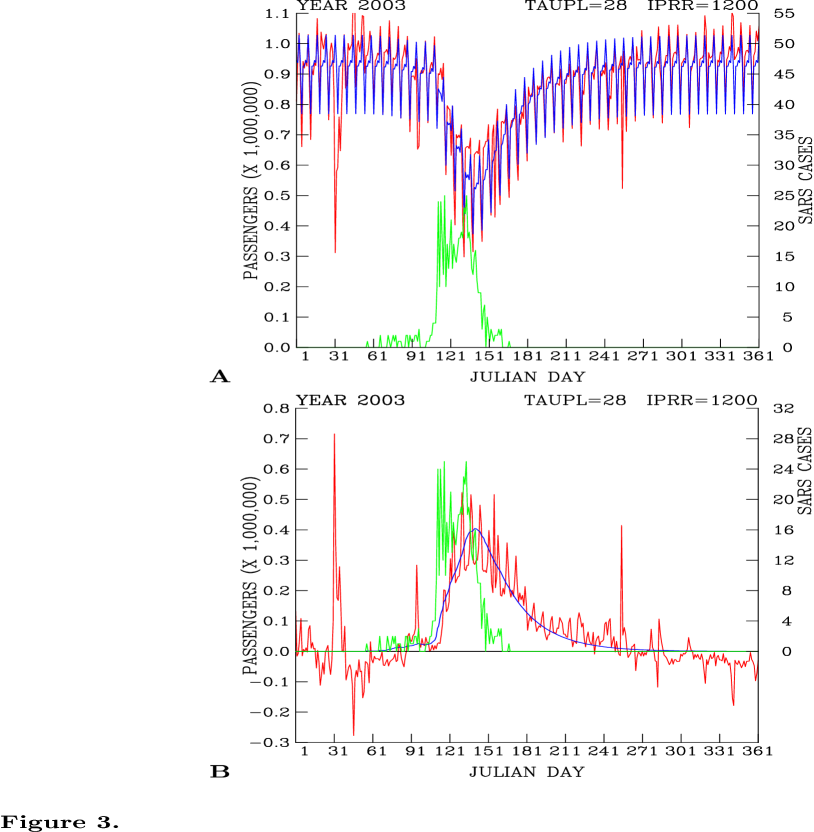
In a sharp contrast with the normal underground usage during 2001, 2002, 2004, and 2005, the daily ridership in 2003 shows anomalously high loss of ridership from about day 60 to days 120-150, when the maximum reduction of daily ridership of half a million were occurred (Figure 3). About 50% of daily ridership was lost during peak of the 2003 SARS periods. This period concurs with the SARS outbreaks in Taiwan (10, 11). The reason for the drop of daily underground passengers is clearly related to the rising numbers of reported probable SARS cases (9) during this period. Figure 3A compares the time evolution of SARS cases and the wane and the wax of the daily underground ridership. The peak of the reduction in the daily ridership occurred after the peak of the reported probable SARS cases. While the reported SARS cases drop sharply during days 151-181, the returns of the ridership to the underground appear to be at a slow pace during days 151-271. Predicted loss of the daily underground ridership and its comparison with the actual ridership are shown in Figure 3B. The sharp response in daily ridership following the increase of the reported SARS cases, and the slow return of the ridership after the peak of the SARS cases is well reproduced by the model, Figure 3B. The close agreement between the model and actual underground ridership indicate that the model can successfully reproduce the daily underground ridership during the 2003 SARS epidemics in Taiwan. Though the fear of the SARS still linger on in 2004, no reported SARS cases in that year resulted in the normal use of the underground system as seen from the model and the actual daily ridership, Figure 2C.
3.3. Sensitivity of Underground Ridership to Reported SARS Cases
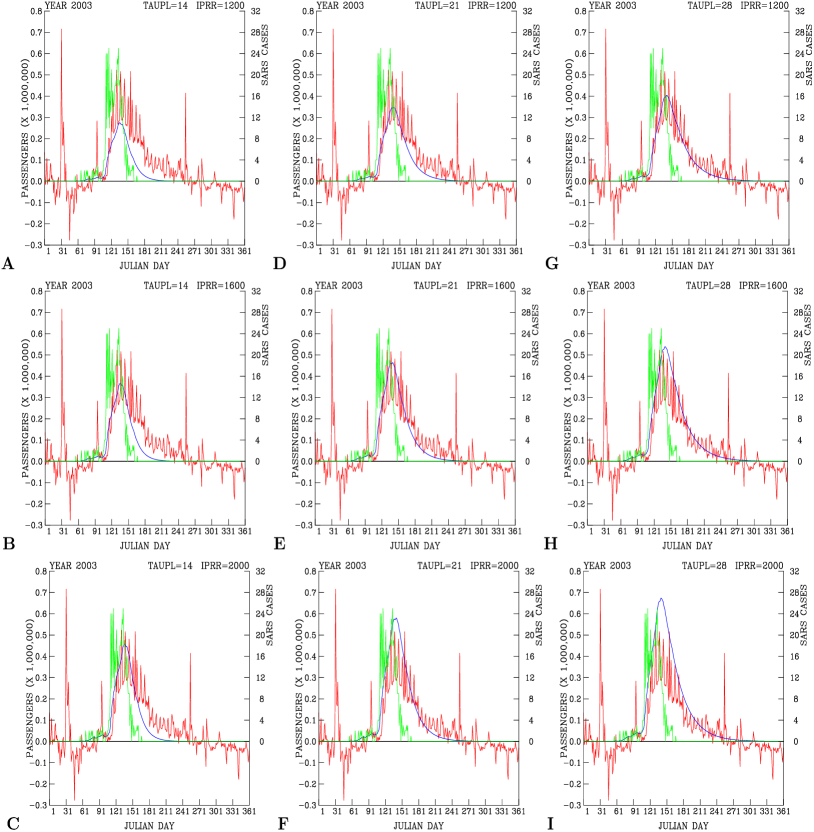
Two parameters are keys to the predicted underground ridership with respect to the daily reported SARS cases: Instantaneous ridership loss rate ( per reported SARS case, and the -folding time ( indicating the propagation of the loss rates to subsequent days. Figure 4 shows tests of various values of these two parameters. For the same -folding time (the periods that perceived risk lasts), for example =14 days (Figures 4A-C), the larger the daily ridership loss rates per reported SARS case (degree of shocks to the public), the deeper the reduction in the underground ridership will be resulted. But the time to return to the normal daily ridership is similar for different ridership loss rates after passing the peaks in the SARS cases. These results indicate that, if the time scales of public perception to each reported SARS case are the same, then the impact on the loss of underground passengers will be limited to the days close to the peak of the reported SARS cases.
On the other hand, if the passenger loss rates are the same, for example =1200 (Figures 4A, 4D, and 4G), then the longer the -folding time scale , the slower the return of the underground ridership to the normal. A long -folding time scale also results in a large accumulated loss due to the accumulated effects from previous days (Figure 4G). Hence, long period of the public perception of the risk associated with the reported SARS cases is likely to cause the long-lasting impact on the behavior of people and their willingness to use the underground.
4. Summary
In this work we show that the dynamics of the Taipei underground usage during the 2003 SARS epidemic in Taiwan are closely linked to the daily wax and wane of the reported probable SARS cases. Our model shows that each reported SARS case results in an immediate loss of about 1200 underground ridership, reflecting the public perception of immediate risk associated with the intense report of the SARS outbreaks and their reluctance in using the underground system. The public perception of the risk propagates and exponentially decays to the following days with an -folding time of about 28 days. This duration of time reflects the perception of the risk perceived by the normal underground passengers. Our study shows that the longer the -folding time (perception of the risk), the slower the return of the underground ridership. A huge loss of the underground ridership but with a short -folding time results in predicted passengers returning to the underground system sooner than what had occurred. The combination of the immediate passenger loss rates and their impacts propagates to the following days resulting in the occurrence of the peak of the ridership loss later than the peak of the reported SARS cases. About 50% of daily ridership was lost during the peak of the 2003 SARS periods, compared with the loss of 80% daily ridership during the closure of the underground system after Typhoon Nari, the loss of 50-70% ridership due to the closure of the governmental offices and schools during typhoon periods, and the loss of 60% daily ridership during Chinese New Year holidays.
Since social distancing measures have been shown to be important for containing an emerging disease (6, 13, 14, 15, 22), our results could be useful in incorporating into the disease spreading models where underground usage is an important connection node for social behaviors. There are other major cities such as Hong Kong, Singapore, and Beijing all contain massive underground systems and were impacted by the 2003 epidemics (19, 20, 21). Our model developed here could be useful to test if similar ridership behaviors found in Taipei are also applicable to these major cities in Asia. In the context of avian flu, the underground ridership occurred under the SARS epidemics may provides us a glimpse on what the general public will response in the wake of next epidemics.
Acknowledgement
The author dedicates this work to those who suffered the SARS disease; the US CDC who helped Taiwan fights the SRAS war; and the doctors, nurses, voluntary workers, and public officers who stayed on duty during the 2003 SARS epidemic. The author thanks P. Hadjinicolaou, O. Wild, A. Polli, and H.-C. Lee for their comments on the manuscript.
References
-
1.
Hsieh YH, Cheng YS, Real-time forecast of multiphase outbreak, Emerg Infect Dis. 2006; 12:114-121.
-
2.
Cauchemez S, Boëlle PY, Donnelly CA, Ferguson NM, Thomas G, Leung GM, Hedley AJ, Anderson RM, Valleron AJ, Real-time estimates in early detection of SARS, Emerg Infect Dis. 2006; 12:110-113.
-
3.
Zhou G, and Yan G, Severe Acute Respiratory Syndrome epidemic in Asia, Emerg Infect Dis. 2003; 9:1608-1610.
-
4.
Chow A, Ma S, Ling AE, Chew SK, Influenza-associated deaths in tropical Singapore, Emerg Infect Dis. 2006; 12:114-121.
-
5.
Lowen AC, Mubareka S, Tumpey, TM, García-Sastre A, Palese P, The guinea pig as a transmission model for human influenza viruses, PNAS 2006; 103:9988-9992.
-
6.
Ferguson NM, Cummings DAT, Cauchemez S, Fraser C, Riley S, Meeyai A, Iamsirithaworn S, Burke DS, Strategies for containing an emerging influenza pandemic in southeast Asia, Nature 2005; 437:209-214.
-
7.
Taipei Rapid Transport Corporation (TRTC). Available at http://www.trtc.com.tw. Statistics for daily passengers were published on-line since March 1996.
-
8.
Wang KY, Shallcross DE, Hadjinicolaou P, Giannakopoulos C, Ambient vehicular pollutants in the urban area of Taipei: Comparing normal with anomalous vehicle emissions, Water Air Soil Pollu. 2004; 156:29-55.
-
9.
Department of Health, Taipei City Government. Available at http://sars.health.gov.tw/INDEX.ASP. The probable SARS cases during the SARS outbreak were published and updated real-time at http://sars.health.gov.tw/article.asp?channelid=C&serial=262&click=.
-
10.
Lee ML, et al., Severe acute respiratory syndrom – Taiwan, 2003, MMWR Morb. Mortal Wkly Rep. 2003; 52: 461-466.
-
11.
Chen YC, et al., SARS in hospital emergency room, Emerg Infect Dis. 2004; 10:782-788.
-
12.
Hsieh YH, Chen CWS, Hsu SB, SARS outbreak, Taiwan, 2003, Emerg Infect Dis. 2004; 10:201-206.
-
13.
Fraser C, Riley S, Anderson RM, Ferguson NM, Factors that make an infectious disease outbreak controllable, PNAS 2004; 101:6146-6151.
-
14.
Germann TC, Kadau K, Longini IM Jr., Macken CA, Mitigation strategies for pandemic influenza in the United States, PNAS 2006; 103:5935-5940.
-
15.
Longini IM Jr., Nizam A, Xu S, Ungchusak K, Hanshaoworakul W, Cummings DA, Halloran ME, Containing pandemic influenza at the source, Science 2005; 309:1083-1087.
-
16.
Time, 26 May 2003, page 3.
-
17.
Time, 2 June 2003, page 3.
-
18.
Time, 5 May 2003. Cover story.
-
19.
Donnelly CA, et al., Epidemiological determinants of spread of causal agent of severe acute respiratory syndrome in Hong Kong, Lancet 2003; 361:1761-1766.
-
20.
Zhou G, Yan G, Severe acute respiratory syndrome epidemic in Asia, Emerg Infect Disc. 2003; 9:1608-1610.
-
21.
Dye C, Gay N, Modeling the SARS epidemic, Science 2003; 300:1884-1885.
-
22.
Eubank S, Guclu H, Anil Kumar VS, Marathe MV, Srinivasan A, Toroczkai Z, Wang N, Modelling disease outbreaks in realistic urban social networks, Nature 2004; 429:180-184.