Raman phonons in -FeTe and Fe1.03Se0.3Te0.7 single crystals
Abstract
The polarized Raman scattering spectra of nonsuperconducting -FeTe and of the newly discovered, As-free superconductor Fe1.03Se0.3Te0.7 are measured at room temperature on single crystals. The phonon modes are assigned by combining symmetry analysis with first-principles calculations. In the parent compound -FeTe, the A1g mode of the Te atom and the B1g mode of the Fe atom are observed clearly, while in superconducting Fe1.03Se0.3Te0.7, only a softened Fe B1g mode can be seen. No electron-phonon coupling feature can be distinguished in the spectra of the two samples. By contrast, the spectra of the superconducting system show a slight enhancement below 300, which may be of electronic origin.
pacs:
74.70.-b, 74.25.Kc, 63.20.D-, 78.30.-jThe recent discovery of superconductivity in quaternary, rare-earth transition-metal oxypnictides, and especially the subsequent raising of the superconducting transition temperature () above the MacMillan limit, has drawn great interest in the condensed matter community.kamihara ; hhwen ; gfchen ; xhchen ; zaren REFeAsO1-xFx, which we abbreviate as FeAs-1111, is the first series of superconductors showing such high values without copper-oxide planes. As such, it provides a new system quite different from the cuprate superconductors in which to study the mechanism of high-temperature superconductivity. In rapid succession, Ba(Sr,Ca)K(Na)Fe2As2 (FeAs-122)Rotter ; gfchenFe2As2 ; Sasmal ; Nicrys ; gfchenFe2As2crys and Li1-xFeAs (FeAs-111),Wang ; Pitcher ; Tapp which has an infinite layered structure, were also found to be superconducting. It is thought that superconductivity in the FeAs-1111 and FeAs-122 series may have a direct connection to a spin-density-wave (SDW) anomaly occurring in the FeAs layer.cruz Superconductivity emerges when the SDW order is suppressed by chemical doping or by high pressures.
All these series of iron-based superconductors contain the element As, which is toxic on its own and would be even more so when oxidized to As2O3. As a substitute, -FeSe with some Se deficiency, which is less toxic and easier to handle than arsenides, has also been found to exhibit superconductivity.Hsu ; Yeh -FeSe has a PbO-type structure, different from the NiAs-type structure which has been studied extensively in -FeSe.Terzieff ; schuster The crystal structure of -FeSe is composed of stacked layers of edge-sharing FeSe4 tetrahedra, and belongs to the space group P4/nmm. -FeSe has been observed to distort from tetragonal to a triclinic structure below 105K, while its analog -FeTe, which is tetragonal at room temperature, transforms to an orthorhombic lattice at temperatures below 45K. -Fe(Se,Te) has a simpler structure than the different families of Fe-based superconductors, being essentially their infinite-layer analog. Among the consequences of this substantial structural difference are a shift of the SDW transition temperature by a factor of 2-3, to 65K in Fe(Se,Te) from 140-200K in the parent compounds of the FeAs systems. Further, the resistivity of Fe(Se,Te) shows a semiconductor-like temperature-dependence, completely different from the metallic behavior of the FeAs-based materials. However, it is superconducting at temperatures up to 13 K for the composition Fe1.03Se0.3Te0.7.gfchenunp As a safer member of the family of iron-based superconductors, Fe(Se,Te) would seem destined to play an important role both in fundamental research into iron-based superconductivity and in its potential applications.
To date, the mechanism for superconductivity in the iron-based compounds remains unclear. Many theoretical scenarios, particularly a magnetic origin and electron-phonon coupling, have been proposed to understand the pairing mechanism. Further, the study of the SDW above is tightly correlated with the structural properties. Thus a detailed study of the phonon modes in each series of Fe-based superconductors can be expected to yield important clues regarding all of the above aspects, and Raman scattering is well known to be a unique probe of zone-center optical phonons. Raman-scattering studies have so far been accomplished only for FeAs superconductors, and are reported in Refs. [Hadjiev, ; SC Zhao, ; Litvinchuk, ].
In this paper, we report polarized Raman-scattering results obtained on Fe1+ySexTe1-x single crystals, both for the parent compound and for the superconducting material with . The zone-center optical modes were classified by a group-theoretical analysis and the Raman-active phonons assigned accordingly. We have performed first-principles lattice-dynamics calculations using both the relaxed and the experimental atomic positions, and find that the latter correspond more closely to the experimental measurements.
The single crystals used in the Raman scattering experiments were prepared by the Bridgeman technique. Details of the crystal growth process are presented elsewhere.gfchenunp The exact compositions of the compounds studied here were estimated to be FeTe0.92 and Fe1.03Se0.30Te0.70. Raman-scattering measurements were performed with a triple Horiba Jobin Yvon T64000 spectrometer equipped with an optical microscope and liquid-nitrogen-cooled, back-illuminated CCD detector. A 50 long-working-distance objective was employed to focus the laser beam, with a wave length of 532nm, into a spot of about 4m in diameter on the crystal surfaces, and to collect the scattered light. The crystals were cleaved and, to avoid possible contamination or decomposition in air, were placed immediately in a cryostat, which was evacuated to 310-6Torr. The crystal surfaces are parallel to the -plane, and Raman measurements were conducted on these flat surfaces. Because the samples are good metals and the crystal surfaces are perfect, most of the laser intensity was simply reflected back. The effective incident light intensity, and hence the Raman signal, was low, necessitating long acquisition times.
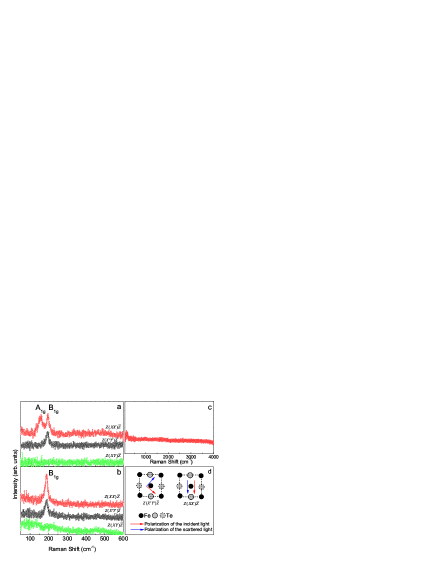
-FeTe has space group P4/nmm. The Fe and Te atoms have respective Wyckoff positions and . The classification of the zone-center optical modes is similar to that of Ref. [Hadjiev, ] for SmFeAsO and LaFeAsO, and thus is not reproduced in full detail here. By symmetry considerations, one may expect four Raman-active modes: A1g(Te), B1g(Fe), Eg(Te), and Eg(Fe); the Eg modes are two-fold degenerate. Because the experiments are performed within the -plane, it is easy to verify that the modes are absent as a consequence of their Raman tensors. Both the A1g and the B1g mode should be present when the polarization configuration is while only the B1g mode should remain when the configuration is changed to . This expectation is verified clearly by the experimental observations shown in Fig. 1(a), where both the A1g and B1g modes of FeTe0.92 are found to lie lower in frequency than the equivalent modes in Sr1-xKxFe2As2 single crystals.Litvinchuk By contrast, for Fe1.03Se0.3Te0.7, the A1g mode of Te is absent in all scattering geometries, as shown in Fig. 1(b). To explain this result, we note first that more impurities or vacancies may be introduced into the Se-doped samples, because the growth conditions are quite critical for high-quality single crystals. Secondly, the requirements for phase formation dictate that the two samples have a small difference in stoichiometric ratio: specifically, FeTe0.92 corresponds to Fe1.09Te, while the Se-doped system is Fe1.03Se0.3Te0.7. The excess Fe ions occupy Fe(2) positions, and may thus have a substantial effect on the vibration of neighboring Te ions. Finally, it is reasonable to expect that 30 Te substitution by Se may in itself suppress the Te vibration mode.
It is important to remark that a slight enhancement can be observed in the spectra of Fe1.03Se0.3Te0.7 below 300. This may originate from electronic Raman scattering, and further measurements are required to identify definitively the nature of this feature. By contrast, there is no obvious feature at all in the high-energy spectra, which were measured up to 4000 [Fig. 1(c)]. If it were present at these energies in the material, evidence of electron-phonon coupling would be expected in the extended spectra.
| Symmetry | Atoms | NM-relaxed | NM-exp | Experiment | Active | Cell Parameter | Relaxed | Experiment |
| Te | 73.3 | 59.1 | Raman | space group | P4/nmm | P4/nmm | ||
| Te | 181.1 | 140.3 | 159.1 | Raman | (Å) | 3.7078 | 3.8123 | |
| FeTe | 253.8 | 195.9 | IR | (Å) | 3.7078 | 3.8123 | ||
| Fe | 283.0 | 196.9 | Raman | (Å) | 6.0326 | 6.2515 | ||
| Fe | 276.2 | 215.7 | 196.3 | Raman | 0 | 0 | ||
| FeTe | 321.2 | 250.6 | IR | 0.2704 | 0.2813 |
To compare with the observed phonon modes, we have calculated the non-magnetic electronic structure and the zone-center phonons of -FeTe within the framework of density-functional perturbation theory (DFPT). We applied the plane-wave basis method with the local (spin) density approximation for the exchange-correlation potentials pw while the generalized gradient approximation (GGA) of Perdew-Burke-Ernzerhof pbe was also tested without meaningful changes found. The ultrasoft pseudopotentialsvanderbilt were used to model the electron-ion interactions. After the full convergence test, the cutoffs of kinetic energy for the wave function and for the charge-density were respectively 40 and 400 Ryd. And the gaussian smearing technique was performed on a uniform, 242412 lattice of points in reciprocal space. We then employed the DFPT to generate the dynamical matrix, from which the phonon frequencies and atomic displacements were derived.
The Fe1+yTe compounds (PbO-type structure) have a narrow range of variation in .schuster The experimental measurements show that the excess Fe atoms partially occupy the interstitial sites.bao This makes first-principles calculations complicated, because thousands of averages over sample disorder would be required, and for this reason it was necessary to neglect the excess Fe atoms in the phonon calculations, while the effect of different cell parameters (experimental and relaxed) on phonons is taken into account.
The cell parameters and calculated results are listed in Table I together with the experimental Raman data. It is worth emphasizing that the calculated results at zero temperature are compared to the results of Raman experiments performed at room temperature: this is because such a comparison ensures the same non-magnetic structures in each case, as the ground state of Fe1+yTe compounds at low temperature is magnetically ordered. The temperature effect can be included by noting that if only the temperature is increased while the other properties of the sample (such as the magnetic state) are unchanged, the measured phonons should soften by an amount equivalent to the energy required for the same vibration at higher temperatures. In this way it is possible to evaluate the effects of temperature when assigning the phonon modes.
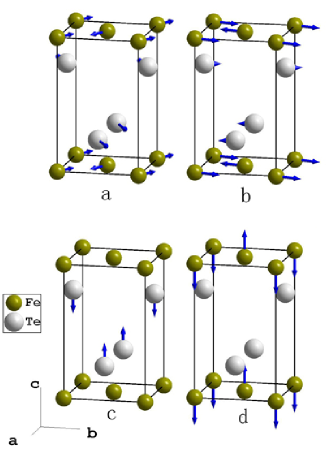
From Table I, the calculated phonon modes are completely consistent with the symmetry analysis. Qualitatively, all of the Raman-active modes were found and assigned according to the displacement patterns shown in Fig. 2. Quantitatively, the arrows in Fig. 2 indicate not only the vibration directions of the corresponding atoms but also, by their lengths, represent the relative vibration amplitudes compared with those of other atoms in the same mode. The calculated infra-red phonon frequencies are also reported in Table I, but are not considered further here.
By comparison with the experimental Raman data, the non-magnetic phonon calculations performed using relaxed cell parameters (denoted NM-relaxed in Table I) failed to provide a reasonable reproduction of the B1g mode frequency of Fe, even when considering the effect of temperature. This behavior is quite unlike the case in previously reported phonon calculations on iron-based superconductors such as LaFeAsO, where the relaxed parameters always led to more accurate results.SC Zhao We have also verified the calculated results using the experimental unit-cell parameters in combination with the energy-minimized internal Te positions (not shown here), which gives results similar to within frequency shifts of only 5cm-1. Quite generally, relaxation of the atomic positions balances the internal atomic forces in the unit cells, while relaxation of the unit-cell parameters further reduces the unit-cell stresses. The consistency of the phonon results for different ways of accomplishing this relaxation indicates that it is not the unit-cell stresses which are responsible for the discrepancies found when comparing with the experimental results. However, by using the experimental cell parameters (denoted NM-exp), the calculated B1g mode frequency is found to be in quite good agreement with the experimental data. This implies that the excess of Fe atoms is affecting the steady-state atomic positions, and further evidence for their effects on the electronic properties has been obtained for Fe1.076Te.gfchenunp This may also be one of the reasons for the instability of the materials (below).
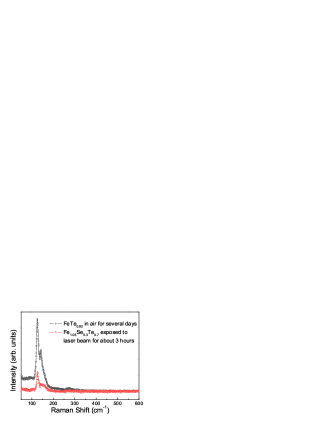
Finally, an interesting decomposition process is observed in the measurements. If the laser spot is held on a fixed point on the freshly cleaved surface of Fe1.03Se0.3Te0.7 in vacuum for more than 3 hours, the measured spectrum changes completely. The resulting spectrum is in fact quite similar to that obtained for FeTe0.92 after exposure to air for several days (Fig. 3). The origin of this effect may be found in the results of Refs. [PineTe, ; PineTeO2, ], from which it is clear that the anomalous spectrum originates from amorphous Te.PineTe Thus it is possible that Fe1+ySexTe1-x is not stable in air, and that one of its decomposition products is amorphous Te rather than TeO2. The decomposition may originate from its rather complicated phase diagram.Yeh ; ZQMao The decomposition of Fe1+ySexTe1-x in air for long periods, and through irradiation for shorter periods, may restrict the potential applications of this sytem, and even some types of experimental study.
In conclusion, we have measured the room-temperature, polarized Raman-scattering spectra of FeTe0.92 and Fe1.03Se0.3Te0.7 single crystals. We performed first-principles electronic band-structure calculations, and used these in combination with a symmetry analysis both to identify the phonon modes of -FeTe and to compute their frequencies. When Te ions are partially substituted by Se ions in superconducting Fe1.03Se0.3Te0.7, only the B1g mode of the Fe atom can be observed, presumably due to the effect of random Te replacement by Se in destroying the periodic potential of the Te atoms. The frequency of the Fe B1g mode is lower in the superconductor than in the parent compound -FeTe. It is noteworthy to find that Fe1+ySexTe1-x is not quite stable in air, one of the decomposition products being identified as amorphous Te. By providing detailed information on Raman phonons in FeTe-series supercondutors, this work opens the way to further studies of the coupled structural, magnetic, and electronic properties of these systems.
We thank Bruce Normand for fruitful discussions and for a critical reading of the manuscript. This work was supported by the National Basic Research Program of China (Grant Nos. 2006CB9213001 and 2006CB601002) and by the NSFC (Grant Nos. 10574064 and 20673133).
References
- (1) Y. Kamihara, T. Watanabe, M. Hirano, and H. Hosono, J. Am. Chem. Soc. 130, 3296 (2008).
- (2) X. H. Chen, T. Wu, G. Wu, R. H. Liu, H. Chen, and D. F. Fang, Nature (London) 453, 761 (2008).
- (3) G. F. Chen, Z. Li, D. Wu, G. Li, W. Z. Hu, J. Dong, P. Zheng, J. L. Luo, and N. L. Wang, Phys. Rev. Lett. 100, 247002 (2008).
- (4) Z. A. Ren, G. C. Che, X. L. Dong, J. Yang, W. Lu, W. Yi, X. L. Shen, Z. C. Li, L. L. Sun, F. Zhou, and Z. X. Zhao, Europhys. Lett. 83, 17002 (2008).
- (5) H. H. Wen, G. Mu, L. Fang, H. Yang, and X. Y. Zhu, Europhys. Lett. 82, 17009 (2008).
- (6) M. Rotter, M. Tegel, and D. Johrendt, Phys. Rev. Lett. 101, 107006 (2008).
- (7) G. F. Chen, Z. Li, G. Li, W. Z. Hu, J. Dong, P. Zheng, N. L. Wang, and J. L. Luo, Chin. Phys. Lett. 25, 3403 (2008).
- (8) K. Sasmal, B. Lv, B. Lorenz, A. Guloy, F. Chen, Y. Xue, and P. C. W. Chu, Phys. Rev. Lett. 101, 107007 (2008).
- (9) N. Ni, S. L. Bud’ko, A. Kreyssig, S. Nandi, G. E. Rustan, A. I. Goldman, S. Gupta, J. D. Corbett, A. Kracher, and P. C. Canfield, Phys. Rev. B 78, 014507 (2008).
- (10) G. F. Chen, Z. Li, J. Dong, G. Li, W. Z. Hu, X. D. Zhang, X. H. Song, P. Zheng, N. L. Wang, and J. L. Luo, Phys. Rev. B 78, 224512 (2008).
- (11) X. C. Wang, Q. Q. Liu, Y. X. Lv, W. B. Gao, L. X. Yang, R. C. Yu, F. Y. Li, and C. Q. Jin, Solid State Communications 148, 538 (2008).
- (12) M. J. Pitcher, D. R. Parker, P. Adamson, S. J. C. Herkelrath, A. T. Boothroyd, and S. J. Clarke, Chem. Commun. 5918, (2008).
- (13) J. H. Tapp, Z. J. Tang, B. Lv, K. Sasmal, B. Lorenz, C. W. Chu, and A. M. Guloy, Phys. Rev. B 78, 060505 (2008).
- (14) C. de la Cruz, Q. Huang, J. W. Lynn, J. Y. Li, W. Ratcliff, J. L. Zarestky, H. A. Mook, G. F. Chen, J. L. Luo, N. L. Wang, and P. C. Dai, Nature 453, 899 (2008).
- (15) F. C. Hsu, J. Y. Luo, K. W. Yeh, T. K. Chen, T. W. Huang, P. M. Wu, Y. C. Lee, Y. L. Huang, Y. Y. Chu, D. C. Yan, and M. K. Wu, Proc. Natl. Acad. Sci. U. S. A. 105, 14262 (2008).
- (16) K. W. Yeh, T. W. Huang, Y. L. Huang, T. K. Chen, F. C. Hsu, P. M. Wu, Y. C. Lee, Y.Y. Chu, C. L. Chen, J. Y. Luo, D. C. Yan, and M. K. Wu, Europhys. Lett. 84, 37002 (2008).
- (17) P. Terzieff and K. L. Komarek, Monatshefte für Chem. 109, 651 (1978).
- (18) W. Schuster, H. Mkiler, and K. Komarek, Monatshefte für Chem. 110, 1153 (1979).
- (19) G. F. Chen, Z. G. Chen, J. Dong, W. Z. Hu, G. Li, X. D. Zhang, P. Zheng, J. L. Luo, and N. L. Wang, unpublished (arXiv:0811.1489).
- (20) V. G. Hadjiev, M. N. Iliev, K. Sasmal, Y.-Y. Sun, and C. W. Chu, Phys. Rev. B 77, 220505(R) (2008).
- (21) S. C. Zhao, D. Hou, Y. Wu, T.-L. Xia, A. M. Zhang, G. F. Chen, J. L. Luo, N. L. Wang, J. H. Wei, Z. Y. Lu, and Q. M. Zhang, Supercond. Sci. Technol. 22, 015017 (2009).
- (22) A. P. Litvinchuk, V. G. Hadjiev, M. N. Iliev, B. Lv, A. M. Guloy, and C. W. Chu, Phys. Rev. B 78, 060503 (2008).
- (23) P. Giannozzi et al., http://www.quantum-espresso.org.
- (24) J. P. Perdew, K. Burke, and M. Ernzerhof, Phys. Rev. Lett. 77, 3865 (1996).
- (25) D. Vanderbilt, Phys. Rev. B 41, 7892 (1990).
- (26) W. Bao, Y. Qiu, Q. Huang, M. A. Green, P. Zajdel, M. R. Fitzsimmons, M. Zhernenkov, M. Fang, B. Qian, E. K. Vehstedt, J. Yang, H. M. Pham, L. Spinu, and Z. Q. Mao, unpublished (arXiv:0809.2058).
- (27) M. Rotter, M. Tegel, I. Schellenberg, W. Hermes, R. Pöttgen, and D. Johrendt, Phys. Rev. B 78, 020503(R) (2008).
- (28) A. S. Pine and G. Dresselhaus, Phys. Rev. B 4, 357 (1971).
- (29) A. S. Pine and G. Dresselhaus, Phys. Rev. B 5, 4087 (1972).
- (30) M. H. Fang, H. M. Pham, B. Qian, T. J. Liu, E. K. Vehstedt, Y. Liu, L. Spinu, Z. Q. Mao, Phys. Rev. B 78, 224503 (2008).