Hydrogen Dissociation and Diffusion on Transition Metal(=Ti,Zr,V,Fe,Ru,Co,Rh,Ni,Pd,Cu,Ag)-doped Mg(0001) Surfaces
Abstract
The kinetics of hydrogen absorption by magnesium bulk is affected by two main activated processes: the dissociation of the H2 molecule and the diffusion of atomic H into the bulk. In order to have fast absorption kinetics both activated processed need to have a low barrier. Here we report a systematic ab-initio density functional theory investigation of H2 dissociation and subsequent atomic H diffusion on TM(=Ti,V,Zr,Fe,Ru,Co,Rh,Ni,Pd,Cu,Ag)-doped Mg(0001) surfaces. The calculations show that doping the surface with TM’s on the left of the periodic table eliminates the barrier for the dissociation of the molecule, but the H atoms bind very strongly to the TM, therefore hindering diffusion. Conversely, TM’s on the right of the periodic table don’t bind H, however, they do not reduce the barrier to dissociate H2 significantly. Our results show that Fe, Ni and Rh, and to some extent Co and Pd, are all exceptions, combining low activation barriers for both processes, with Ni being the best possible choice.
I Introduction
Hydrogen is regarded by many as a possible energy vehicle (or fuel) for future mobile applications, and has been targeted to replace the current use of liquid hydrocarbons in the next few decades schlapzutt01 . Unlike fossil fuels, it is an environmentally friendly, non-polluting fuel simply because its combustion product is water, providing it is produced by renewable energy resources, obviously.
One of the main challenges faced by the development of the so called hydrogen economy is the capability of storing hydrogen safely and efficiently. For mobile applications the storage materials need to satisfy a number of requirements: i) they need to be capable of storing hydrogen in excess of 6.5% in weight, ii) the kinetics of absorption has to be fast, i.e. with time scales of minutes, and iii) the temperature at which they release hydrogen (the decomposition temperature) needs to be ideally in the range 20-100oC. Cyclability of the material is also a desired property.
Metal hydrides are natural hydrogen storing materials, and the relatively strong bonds between hydrogen and the host metal satisfy the safety requirement. Unfortunately, however, no material which has all the properties mentioned above exists today (see for example the review by Sakintuna et al. sakintuna07 ).
Magnesium hydride, MgH2, satisfies some of the above requirements. It has high storage capacity (7.6 wt %), good cyclability and it is relatively inexpensive. However, its enthalpy of formation is too high (-76 kJ/mol), requiring temperatures in excess of 300oC to decompose it into H2 and Mg bulk. The formation of the hydride also has slow kinetics huot99 ; zaluska01 , making this material not good enough. However, MgH2 represents a good test material to study how various treatments can affect its properties. In particular, it has been found that by doping the material with transition metals can weaken the Mg-H bond and reduce the stability of the hydride (see for example zaluska99 ; bobet02 ; song04 ; shang04 ; vegge05 ; bhat07 , and references therein). Ball-milling further enhance the sorption processes by increasing the number of possible paths for the diffusion of H (see for example zaluski95 ; zaluska99 ; shang04 and references therein). A new method of chemical fluid deposition in supercritical fluids (SCF) has also recently been used on metal hydrides bobet07 . This method offers the same sorption properties of ball milled samples, but with a hugely improved cyclability (the catalytic effect of the metal being almost constant for SCF samples, while decreasing for ball-milled samples after about 100 cycles) and in particular shows that the catalytic effect of Ni on hydrogen sorption processes is higher than that of Pd.
Liang et al. liang99 and Schulz, Liang & Huot schultz01 found that V and Ti are better catalysts than Ni for hydrogen absorption and desorption from MgH2-metal composites, showing faster absorption kinetics at T 300 oC and faster desorption kinetics above 250 oC than other 3-elements investigated. They also found an enthalpy of hydride formation for different catalysts similar to that of MgH2. By contrast, theoretical calculations and experimental results of Song et al. song04 and Shang et al. shang04 led to different conclusions. They found that the stability of MgH2-Ni is reduced when compared to that of MgH2-Ti. Moreover (and contrary to the experimental findings of Liang et al. liang99 ), the heat of formation of the metal-doped MgH2 hydrides is smaller than that of MgH2. In particular, MgNiH2 shows a smaller enthalpy of formation than MgTiH2.
Zaluska et al. zaluska99 used Li, Al, V, Mn, Zr and Y as catalysts for the hydrogenation/dehydrogenation of Mg alloy samples. According to their results, V remarkably improves the H absorption kinetics, but Zr is better for lower temperature H. However, the best kinetic results are achieved with mixtures, i.e. V + Zr or Mn + Zr Mg alloys. Bobet et al. bobet00 have shown that the hydrogen storage properties are enhanced when using reactive mechanical alloying of Mg + 10 wt.% Co, Ni and Fe mixtures. Co, unlike Ni, is found to significantly increase the quantity of MgH2 formed. However, Bobet et al. bobet02 later reported that the hydrogen sorption properties of Mg-Co mixtures are less effective than those reported for MgH2-metal mixtures. Gutfleish et al. gutf05 have recently presented results achieved with a Mg sample alloyed with Ni (1 wt %) and Pd (0.2 wt %). Their sample shows excellent hydrogen absorption/desorption kinetics and cyclic stability, exhibiting an overall reversible H2 storage capacity of 6.3 wt. %.
Previous theoretical and experimental investigations over pure surfaces of transition metals belonging to the left of the periodic table have shown that H2 dissociation is promoted, but also that the bonding between the hydrogen atoms and the metal is strong (see ward80 and references therein; see also christm88 ; hamnorNAT95 ).
In our previous paper pozzo we have shown that H2 dissociation on the metal(Ni,Ti)-doped Mg surface has a barrier similar to that on the corresponding pure metal (111) surface, and also that the strength of the hydrogen-metal bond is similar to that on the pure metal surface. The strength of the H-TM (TM=Ni,Ti) bonding was found to be correlated to the height of the diffusion barrier. We therefore might expect to see an analogous trend in the dissociation and diffusion barriers by doping the Mg(0001) surface with various transition metals. In fact, we will show that the elements on the left of the periodic table make the H2 dissociation barrier to vanish but are responsible for high diffusion barriers, while those on the right cannot catalyse the dissociation of the molecule. Among the elements studied here, we found that Fe, Ni and Rh, and to some extent Co and Pd offer a good compromise between the promotion of dissociation and the hindering of diffusion, and qualify as good catalysts for accelerating the kinetics of hydrogen absorption.
II Computational method
All the DFT calculations were performed with the ab-initio simulation package VASP vasp using the projector augmented wave (PAW) method blochl94 ; kresse99 and the PBE exchange-correlation functional pbe . An efficient charge density extrapolation was used to speed up the calculations alfe99 . We used a plane-wave basis set to expand the electronic wave-functions with the same plane-wave energy cut-off of 270 eV as in pozzo , which guarantees convergence of adsorption energies within 1 meV. Surfaces were modeled using periodic slabs, with 5 atomic layers and a vacuum thickness of 10 Å. The topmost three atomic layers were allowed to relax, while the bottom two were held fixed to the positions of bulk Mg. Calculations were performed using 2x2 surface unit cells, with 9x9x1 k-point grids and replacing one of the four surface Mg atoms by one TM(=Ti,V,Zr,Fe,Ru,Co,Rh,Ni,Pd,Cu,Ag) atom. These settings were extensively tested and guarantee convergence of activation energies to better than 0.02 eV. Activation energies have been calculated with the nudged elastic band (NEB) method neb using 17 replicas, which proved to be sufficient to reach convergence of activation energies to better than 0.01 eV, and display all the main features of the minimum energy path. The initial state of the NEB calculations for the dissociation of H2 is represented by the hydrogen molecule sitting on top the TM at a distance of 5 Å, and the final state is the most energetically favourable among four possible adsorption sites for the two dissociated hydrogen atoms (see Ref. pozzo for details). For the diffusion process, the initial state is represented by the final state of the dissociation process, and the final state by a configuration where one of the two hydrogen atoms has been displaced into a nearby hollow site (see details in Section III.2).
III Results
In the following section we report calculations for the bulk structural parameters of the various elements investigated, as a test of the quality of the PAW and the PBE exchange-correlation functionals. In Sec. III.2 we report results for the H2 dissociation and diffusion barriers, which we also analyse in terms of the position of the centre of the -band of the various transition metals employed as dopants on the Mg(0001) surface.
| (Å), | k0 (GPa) | VE, rcore (Å) | Reference | |
|---|---|---|---|---|
| Ti | 2.92, 1.583 | 120 | 3d24s2, 1.5 | Ref. pozzo, |
| 2.92, 1.583 | 118 | Ref. jahna05, | ||
| Expt. | [2.95, 1.59] | [105] | Ref. kittel, | |
| V | 3.00 | 179 | 3s23p63d34s2, 1.2 | This work111Reported values do not include room temperature thermal expansion. |
| 3.00 | 182 | Ref. vermod07, | ||
| 2.99 | 185 | Ref. jahna05, | ||
| Expt. | [3.00] | [162] | Ref. kittel, | |
| Fe | 2.84 | 169 | 3d64s2, 1.2 | This work111Reported values do not include room temperature thermal expansion. |
| 2.71 | 281 | Ref. mehpap96, 333From tight-binding non-magnetic calculations. | ||
| Expt. | [2.87] | [168] | Ref. kittel, | |
| Co | 2.49, 1.617 | 212 | 3d74s2, 1.2 | This work111Reported values do not include room temperature thermal expansion. |
| 2.40, 1.62 | 384 | Ref. mehpap96, 333From tight-binding non-magnetic calculations. | ||
| Expt. | [2.51, 1.62] | [191] | Ref. kittel, | |
| Ni | 3.52 | 194 | 3d84s2, 1.2 | Ref. pozzo, |
| 3.52 | 194 | Ref. kresshafn00, | ||
| 3.52 | 201 | Ref. pozzo07, | ||
| Expt. | [3.52] | [186] | Ref. kittel, | |
| Cu | 3.64 | 136 | 3d104s1, 1.2 | This work111Reported values do not include room temperature thermal expansion. |
| 3.63 | 142 | Ref. dasilva06, | ||
| Expt. | [3.61] | [137] | Ref. kittel, | |
| Zr | 3.24, 1.602 | 93 | 4s24p64d25s2, 1.3 | This work111Reported values do not include room temperature thermal expansion. |
| 2.99, 1.86 | 108 | Ref. mehpap96, 222From tight-binding calculations. | ||
| 3.23, 1.600 | 101 | Ref. yaoyou07, | ||
| Expt. | [3.23, 1.59] | [83] | Ref. kittel, | |
| [3.23, 1.59] | [92 3] | Ref. zhao05, | ||
| Ru | 2.72, 1.578 | 310 | 4d75s1, 1.4 | This work111Reported values do not include room temperature thermal expansion. |
| 2.68, 1.59 | 360 | Ref. mehpap96, 333From tight-binding non-magnetic calculations. | ||
| 2.69, 1.606 | 322 | Ref. yao07, | ||
| Expt. | [2.71, 1.58] | [321] | Ref. kittel, | |
| Rh | 3.84 | 251 | 4d85s1, 1.3 | This work111Reported values do not include room temperature thermal expansion. |
| 3.83 | 259 | Ref. ganduglia99, | ||
| 3.86 | 258 | Ref. pozzo07, | ||
| Expt. | [3.80] | [270] | Ref. kittel, | |
| Pd | 3.95 | 163 | 4d10, 1.3 | This work111Reported values do not include room temperature thermal expansion. |
| 3.95 | 163 | Ref. dasilva06, | ||
| Expt. | [3.89] | [181] | Ref. kittel, | |
| Ag | 4.17 | 88 | 4d105s1, 1.3 | This work111Reported values do not include room temperature thermal expansion. |
| 4.20 | 87 | Ref. li02, | ||
| Expt. | [4.09] | [101] | Ref. kittel, |
III.1 Bulk parameters
We obtained bulk structural properties of the pure transition metals by calculating energy versus volume curves, and fitting them to a Birch-Murnaghan equation of state murna . The elements investigated here were: Zr, V, Fe, Ru, Co, Rh, Pd, Cu and Ag, together with Ti and Ni already presented in Ref. pozzo . The bulk parameters were derived using 13x13x13 and 18x18x12 k-point grids for those metals with the cubic and the hexagonal structure respectively. The corresponding standard version of the PAW functional was used for all of them, with the exception of V and Zr for which we used the version of the PAW treating respectively the 3s23p63d34s2 and 4s24p64d25s2 electrons in valence (which give results closer to the experimental values than the standard versions of the PAW functionals). Calculated bulk parameters values are reported in Table 1, together with the details of the PAW potentials, which include the electrons treated in valence and the core radii. Overall, the lattice parameter is always overestimated, and the bulk modulus is underestimated with respect to the experimental values. This is in agreement with the findings from previous theoretical calculations, and is typical of the PBE functional. Among the elements investigated, only Ni, Co and Fe are magnetic. We find a magnetic moment of 0.63 pozzo , 1.70 and 2.15 /atom for Ni, Co and Fe respectively, which are in agreement with the corresponding experimental values of 0.61, 1.71 and 2.22 /atom kittel . However, as discussed in the next Section, Fe is the only element which required spin-polarised calculations.
| Metal surface | Ediss (eV) |
|---|---|
| pure Mg | 0.87111Ref. pozzo, ., 0.4222Ref. hjelmberg79, for a jellium system.,333Ref. bird93, , from DFT LDA calculations and PES. This lower value as compared to other calculations is explained as due to the well known LDA over-binding., 0.5444Ref. johansson81, for a jellium system and PES.,555Ref. norskhoum81, for a jellium system and PES., 1.15666Ref. vegge04, from DFT RPBE., 1.05777Ref. du05, , from DFT PAW RPBE calculations., 0.95888Ref. arboleda04, from PES calculations. |
| Expt. | 1.0999Ref. sprunplu91, (see comments in the main text)., 0.750.15101010Ref. johansson06, (see comments in the main text). |
| Ti-doped Mg | null111Ref. pozzo, ., negligible777Ref. du05, , from DFT PAW RPBE calculations. |
| V-doped Mg | null111111This work. |
| Fe-doped Mg | 0.03111111This work. |
| Co-doped Mg | 0.03111111This work. |
| Ni-doped Mg | 0.06111Ref. pozzo, . |
| Cu-doped Mg | 0.56111111This work. |
| Zr-doped Mg | null111111This work. |
| Ru-doped Mg | null111111This work. |
| Rh-doped Mg | 0.04111111This work. |
| Pd-doped Mg | 0.39111111This work. |
| Ag-doped Mg | 1.18111111This work. |
III.2 H2 dissociation and diffusion
The activation barriers for H2 dissociation over the various metal-doped Mg surfaces are reported in Table 2, where we also report two experimental values for the H2 dissociation/recombination on the Mg(0001) surface. The value reported in Ref. sprunplu91 ( 1.0 eV) refers to the recombination barrier (which, in this particular case, is similar to the dissociation barrier) identified with the barrier for desorption from the surface. This value was not directly measured in the thermal programmed desorption (TPD) experiments of Ref. sprunplu91 because complete desorption spectra as function of temperature could not be taken, due to the onset of Mg sublimation at 450 K which overlaps with the temperature at which H2 desorbs. However, it was noted that the onset of H2 desorption appears at 425 K, which is similar to that of the H/Be(0001) system that has a determined desorption energy of 1 eV ray90 , and so, by analogy, it was suggested that the activation energy for desorption might be the same on the H/Mg(0001) system too. The value reported in Ref. johansson06 (0.750.15 eV) has been obtained by the interpretation of TPD experiments performed on a 400 Å thick magnesium film. This value is in good agreement with the calculated PBE dissociation energy, but is significantly lower than the dissociation energies calculated with RPBE by Vegge vegge04 and Du et al. du05 which are 1.15 and 1.05 eV respectively. It should be noted, however, as pointed out in Ref. johansson06 , that the experimental situation may not be the same as the theoretical ones, due to the possible presence of steps on the surface which might be more reactive sites and lower the H2 dissociation barrier. Moreover, the inferred dissociation energy of 0.750.15 eV is based on the use of the Arrhenius relations with assumed pre-factors of Hz. As showed in Refs. alfe06 and alfe07 , these values could be underestimated by more than two orders of magnitudes because the classical pre-factors do not include the enhancement due to the large entropy increase as the molecules leave the surface, in which case the activation energy could be up to eV higher.
The geometry of adsorption of the H atoms on the metal-doped Mg surfaces listed in Table 2 appears to be somewhat correlated to the height of the dissociation barrier. We find that when the barrier is large (i.e., for Cu, Pd, Ag) the H atoms fall into filled hollow sites, and when the barrier is null (i.e., for Ti, Zr, V and Ru) they fall into empty hollow sites. In between there are elements showing a small energy barrier for which the preference towards filled hollow sites (i.e., for Ni) instead of empty hollow sites (i.e., for Fe, Co and Rh) is weaker (less than about 30 meV).
Fe is the only dopant for which magnetic calculations are really required, with the total magnetic moment on the Fe atom being of 2.8 and 2.5 in the initial and final state of the dissociation process respectively (Co is magnetic too, but when used as dopant of the Mg surface our calculations show that it can be treated as non-magnetic). In particular, non-magnetic calculations for the Fe-doped surface would give significantly different results, reducing the dissociation barrier to almost zero and increasing by 60 % the energy difference between the initial and final states.
As we noted before pozzo , the activation barrier for the dissociation of H2 over a metal-doped Mg surface is similar to that on the corresponding pure metal surface. For example, in the case of Cu our calculated barrier is 0.56 eV, which is close to the dissociation barrier of about 0.5 eV suggested by experiments and other DFT (GGA and PBE) calculations hamnorNAT95 ; hammer94 ; gross94 ; murhog98 ; slham02 ; sakgross03 over the pure Cu(111) surface. In addition, we find that the energy difference between the final state and the initial state is -0.19 eV, which is in line with the findings of Kratzer et al. kratzer96 , who found that H2 dissociation on the pure Cu(111) surface is exothermic, with a gain of 0.2 eV. On the Pd-doped surface we calculate a dissociation barrier of 0.39 eV, which reduces to 0.30 eV when a smaller 5x5x1 k-points grid is used (instead of the 9x9x1 grid). The reason for mentioning the result obtained with the coarser grid is because we want to compare with the findings of Dong, Kresse & Hafner dong97 , who performed calculations with a similar grid for the dissociation of H2 on the Pd(111) surface, and found a barrier of 0.29 eV when the molecule dissociates on top a Pd atom, therefore a value very close to our value of 0.30 eV on the Pd-doped Mg surface (note, however, that they report the bridge-bridge as the preferred dissociation path, with a barrier of only 70 meV, which is consistent with the theoretical value found by Nobuhara et al. nobuhara04 and in good agreement with the experimental value of 50 meV resch94 ). Finally, in the case of Ag, our activation barrier of 1.18 eV is in agreement with the experimental results which predict a dissociation barrier on Ag(111) larger than that on Cu and somewhat larger than 0.8 eV healey95 , and we also agree with previous theoretical calculations xu05 also obtained on the pure Ag(111) surface, which reported an activation energy of 1.11 eV. Fig. 1 shows the MEP’s for hydrogen dissociation on a TM V, Fe, Co, Cu, Zr, Ru, Rh, Pd, Ag doped Mg surface investigated here, together with those on a TMNi, Ti -doped Mg surface that we have reported previously pozzo .
| Surface | Ediss | E | Ediff | E | ||
|---|---|---|---|---|---|---|
| (eV) | (eV) | (eV) | (eV) | (eV) | (Å) | |
| Mg pure111Ref. pozzo, . | – | 0.87 | -0.04 | 0.11 | -0.02 | 0.9 |
| Ag-doped Mg222This work. | -4.14 | 1.18 | 0.15 | null | -0.18 | 0.7 |
| Cu-doped Mg222This work. | -2.27 | 0.56 | -0.19 | 0.10 | 0.04 | 0.7 |
| Pd-doped Mg222This work. | -1.84 | 0.39 | -0.18 | 0.08 | 0.07 | 1.0 |
| Ni-doped Mg111Ref. pozzo, . | -0.79 | 0.06 | -0.66 | 0.27 | -0.09 | 1.5 |
| Rh-doped Mg222This work. | -0.75 | 0.04 | -0.72 | 0.31 | -0.05 | 1.8 |
| Co-doped Mg222This work. | -0.16 | 0.03 | -1.03 | 0.41 | 0.07 | 2.0 |
| Ru-doped Mg222This work. | -0.14 | null | -1.20 | 0.54 | 0.26 | – |
| Fe-doped Mg222This work. | -0.72 | 0.03 | -0.76 | 0.30 | 0.17 | 2.0 |
| V-doped Mg222This work. | +0.82 | null | -1.39 | 0.73 | 0.68 | – |
| Zr-doped Mg222This work. | +1.32 | null | -1.46 | 0.94 | 0.94 | – |
| Ti-doped Mg111Ref. pozzo, . | +1.08 | null | -1.34 | 0.75 | 0.74 | – |
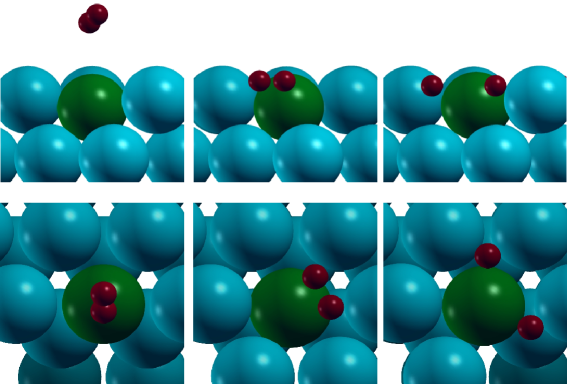
Figure 2 shows the dissociation of H2 on the Ag-doped Mg surface, which is found to have the largest barrier value among all the dopants investigated here (since this barrier is larger than that on pure Mg, obviously H2 will not dissociate onto this site, but will rather choose some regions of the Mg surface free of Ag). For Fe, Co, Cu, Rh and Pd doped Mg surfaces, the images at the IS, TS and FS of the NEB are similar, with the H2 molecule at the TS sitting closer (i.e., Cu and Pd) or further away from the surface (i.e., Fe, Co and Rh) compared to the behavior shown in our previous paper pozzo for the Ni-doped Mg surface (see values reported in Table 3). For Ag we note that the hydrogen molecule at the TS dissociates closer to the surface than on the Ni-doped Mg surface, and that it does so on a side of the dopant atom (see Figure 2).
A closer look at the geometry of the dissociation process shows an interesting correlation between the height of the barrier and the geometry of the transition state. The dissociation of molecular hydrogen into two hydrogen atoms happens on-top of the dopant atom when Fe, Co, Ni or Rh are used as dopants, slightly shifted to the side when Pd and Cu are the metals used as dopants, and fully on the side when Ag is the dopant. In other words, it appears that H2 dissociates on top of the dopant atom for those doped Mg surfaces which show a very small barrier (i.e., Fe, Co, Ni and Rh), slightly shifted to the side of the dopant atom for the Pd and Cu doped Mg surfaces having a non negligible barrier, and completely on the side of the dopant atom on the Ag-doped Mg surface which shows a very large dissociation barrier.
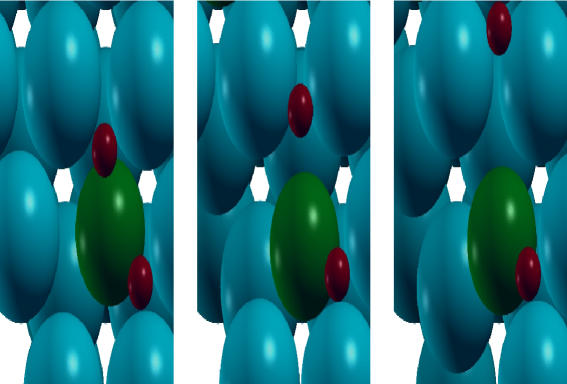
The dissociation of the H2 molecule is only the first step for the absorption of hydrogen. A second fundamental step is the diffusion of the products away from the catalytic site. To study this, we performed NEB calculations in which the initial state was the final state of the dissociation process, and the final state was obtained by displacing one H into a nearby hollow site. Figure 3 shows the diffusion path of one of the two hydrogen atoms on the Fe-doped Mg surface as an example. The MEP’s for the diffusion processes are also shown in Fig. 1. We observe that the height of the diffusion barrier Ediff is strongly anti-correlated to the height of the dissociation barrier Ediss (see Table 3). In fact, Ti, V, Zr and Ru have zero dissociation barriers, but they bind the products very strongly, which results in high values of Ediff. By contrast, Ag, Cu and Pd produce large dissociation barriers, but they have low diffusion barriers (in fact, no barrier at all for Ag). In between there are Fe, Ni and Rh, which represent the best compromise in combining low activation barriers for both processes. Ni is the best possible choice overall.
We note in passing that the catalytic effect of Ni dopant on MgH2 for the dehydrogenation process (not studied here) has been experimentally demonstrated by Jensen et al. jensen06 , showing an activation energy reduced by 0.5 eV with respect to that obtained with pure MgH2.
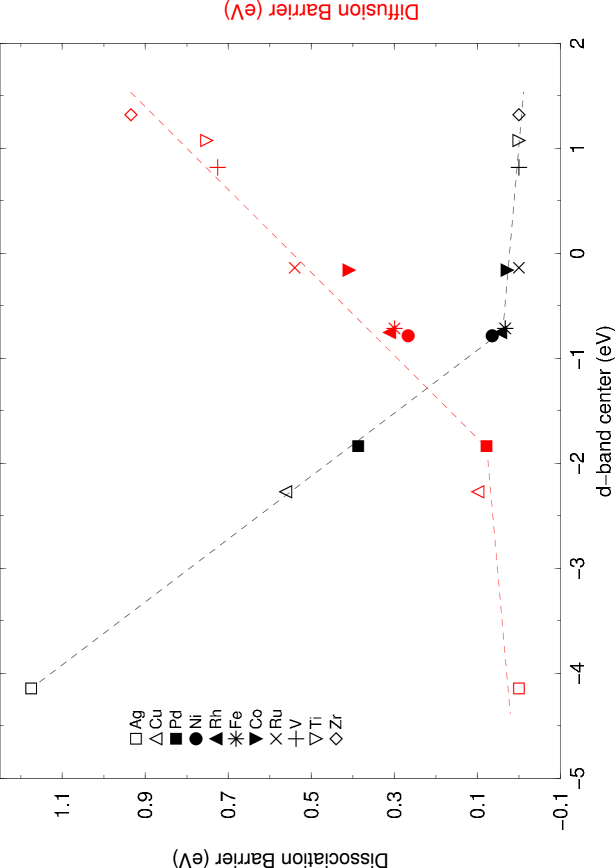
It is interesting to correlate the height of the barriers with the position of the -band of the transition metal dopant with respect to the Fermi energy (here we define the -band, , as the projection of the electronic density of states onto type spherical harmonics). In particular, it is useful to consider the first energy moment of the -band, or -band centre, defined as , where is some cutoff energy which we chose to be 7 eV above the Fermi energy. In Fig. 4 we plot the dissociation and the diffusion energy barriers, Ediss and Ediff, against for all the systems explored (see Table 3). It is obvious that the heights of the barriers are strongly correlated with the position of the -band centre.
The step limiting process in the hydrogen absorption is the one with the largest energy barrier between dissociation and diffusion, so the best dopant is the one which minimizes the largest energy barrier. It is customary to define the activity of a catalyst in terms of the rate of the reaction which is being catalysed. This can often be accurately approximated by an Arrhenius relation, and therefore the natural logarithm of the rate is proportional to the negative of the activation energy barrier. We can then interpret the maximum of the two barriers shown in Fig. 4 as indicating the activity of the catalyst. If we draw a line across these points, we see that the various transition metals investigated here fit on an inverse volcano plot, with Ni, Fe and Rh sitting near the top of the volcano, and therefore being the most active catalysts.
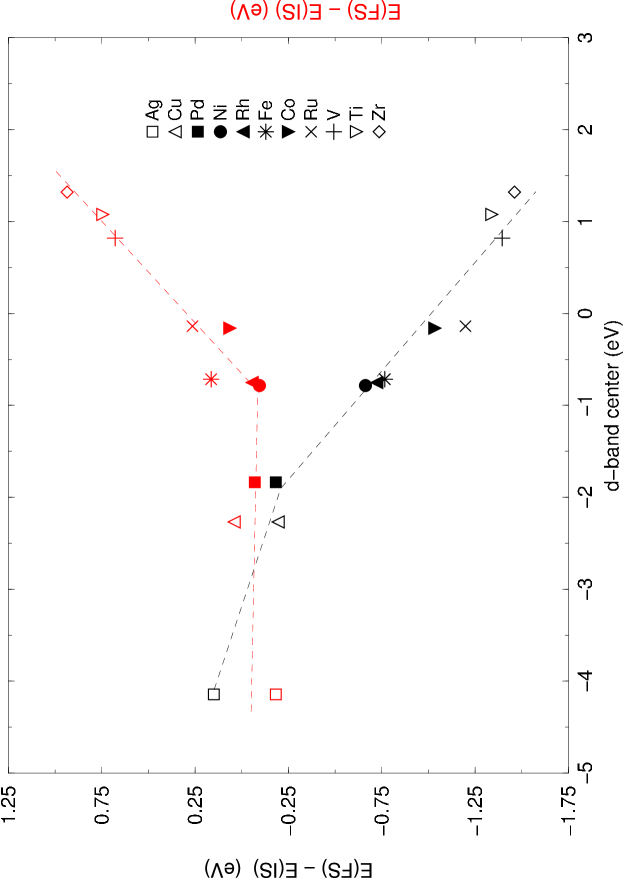
As a matter of interest, in Fig. 5 we plot the energy difference between the final and the initial state (both for the dissociation and for the diffusion process) as a function of the -band centre. We can observe some correlation between the two quantities, although this is less strong than that observed in Fig. 4 for the height of the two energy barriers. If follows that the correlation between the energy barriers and is also weaker than that between the energy barriers and the -band centre, leaving the latter a better parameter to characterize the catalyst.
From an inspection of Figs. 4 and 5 the
-band centre correlation is evident, and points to an ideal
-band centre value of about -1.29 eV. This value cannot be
obtained with any of the TM-doped Mg surfaces investigated
here. Recently, Vegge et al. vegge05 have investigated
magnesium 3d TM alloys. They showed that the -band centre values of
the expanded alloys obtained with TM belonging to the first raw of the
Periodic Table range from +0.93 to -6.88 eV going from MgSc to
MgZn. In particular, MgCu gives a value of -2.37 eV while the neighbor
MgNi -0.82 eV. It would be interesting to broaden their investigation
to 4 and 5 TMs to see if the optimal -band centre value of
about -1.3 eV that we have extrapolated here could be obtained with
some alloys, but this is beyond the purpose of the present
investigation.
IV Conclusions
We have performed here a systematic DFT/PBE study of hydrogen dissociation and subsequent diffusion over Mg surfaces doped with different transition metals. The dopants investigated were Ti, Zr, V, Fe, Ru, Co, Rh, Ni, Pd, Cu and Ag. We have observed that the transition metals on the left of the periodic table (Ti, V, Zr), together with Ru, eliminate the dissociation barrier altogether, however, the products stick too strongly to the metal dopant, therefore hindering diffusion away from the catalytic site. This would result in a quick deactivation of the catalyst and therefore a slow absorption process. On the contrary, the transition metals on the right of the periodic table do not bind too strongly the H atoms (in fact, Ag does not bind them at all), allowing easy diffusion, however, their effect on the dissociation barrier is small. We have shown that these two opposite catalytic properties are well correlated to the position of the -band centre, according to the Hammer & Nørskov hamnor95 model. In fact, we have shown that the catalytic activity for the H absorption process can be described well by a volcano plot, with the most active catalysts Ni, Fe and Rh sitting near the top of the volcano.
Acknowledgements.
This work was conducted as part of a EURYI scheme award as provided by EPSRC (see www.esf.org.euryi). Calculations have been performed on the LCN cluster at University College London. We thank Sam French and Alvaro Amieiro for very useful discussions.References
- (1) Schlapbach L, and Züttel A, Hydrogen storage materials for mobile applications. Nature (London) 2001;414(6861):353-358.
- (2) Sakintuna B, Lamari-Darkrim F, and Hirscher M, Metal hydride materials for solid hydroge storage: a review. Int. J. Hydrogen Energy 2007;32(9):1121-1140.
- (3) Huot J, Liang G, Boily S, Van Neste A, Schulz R. Structural study and hydrogen sorption kinetics of ball-milled magnesium hydride. J Alloys Compd 1999;293-295:495-500.
- (4) Zaluska A, Zaluski L, Ström-Olsen JO. Structure, catalysis and atomic reactions on the nano-scale: a systematic approach to metal hydrides for hydrogen storage. Appl Phys A 2001;72(2):157-165.
- (5) Zaluska A, Zaluski L, Ström-Olsen JO. Nanocrystalline magnesium for hydrogen storage. J Alloys Compd 1999;288(1-2):217-225.
- (6) Bobet JL, Chevalier B, Darriet B. Effect of reactive mechanincal grinding on chemical and hydrogen sorption properties of the Mg+10 wt. Co mixture. J Alloys Compd 2001;330-332:738-742.
- (7) Song Y, Guo ZX, Yang R. Influence of selected alloying elements on the stability of magnesium dihydride for hydrogen storage applications: A first-principle investigation. Phys Rev B 2004;69(9):094205-094215.
- (8) Shang CX, Bououdina M, Song Y, Guo ZX. Mechanical alloying and electronic simulations of (MgH2+M) systems (M=Al, Ti, Fe, Ni, Cu and Nb) for hydrogen storage. Int J Hydrogen Energy 2004;29(1):73-80.
- (9) Vegge T, Hedegaard-Jensen LS, Bonde J, Munter TR, Nørskov JK. Trends in hydride formation energies for magnesium 3d transition metal alloys. J Alloys Compd 2005;386(1-2):1-7.
- (10) Bhat V, Rougier A., Aymard L., Nazri GA, and Tarascon JM. Enhanced hydrogen storage property of magnesium hydride by high surface area Raney nickel. Int. J. Hydrogen Energy 2007;32(18):4900-4906.
- (11) Zaluski L, Zaluska A, Tessier P, Ström-Olsen JO, Schulz R. Effects of relaxation on hydrogen absorption in Fe—Ti produced by ball-milling. J Alloys Compd 1995;227(1):53-57.
- (12) Bobet JL, Aymonier C, Mesguich D, Cansell F, Asano K, Akiba E. Particle decoration in super critical fluid to improve the hydrogen sorption cyclability of magnesium. J Alloys Compd 2007;429(1-2):250-254.
- (13) Liang G, Huot J, Boily S, Van Neste A, Schulz R. Catalytic effect of transition metals on hydrogen sorption in nanocrystalline ball milled MgH2-Tm (Tm=Ti, V, Mn, Fe and Ni) systems. J Alloys Compd 1999;292(1-2):247-252.
- (14) Schulz R, Liang G, Huot J. Hydrogen sorption in mechanically alloyed nanocrystalline and disordered materials. In: Dinesen et al., editors. Proceedings of the 22nd Risø International Symposium on Material Science: Science of Metastable and Nanocrystalline Alloys: Structure, Properties and Modelling. Risø National Laboratory, Roskilde, Denmark, 2001. p. 141-153.
- (15) Bobet J-L, Even C, Nakamura Y, Akiba E, Darriet B. Synthesis of magnesium and titanium hydride via reactive mechianical alloying Influence of 3d-metal addition on MgH2 synthesize. J Alloys Compd 2000;298(1-2):279-284.
- (16) Gutfleisch O, Dal Toè S, Herrich M, Handstein A, Pratt A. Hydrogen sorption properties of Mg-1 wt.% Ni-0.2 wt. % Pd prepared by reactive milling. J Alloys Compd 2005;404-406:413-416.
- (17) Ward JW. Electronic structuqre, bonding and chemisorption in metallic hydrides. J Less-Common Met 1980;73(1):183-192.
- (18) Christmann K. Interaction of hydrogen with solid surfaces. Surf Sci Rep 1988;9(1-3):1-163.
- (19) Hammer B, Nørskov JK. Why gold is the noblest of all the metals. Nature 1995;376(6537):238-240.
- (20) Pozzo M, Alfè D, Amieiro A, French S, Pratt A. Hydrogen dissociation and diffusion on Ni- and Ti-doped Mg(0001) surfaces. J Chem Phys 2008;128(9):094703-094713.
- (21) Kresse G, Furthmüller J. Efficient iterative schemes for ab initio total-energy calculations using a plane-wave basis set. Phys Rev B 1996;54(16):11169-11186.
- (22) Blöchl PE. Projector augmented-wave method. Phys Rev B 1994;50(24):17953-17979.
- (23) Kresse G, Joubert D. From ultrasoft pseudopotentials to the projector augmented-wave method. Phys Rev B 1999;59(3):758-1775.
- (24) Perdew JP, Burke K, Ernzerhof M. Generalized gradient approximation made simple. Phys Rev Lett 1996;77(18):3865-3868.
- (25) Alfè D. Ab initio molecular dynamics, a simple algorithm for charge extrapolation. Comp Phys Comm 1999;118(1):31-33.
- (26) Mills G, Jonsson H, Schenter GK. Reversible work transition state theory Application to dissociative adsorption of hydrogen. Surf Sci 1995;324(2-3):305-337. Henkelman G, Johnsson H. Improved tangent estimate in the nudged elastic band method for finding minimum energy paths and saddle points. J Chem Phys 2000; 113(22):9978-9985. Henkelman G, Uberuaga BP, Johnsson H. A climbing image nudged elastic band method for finding saddle points and minimum energy paths. J Chem Phys 2000; 113(22):9901-9904.
- (27) Kokalj A. Computer graphics and graphical user interfaces as tools in simulations of matter at the atomic scale. Comp Mater Sci 2003;28(2):155-168. Code available from http://www.xcrysden.org/.
- (28) Birch F. Finite elastic strain of cubic crystals. Phys Rev 1947;71(11):809-824.
- (29) Jahnátek M, Krajčí M, Hafner J. Interatomic bonding, elastic properties, and ideal strength of transition metal aluminides: A case study for Al3(V,Ti). Phys Rev B 2005;71(2):024101-024116.
- (30) Verma AK, Modak P. Structural phase transitions in vanadium under high pressure. Europhysics Letters 2008;81(3):37003(1-5).
- (31) Kittel C. Introduction to Solid State Physics, 7th ed. New York: Wiley, 1996.
- (32) Mehl MJ, Papaconstantopoulos DA. Applications of a tight-binding total-energy method for transition and noble metals: Elastic constants, vacancies, and surfaces of monatomic metals. Phys Rev B 1996;54(7):4519-4530.
- (33) Kresse G, Hafner J. First-principles study of the adsorption of atomic H on Ni(111), (100) and (110). Surf Sci 2000;459(3):287-302.
- (34) Pozzo M, Carlini G, Rosei R, Alfè D. Comparative study of water dissociation on Rh(111) and Ni(111) studied with first principles calculations. J Chem Phys 2007;126(16):164706-164717.
- (35) Da Silva JLF, Stampfl C, Scheffler M. Converged properties of clean metal surfaces by all-electron first-principles calculations. Surf Sci 2006;600(3):703-715.
- (36) Yaozhuang Nie, Youqing Xie. Ab initio thermodynamics of the hcp metals Mg, Ti, and Zr. Phys Rev B 2007;75:174117-174123.
- (37) Zhao Y et al. Thermal equations of state of the , , and phases of zirconium. Phys Rev B 2005;71():184119-184124.
- (38) Nie Yaozhuang, Xie Youqing, Peng Hongjian, Li Xiaobo. Ab initio thermodynamics of metals: Pt and Ru. Physica B 2007;395(1-2):121-125.
- (39) Ganduglia-Pirovano MV, Scheffler M. Structural and electronic properties of chemisorbed oxygen on Rh(111). Phys Rev B 1999;59(23):15533-15543.
- (40) Li WX, Stampfl C, Scheffler M. Oxygen adsorption on Ag(111): A density-functional theory investigation. Phys Rev B 2002;65(7):07540775425.
- (41) Hjelmberg H. Hydrogen chemisorption on Al, Mg and Na surfaces calculation of adsorption sites and binding energies. Surf Sci 1979;81(2):539-561.
- (42) Bird DM, Clarke LJ, Payne MC, Stich I. Dissociation of H2 on Mg(0001). Chem Phys Lett 1993;212(5):518-524.
- (43) Johansson PK. Chemisorption of molecular hydrogen on simple metal surfaces. Surf Sci 1981;104(2-3):510-526.
- (44) Nørskov JK, Høumoller A, Johansson PK, Lundqvist BI. Adsorption and dissociation of H2 on Mg surfaces. Phys Rev Lett 1981;46(4):257-260.
- (45) Vegge T. Locating the rate-limiting step for the interaction of hydrogen with Mg(0001) using density-functional theory calculations and rate theory. Phys Rev B 2004;70(3):035412-035418.
- (46) Du AJ, Smith SC, Yao XD, Lu GQ. First-principle study of adsorption of hydrogen on Ti-doped Mg(0001) surface. J Phys Chem B 2006;110(43):21747-21750.
- (47) Arboleda NB Jr, Kasai H, Nobuhara K, Dino WA, Nakanishi H. Dissociation and sticking of H2 on Mg(0001), Ti(0001) and La(0001) surfaces. J Phys Soc Jpn 2004;73(3):745-748.
- (48) Sprunger PT, Plummer RW. An experimental study of the interaction of hydrogen with the Mg(0001) surface. Chem Phys Lett 1991;187(6): 559-564.
- (49) Johansson M, Ostenfeld CW, Chorkendorff I. Adsorption of hydrogen on clean and modified magnesium films. Phys Rev B 2006;74(19):193408-193411.
- (50) Ray KB, Hannon JB, Plummer EW. An experimental study of hydrogen adsorption on beryllium. Chem Phys Lett 1990;171(5-6):469-474.
- (51) Alfè D, Gillan M. Absolute rate of thermal desorption from first-principles simulation. J Phys: Condens Matter 2006;18(37):L451-L457.
- (52) Alfè D, Gillan MJ. Ab initio statistical mechanics of surface adsorption and desorption. I. H2O on MgO(001) ay low coverage. J Chem Phys 2007;127(11):114709-114720.
- (53) Hammer B, Scheffler M, Jacobsen KW, Nørskov JK. Multidimensional potential energy surface for H2 dissociation over Cu(111). Phys Rev Lett 1994;73(10):1400-1403.
- (54) Gross A, Hammer B, Scheffler M, Brenig W. High dimensional quantum dynamics of adsorption and desorption of H2 at Cu(111). Phys Rev Lett 1994;73(23):3121-3124.
- (55) Murphy MJ, Hogdson A. Adsorption and desorption dynamics of H2 and D2 on Cu(111): The role of surface temperature and evidence for corrugation of the dissociation barrier. J Chem Phys 1998;108(10):4199-4211.
- (56) Šljivančanin Ž, Hammer B. H2 dissociation at defected Cu: Preference at vacancy and kink sites. Phys Rev B 2002;65(8):085414-085417.
- (57) Sakong S, Groß A. Dissociative adsorption of hydrogen on strained Cu surfaces. Surf Sci 2003;525(1-3):107-118.
- (58) Kratzer P, Hammer B, Nørskov JK. Geometric and electronic factors determining the differences in reactivity of H2 on Cu(100) and Cu(111). Surf Sci 1996; 359(1-3):45-53.
- (59) Dong W, Kresse G, Hafner J. Dissociative adsorption of H2 on the Pd(111) surface. J Mol Catal A: Chem 1997; 119(1-3):69-76.
- (60) Nobuhara K, Kasai H, Dinõ WA, Nakanishi H. H2 dissociative adsorption on Mg, Ti, Ni, Pd and La surfaces. Surf. Sci 2004;566:703-707.
- (61) Resch C, Berger HF, Rendulic KD, Bertel E. Adsorption dynamics for the system hydrogen/palladium and its relation to the surface electronic structure. Surf Sci 1994;316(3):L1105-L1109.
- (62) Healey F, Carter RN, Worthy G, Hodgson A. Endothermic dissociative chemisorption of molecular D2 on Ag(111). Chem Phys Lett 1995;243(1-2):133-139.
- (63) Xu Y, Greeley J, Mavrikakis M. Effect of subsurface oxygen on the reactivity of the Ag(111) surface. J Am Chem Soc 2005;127(37):12823-12827.
- (64) Jensen TR, Andresen A, Vegge T, Andreasen JW, Stahl K, Pedersen AS, Nielsen MM, Molenbroek AM, Besenbacher F. Dehydrogenation kinetics of pure and nickel-doped magnesium hydride investigated by in situ time-resolved powder X-ray diffraction. Int. J. Hydrogen Energy 2006;31(14):2052-2062.
- (65) Hammer B, Nørskov JK. Electronic factors determining the reactivity of metal surfaces. Surf Sci 1995;343(3):211-220.
List of Figures
-
1.
Minimum energy paths for the dissociation of the H2 molecule, and subsequent diffusion of one of the two H atoms, on a pure Mg surface and on (Ti, V, Fe, Co, Ni, Cu, Zr, Ru, Rh, Pd, Ag)-doped Mg surfaces.
-
2.
(Colour online) H2 (dark red) dissociation over the Ag-doped Mg surface as viewed from side (top figures) and top (bottom figures) positions respectively at IS (left-hand panel), TS (central panel) and FS (right-hand panel). The Mg, Ag and H atoms are represented respectively by light grey, dark grey and black colours.
-
3.
(Colour online) H (dark red) diffusion on the Fe-doped Mg surface as viewed from top. Figures show positions at the final state of the dissociation which is the initial state for the diffusion process (left), at the transition state (centre) and final state (right) of the diffusion process. The Mg, Fe and H atoms are represented respectively by light grey, dark grey and black colours.
-
4.
Activation energy barrier for hydrogen dissociation (black) and diffusion (red) of hydrogen on pure Mg and metal-doped Mg surfaces as a function of the -band center positions. The dashed lines have been drown for eye guidance only.
-
5.
The energy difference between the final and initial state, E(FS-IS), for hydrogen dissociation (black) and diffusion (red) on pure Mg and metal-doped Mg surfaces as a function of the -band center positions. The dashed lines have been drown for eye guidance only.