Pressure and alloying effects on the metal to insulator transition in NiS2-xSex studied by infrared spectroscopy
Abstract
The metal to insulator transition in the charge transfer NiS2-xSex compound has been investigated through infrared reflectivity. Measurements performed by applying pressure to pure NiS2 (lattice contraction) and by Se-alloying (lattice expansion) reveal that in both cases an anomalous metallic state is obtained. We find that optical results are not compatible with the linear Se-alloying vs Pressure scaling relation previously established through transport, thus pointing out the substantially different microscopic origin of the two transitions.
pacs:
71.30.+h, 78.30.-j, 62.50.-pUnderstanding the physics of strongly correlated systems is one of the most challenging tasks of condensed matter research imada98 . Besides displaying extremely interesting physical behavior, their sensitivity to small changes in external parameters makes them highly appealing for future technological applications. That sensitivity is attributed to the small value of the electron bandwidth in comparison with other relevant energy scales as the electron correlation or the charge transfer (CT) energy gap. The independent electron approximation breaks down and materials at half filling can be insulators, contrary to the prediction of band theory.
The cubic pyrite NiS2, which is a CT insulator following the Zaanen-Sawatsky-Allen classification scheme zaanen85 , is considered, together with vanadium sesquioxide V2O3, a text-book example of strongly correlated materials. NiS2 attracts particular interest as it easily forms a solid solution with NiSe2 (NiS2-xSex), which, while being iso-electronic and iso-structural to NiS2, is nevertheless a good metal. A metal to insulator transition (MIT), induced by Se alloying, is observed at room temperature (T) for , and a magnetic phase boundary from an antiferromagnetic to a paramagnetic metal is found at low T at about (see the inset of Fig.1a) imada98 . An alternative way to induce a metallic state in NiS2 is applying a hydrostatic pressure (P). Following Mott’s original idea Mott , this technically challenging procedure offers the unique opportunity to continuously tune the bandwidth, without introducing impurities or disorder. High-P techniques have indeed been used in the past few years to investigate the dc transport properties of NiS2-xSex miyasaka00 ; niklowitz06 , and a P induced MIT has been observed in pure NiS2 for P 4 GPa.
Infrared reflectivity, in particular under pressure, is a very suitable probe to address the physics of strongly correlated systems. The investigation of the T-dependent optical properties of V2O3 and their theoretical explanation in terms of coherent and incoherent excitations around the Fermi energy (EF) represents one of the most compelling successes of the dynamical mean field theory (DMFT) rozenberg95 ; kotliar06 ; baldassarre08 . However, with few remarkable exceptions okimoto95 ; congeduti ; postorino ; pashkin06 , infrared investigations of the MIT in CT insulators are still rare, and a thorough optical study of NiS2-xSex Se-alloying and applied-P is completely lacking to the best of our knowledge. In this paper we fill this gap, presenting room-T reflectivity measurements over a broad spectral range on 4 compounds (, 0.55, 0.6, 1.2) of the NiS2-xSex series together with optical measurements as a function of P on pure NiS2. Experimental data are compared with local density approximation (LDA) calculations, and the resulting scenario for the two MITs is finally depicted.
The ambient-P nearly normal incidence reflectivity has been measured between 50 and 35000 cm-1 on well characterized high density pellets of NiS2-xSex sarma03 ; sample . An in situ evaporation technique was used to measure the reference. The high-P study has been performed using a diamond anvil cell (DAC). A small piece of NiS2 was loaded inside the gasket hole together with KBr as hydrostatic medium. Great care was taken to obtain a clean sample-diamond interface where reflectivity spectra, , have been measured sacchetti07 . The measurement was performed at the high brightness infrared synchrotron radiation source SISSI@Elettra (Trieste) lupi07 . Further details on the measurement procedures are reported elsewhere baldassarre07 ; arcangeletti .
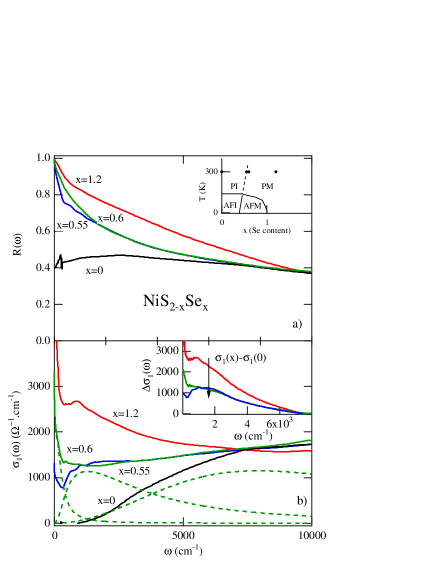
The of NiS2 at ambient-P, shown in Fig.1a, is nearly flat from 50 to 10000 cm-1 except for weak phonon contributions at 260 and 290 cm-1. On increasing the Se-content, is progressively enhanced at low frequencies, characteristic of a metallic behavior. The real part of the optical conductivity (Fig.1b) has been determined through Kramers-Kronig (KK) transformations. To this end, standard extrapolation procedures were adopted at both high and low frequency wooten ; dressel .
The optical conductivity of NiS2 is strongly depleted at low frequency showing the CT gap (evaluated at Full-Width-Half-Maximum of the absorption). This is consistent with previous optical measurements kautz72 ; miyasaka00 at about 4000 cm-1. On increasing the Se-content , a large amount of spectral weight (SW) is transferred from high to low frequency through an isosbestic point around 8000 cm-1. This suggests the main role played in the MIT by electronic correlations imada98 . As it is better highlighted by the difference spectra in the inset of Fig.1b, the low energy contribution to the is made up of two well distinct terms: one broad mid-IR band peaked around 2000 cm-1 and extending up to nearly 8000 cm-1, and a sharp contribution below 500 cm-1. In analogy with spectra of metallic V2O3 rozenberg95 ; baldassarre08 , the narrow peak is attributed to quasi-particle (QP) coherent excitations around , while the mid-IR term is associated to optical transitions from the QP peak to the upper and lower Hubbard bands. This scenario has been confirmed by fitting the curves through a Drude-Lorentz (DL) model. Data can be described by a Drude term plus two Lorentzian oscillators. The Drude and the low energy oscillator (centered around 2000 cm-1) describe the coherent and the mid-IR excitations around , while the remaining oscillator at 10000 cm-1 mimics the CT and Hubbard transitions. The fitting components are reported as thick dashed lines in Fig.1b for .
We turn now to the high-P measurements on NiS2. The reflectivity at the sample-diamond interface, (thick solid lines), is shown in Fig.2a. The strong two-phonon diamond absorption provides reliable data only above 2000 cm-1. On increasing the pressure, is progressively enhanced at low-frequency showing an overdamped behavior (similarly to obtained on varying ), as a signature for a correlated bad metallic state. At high-frequencies all converge above 10000 cm-1. In order to evaluate the accuracy of our high-P measurements, we compare the data to the expected reflectivity at a sample-diamond interface, , calculated by using a procedure previously introduced baldassarre07 ; arcangeletti . The calculated for NiS2 (dashed lines in Fig.2a) is in good agreement with measured in the DAC at the lowest pressure (1.1 GPa) being both nearly flat and with a value over the whole frequency range. The same procedure has been applied to NiS2-xSex (, 0.6, 1.2) compounds and the resulting are shown in Fig.2a for the sake of comparison. We then tried to fit the measured P for NiS2 within the same DL framework previously used for NiS2-xSex at ambient-P. Although a certain degree of arbitrariness remains in fitting the data over a restricted spectral range, a reliable description of the at any P is obtained by the sum of a Drude and a mid-IR term plus a high-frequency oscillator kept constant at all pressures. This fit provides a robust estimate of the quasi-particle SW, defined by the sum of the Drude and of the mid-IR intensities. This sum remains nearly unchanged by varying the fitting parameters over realistic ranges.
The microscopic mechanisms inducing the P- and Se-MITs are further investigated by studying the quasi-particle SW as a function of the cubic lattice parameter . The lattice is expanded by Se-alloying fujimori01 ; kwizera80 whereas it is compressed by pressure fujii . The - and the P-dependence (up to 5 GPa) of have been obtained from Ref.kwizera80 and Ref.fujii respectively. Data at higher P have been estimated using the procedure developed in Ref.sacchetti07 . Through the specific heat results of Ref.yao97 , which provide a Debye frequency cm-1 well comparable with the NiS2 phonon frequencies, we obtain a sound velocity m/s. As the density of NiS2 is kg/m3, the Bulk modulus results GPa. Assuming , is finally given by the Birch-Murnagham (B-M) equation murnaghan44
| (1) |
where normally ranges between 4 and 8 jiuxun05 . The experimental data, the values estimated from Eq.1 and those from LDA calculations LDA1 are in a very good agreement as shown in the inset of Fig. 2c.
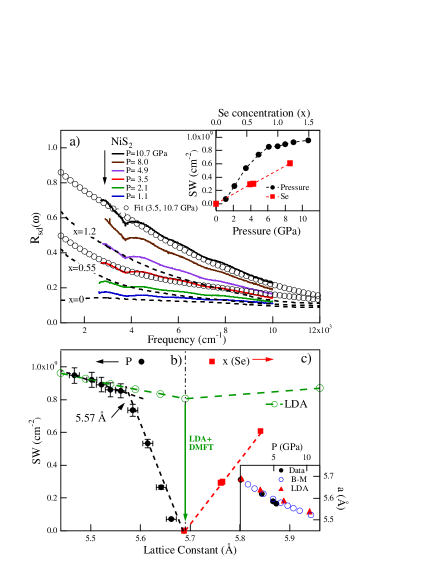
The quasi-particle SW, shown for pure NiS2 at working P in Fig.2b and for NiS2-xSex at different Se-contents in Fig.2c, reveals a striking non-monotonic behavior as a function of . Its slow continuous increase for Å (i.e. at the highest values of P) reflects the progressive enhancement of the kinetic energy due to the applied P and corresponds to a nearly-complete metallization of NiS2. For Å up to Å (namely the lattice parameter corresponding to NiS2 at ambient conditions), correlation effects get larger and the SW drops rapidly to zero as a consequence of the Mott transition. On further increasing above due to the Se-alloying, the SW (Fig.2c) restarts to increase, owing to the onset of the Se-induced MIT.
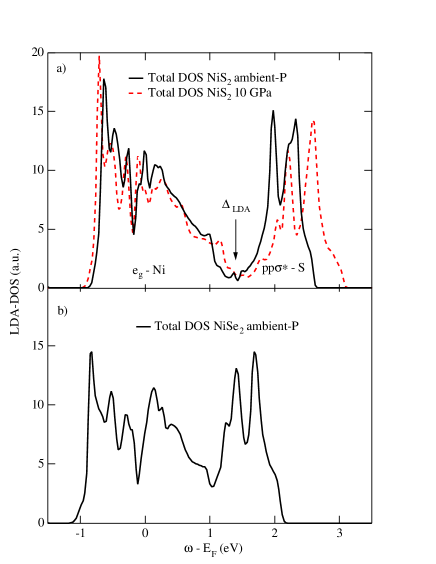
Despite the opposite behavior of the lattice parameter Se-alloying and pressure, a linear scaling factor /GPa between and P has been formerly established from low-T dc-resistivity data miyasaka00 ; niklowitz06 , thus suggesting an equivalency between the two MITs. However, the same does not apply comparing the optical SW dependence on P and x. It is indeed clear from the inset of Fig. 2a that the rate of increase of SW is much larger with P than with . The breakdown at finite frequencies of the dc linear scaling between and P suggests that, while a metallic state can be obtained from NiS2 both by applying P and by alloying Se, this state takes place through substantially different microscopic mechanisms, involving different redistributions in the electronic density of states. A qualitative understanding of the two different MITs can be obtained through self-consistent TB-LMTO LDA calculations ole , see Fig. 3. To this end, we employed the th order muffin-tin orbital (NMTO) downfolding NMTO , and the augmented plane waves plus local orbitals (APW+lo) techniques within the framework of the Wien2K code Wien2K . At ambient P the Ni -states with a bandwidth eV and the antibonding -S states are separated by a CT gap () centered around 1.5 eV. Beside this gap, a second LDA-CT gap is present between occupied -S states below and the -Ni states (see e.g. Ref. ove ). Upon applying pressure, the lattice contracts and the entire band-structure around is renormalized; e.g. by a factor of 1.13 at GPa (dashed curve in Fig. 3a). All features of the DOS stay the same, in particular, the energy scales, ( and , are rescaled by a factor 1.13. Hence, the bandwidth-gap ratio remains nearly constant. On the other hand, the interaction can be assumed to be constant, so that increases by the factor , triggering a bandwidth-controlled MIT (BC-MIT). In the case of Se-substitution, the lattice expands (instead of shrinking) due to the larger atomic radius of Se ions. This leads to a very complementary scenario: While the changes of the -bandwidth are negligible, the CT gaps shrink (see Fig. 3b). Assuming again to be constant, the driving force for the MIT is now the the reduction of the charge transfer gap ( increases, as remains basically unaffected).
Let us now turn back to the optical experiment in Fig. 2. Deep inside the metallic phase, we can expect correlations to be weak and LDA to give the proper answer. Within LDA we calculated the ”square plasma frequency”, which is defined as the average over the FS of the squared velocities. In Fig. 2b-c we compare the square plasma frequency to the experimental SW. Because of the different changes in the bandstructure under pressure and upon Se alloying, LDA gives non-monotonic behavior and very different slopes in agreement with experiment, see Fig. 2b-c). For the insulating NiS2 compound and close to the phase transition, electronic correlations are not negligible and we performed LDA+DMFT LDADMFT1 calculations. To this end, the NMTO bandstructure was downfolded to effective Ni -states and the correlations in these two orbitals were treated by means of DMFT. For ( being the intra-orbital Coulomb interaction between the Ni -states and the Hund coupling), the two -orbitals split and a gap opens for NiS2. This insulating LDA+DMFT solution results in a very strong suppression of the square plasma frequency (as well as of the SW) as indicated by the vertical arrow in Fig. 2b-c.
Besides important similarities between the P- and Se-dependent phase diagrams miyasaka00 ; fujimori01 , the present optical study reveals that a simple linear scaling between P and , as that indicated by transport, does not hold at finite frequencies.This suggests that the two MITs rely on distint microscopic mechanisms. These mechanisms can be understood theoretically in terms of the two fundamental parameters for the MIT in a CT insulator: Under pressure, and increases, triggering the MIT; in contrast upon alloying Se, the increase of is responsible for the MIT, whereas even decreases. This makes NiS2-xSex under pressure an ideal system for the study of the MIT in a CT strongly correlated system.
Acknowledgements.
The authors acknowledge L. Baldassarre and E. Arcangeletti for preliminar optical measurements and M. Polentarutti for x-ray characterization of the NiS2 compound. This work was supported by the Austrian Fonds zur Förderung der wissenschaftlichen Forschung for founding.References
- (1) M. Imada et al., Rev. Mod. Phys. 70, 1039 (1998).
- (2) J. Zaanen et al., Phys. Rev. Lett. 55, 418 (1985).
- (3) N. F. Mott, Proc. Phys. Soc. A 64, 416 (1949).
- (4) S. Miyasaka et al., J. Phys. Soc. Japan 69, 3166 (2000).
- (5) P.G. Niklowitz et al., cond-mat/0610166v1.
- (6) M.J. Rozenberg et al., Phys. Rev. Lett. 75, 105 (1995).
- (7) L. Baldassarre et al.Phys. Rev. B 77, 113107 (2008)
- (8) G. Kotliar et al., Rev. Mod. Phys. 78, 865 (2006).
- (9) Y. Okimoto et al. Phys. Rev. B 51, 9581 (1995).
- (10) A. Congeduti et al. Phys. Rev. B 63, 1744 (2001).
- (11) P. Postorino et al. Phys. Rev. Lett. 91, 175501 (2003).
- (12) A. Pashkin et al. Phys. Rev. B 74, 165118 (2006).
- (13) D.D. Sarma et al., Phys. Rev. B 67, 155112 (2003), and Phys. Rev. B, 57, 6984 (1998).
- (14) Due to the cubic NiS2-xSex structure, IR data on high density pellets are not affected by anisotropic effects.
- (15) A. Sacchetti et al., Phys. Rev. Lett. 98, 026401 (2007).
- (16) S. Lupi et al., J. Opt. Soc. Am. B 24, 959 (2007).
- (17) L. Baldassarre et al., Phys. Rev. B 75, 245108 (2007).
- (18) E. Arcangeletti et al., Phys. Rev. Lett. 98, 196406 (2007).
- (19) F. Wooten, in Optical Properties of Solids, Academic Press, New York (1972).
- (20) M. Dressel and G. Grüner, in Electrodynamics of Solids, Cambridge University Press (2002).
- (21) R.L. Kautz et al., Phys. Rev. B 6, 2078 (1972).
- (22) A. Fujimori, Phys. Stat. Sol. (b) 233, 47 (2001).
- (23) P. Kwizera et al., Phys. Rev. B 21, 2328 (1980).
- (24) T. Fujii et al., Miner. Journ. 13, 448 (1987).
- (25) X. Yao et al., Phys. Rev. B 56, 7129 (1997).
- (26) F.D. Murnaghan, Proc. Natl. Acad. Sci. U.S.A. 30, 244 (1944).
- (27) S. Jiuxun et al., J. Phys. Chem. Solids 66, 773 (2005).
- (28) Concerning the LDA analysis, values were calculated using the Tight-Binding Linear-Muffin Tin-Orbital (TB-LMTO) plus LDA method and the so-called force theorem, that is the change of the total energy under uniform compression, (see e.g. Ref. force, ).
- (29) A.R. Mackintosh and O.K. Andersen:Electrons at the Fermi Surface, edited by M. Springford (Cambridge, 1980), p. 149
- (30) O. K. Andersen and O. Jepsen, Phys. Rev. Lett., 53, 2571 (1984).
- (31) O. K. Andersen et al., ’Electronic Structure and Physical Properties of Solids. The Uses of the LMTO method’, edited by H. Dreysse, Springer Lecture Notes in Physics (Springer, New York, 2000); O.K. Andersen and T. Saha-Dasgupta, Phys. Rev. B, 62, R16219 (2000); E.Zurek, O. Jepsen, and O.K. Andersen, Chem. Phys. Chem. 6, 1934 (2005).
- (32) K. Schwarz, P. Blaha and G.K.H. Madsen, Comp. Phys. Commun. 147, 71 (2002).
- (33) A. Y. Matsuura et al., Phys. Rev. B, 53, R7584 (1996)
- (34) The Hirsch-Fye quantum Monte Carlo simulation has been used for solving the DMFT equations.
- (35) V. I. Anisimov et al., J. Phys. Cond. Matter 9 7359 (1997); A. I. Lichtenstein and M. I. Katsnelson, Phys. Rev. B 57 6884 (1998); G. Kotliar et al., Rev. Mod. Phys. 78 865 (2006). K. Held, Adv. Phys. 56 , 829 (2007).