An 80-kpc Lyman- halo around a high-redshift type-2 QSO
Abstract
We announce the discovery of an extended emission line region associated with a high redshift type-2 QSO. The halo, which was discovered in our new wide-field narrow-band survey, resides at in the Spitzer First Look Survey region and is extended over 80 kpc. Deep VLBI observations imply that approximately 50 per cent of the radio emission is extended on scales 200pc. The inferred AGN luminosity is sufficient to ionize the extended halo, and the optical emission is consistent with being triggered coevally with the radio source. The Lyman- halo is as luminous as those found around high redshift radio galaxies, however the active nucleus is several orders of magnitude less luminous at radio wavelengths than those FRIIs more commonly associated with extended emission line regions. AMS05 appears to be a high-redshift analogue to the radio-quiet quasar E1821+643 which is core dominated but which also exhibits extended FRI-like structure and contains an optically powerful AGN. We also find evidence for more quiescent kinematics in the Lyman- emission line in the outer regions of the halo, reminiscent of the haloes around the more powerful FRIIs. The optical to mid-infrared SED is well described by a combination of an obscured QSO ( ) and a 1.4 Gyr old simple stellar population with mass M⊙.
keywords:
Galaxies: High-Redshift, Galaxies: Haloes, Galaxies: Quasars: Emission lines, Galaxies: Jets, Accretion1 Introduction
1.1 Type-2 QSOs
Unified schemes rely on different lines of sight toward the active galactic nucleus (AGN) to explain a variety of different species of apparently distinct astrophysical phenomena (e.g. Antonucci et al., 1993). These unified schemes invoke the putative dusty torus around the central accreting supermassive black hole which obscures the central nuclear source and the high-velocity gas which lies close to the nucleus, i.e. the broad-line region. Although slight modifications to this simple scheme may be needed (e.g. Lawrence 1991; Simpson 2005) the general picture remains the same. The evidence for this orientation-based unified scheme is now compelling, including the properties of the unresolved hard X-ray background for example which suggests the existence of a large number of obscured QSOs (e.g. Gilli et al., 2007). The dusty torus is thought to obscure the central engine along certain lines of sight, resulting in the nuclear source appearing faint at optical wavelengths with the emission dominated by the host galaxy’s stellar population. Galaxies whose properties and orientation causes us to observe them in this manner are known as obscured (or type-2) QSOs.
Further evidence of these obscured sources comes from radio surveys, where large-scale radio jets provide a method of finding both obscured and unobscured AGN without the problems associated with dust obscuration. These studies have shown that the fraction of obscured (type-2) radio-loud AGN may be as high as 60 per cent, with the unobscured (type-1) QSOs traditionally found in optical surveys only comprising 40 per cent of the powerful AGN population (e.g. Willott et al. 2000). Therefore, it would be reasonable to assume that a similar fraction of radio-quiet obscured sources should also exist. However, such obscured sources have proven very difficult to find with traditional techniques at optical wavelengths as they just appear as normal galaxies in imaging data.
Although X-ray (Norman et al. 2002; Stern et al. 2002) and pure spectroscopic (Jarvis et al. 2005) observations can find such sources at high redshift, it is with the Spitzer Space Telescope that this field has been revolutionized, with many groups using the fact that the dusty torus, heated by the central AGN, reradiates at mid-infrared wavelengths. Many methods based on mid-infrared observations have been used to find such AGN; Lacy et al. (2004) and Alonso-Herrero et al. (2006) for example used mid-infrared selection criteria to identify them. The combination of radio and mid-infrared data can also be used to reduce the fraction of star-burst dominated sources from colour selected samples (e.g. Donley et al. 2005, Martínez-Sansigre et al. 2005, 2006; §2.2), and deep radio surveys have been shown to harbour a considerable number of these sources (e.g. Simpson et al., 2006). All of these now seem to imply that a large population of obscured AGN exist in the high-redshift Universe and that many may also be missed in the current deep X-ray surveys (e.g. Lacy et al. 2007; Martínez-Sansigre et al. 2007).
1.2 Lyman- Haloes
In recent years much effort has been devoted to the study of high redshift nebulæ characterised by large luminosity and great extent in the Lyman- emission line – typically L , extending over 50kpc. The existence of such extended emission line regions (EELRs) around HzRGs had been known for more than 10 years (e.g. McCarthy et al., 1990) before the discovery of two similar haloes at by Steidel et al. (2000), which were not associated with detections at radio wavelengths.
Many EELRs are now known to exist around HzRGs following the results of e.g. Eales et al. (1993), Maxfield et al. (2002), Reuland et al. (2003), Villar-Martín et al. (2003), to name but a handful. Lyman- haloes have also been shown to reside around QSOs by e.g. Bunker et al. (2003), Weidinger et al. (2005), and Barrio et al. (2008). Furthermore, it seems that these extensive Lyman- haloes also exist around several galaxies similar to those discovered by Steidel et al. (2000), which are not associated with powerful AGN. Currently, tens of these galaxies are known following the results of Francis et al. (2001), Matsuda et al. (2005), Nilsson et al. (2006), and Smith & Jarvis (2007). Results show that the ionizing properties of optically-selected extended Lyman- haloes are diverse, broadly falling into three categories (ionization by AGN, galaxy wide super-wind, or a cold accretion process – see e.g. Smith et al., 2008, for a more in depth discussion). Searches to locate these huge line-emitting structures have generally been serendipitous (e.g. Francis et al., 2001, Dey et al., 2005 – shown to harbour an obscured AGN within the halo – or Nilsson et al., 2006) or targetted on known overdensities (e.g. Steidel et al., 2000, Reuland et al., 2003, Matsuda et al., 2005, Villar-Martín et al., 2003,2005).
Throughout this paper, the AB magnitude system is used (Oke & Gunn, 1983), and a standard cosmology is assumed in which = 71 km s-1, = 0.27 and = 0.73 (Dunkley et al., 2008).
2 Observations
2.1 A new narrow-band survey
In order to find the most luminous and extended Lyman- haloes and quantify their diverse ionization mechanisms, we conducted a blank-field narrow-band survey with sufficient area to detect a large sample of them at . We observed a total of 15 deg2 using the Wide Field Camera (WFC) on the Isaac Newton Telescope, and spread our observations over three extragalactic fields (the XMM-LSS, Lockman Hole, and Spitzer First Look Survey), enabling us to take advantage of the wide range of high-quality public survey data available in these regions of sky. We also split our observations between three different narrow-band filters; Heii4686/100, Hb4861/170, and Oiii5008/100. This improves the efficiency of our survey strategy by reducing our requirements for Sloan-g’ band observations (i.e. each pointing requires observations in three separate narrow-band filters, plus Sloan-g’ band). Our typical 50% completeness limits in the narrow- and broad bands were nb and g’ respectively (measured in 4′′ apertures). The survey strategy, sensitivity and results will be discussed in more detail in Smith & Jarvis (in prep).
Candidate Lyman- emitters are separated from other objects whose emission lines are redshifted into the narrow-band filter’s transmission function by virtue of their extremely high equivalent widths (EWs). EWs are estimated based on our broad- and narrow-band photometry (see e.g. Venemans et al., 2005; Smith & Jarvis 2007).
Following an extensive set of simulations to quantify the sensitivity of our observations, only those objects that satisfied the following criteria (equations 1 - 3) are considered candidate Lyman haloes:
| (1) | |||
| (2) | |||
| (3) |
All objects matching these criteria were inspected by eye to remove contaminants and data artefacts such as high proper motion objects, amplifier cross-talk and so on from the sample (again, see Smith & Jarvis in prep for more details.). In this paper we focus on one particular halo which is identified with the source AMS05 (Martínez-Sansigre et al., 2005).
2.2 AMS05: Imaging from our survey
Martínez Sansigre et al. (2005) introduced a sample of type-2 obscured QSOs to constrain the QSO fraction (i.e. the fraction of objects which are unobscured – i.e. type-1 – QSOs). This sample of QSOs was chosen to satisfy the following selection criteria, designed to pick out the elusive type-2 QSO population at :
-
•
SJy
-
•
SJy
-
•
350Jy SmJy
These criteria select galaxies that are intrinsically luminous at 24m, a result of bright reprocessed hot-dust emission indicative of the presence of an AGN. They are also chosen to be relatively raint at 3.6m ensuring that the bright QSO nucleus does not dominate the shorter wavelengths, i.e. they must be obscured. The 3.6m criterion is also expected to reject sources with . The 1.4 GHz criteria were designed to remove the more luminous radio-loud (e.g. FRII-type; Fanaroff & Riley 1974) galaxies from the sample, whilst ensuring that the radio emission was caused by an AGN (i.e. that they are QSOs, rather than starburst galaxies). These criteria proved highly successful at picking out type-2 QSOs at ; the final sample included 21 candidates (the sample selection is discussed in much greater detail in e.g. Martínez-Sansigre et al., 2006a).
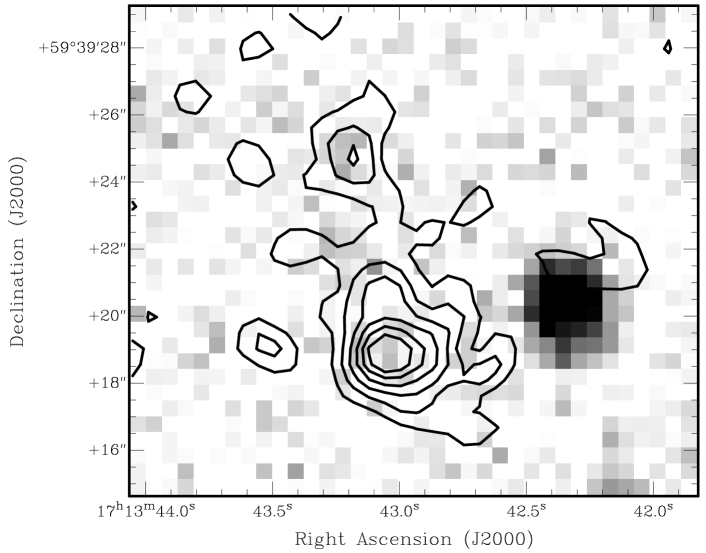
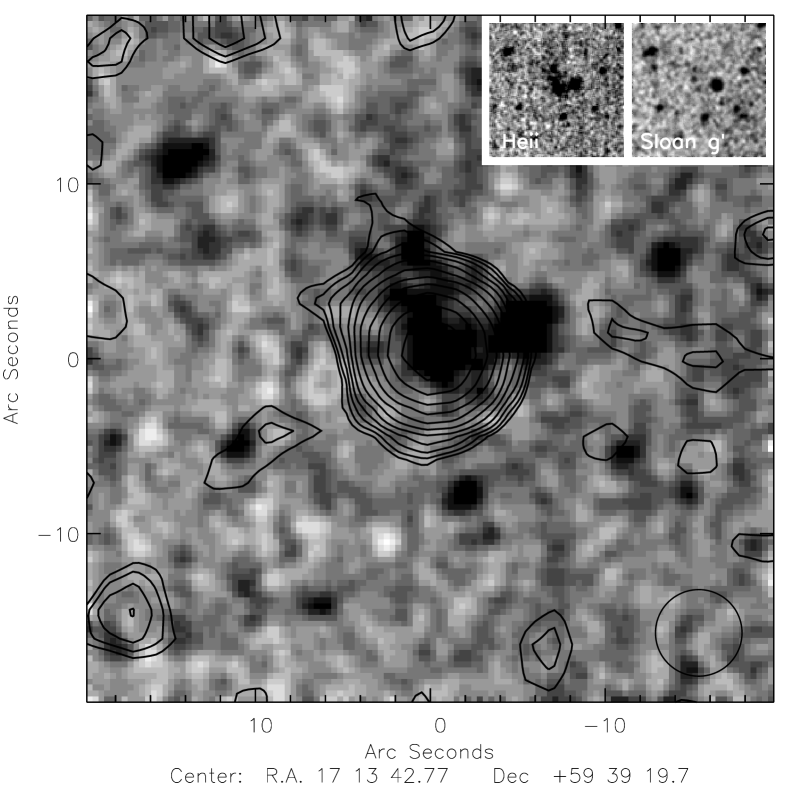
One of the galaxies that satisfied our Lyman- halo selection criteria was a previously known type-2 QSO, dubbed AMS05. Our broad- and continuum-subtracted narrow-band observations of AMS05 are presented in figure 1 and show that the halo detected in the narrow-band filter is extended over 10 arcsec. The original spectroscopy of AMS05 was carried out at a position angle of 98∘, meaning that the vast emission line structure that our narrow-band imaging reveals was not detected. Due to the large equivalent width estimated from our photometry (EWÅ), and the extent of the emission line structure, we obtained new spectroscopic observations of AMS05, this time with a position angle of 12∘, aligned along the major axis of the extended emission.
2.3 Multi-wavelength data used in this study
In addition to the narrow-band and Sloan-g’ band imaging data taken as part of our survey (Smith & Jarvis in preparation), we located publicly-available imaging observations of the Spitzer First Look Survey region to constrain the spectral energy distribution of AMS05. We use u⋆-band data from Shim et al.(2006), the R-band from Fadda et al.(2004), IRAC data from Lacy et al.(2005), MIPS 24m data from Fadda et al.(2006), 610 MHz data from Garn et al.(2007), and 1.4 GHz data from Condon et al.(2003). The data at 4.9 GHz are from Martínez-Sansigre et al. (2006b). Additional publically-available data in the J, H & Ks bands were obtained using NIRI on the Gemini-North telescope as part of another program (GN-2005B-Q-75). Images were co-added from 9 different offset exposures on a (3 3) square grid pattern (with offsets of 10 – 20′′), and then median combined to get the resulting total integration times of 300, 280, & 240 seconds in the J, H & K bands respectively. In addition, extremely high resolution European Very Long Baseline Interferometry Network (EVN) data at 1.7 GHz have also been obtained (H-R. Klöckner, private communication).
This object was also observed with the Infrared Spectrograph (IRS) aboard the Spitzer Space Telescope and with the Max-Planck Millimetre Bolometer Array (MAMBO-2) instrument at the IRAM 30m telescope at Pico de Veleta, Spain. The IRS observations are described in some detail in Martínez-Sansigre et al. (2008). MAMBO-2 has an effective wavelength of 1.2mm, with a beam FWHM of 10.7′′. During these observations, the target was centred on the most sensitive pixel and standard on-off observations were conducted, varying the wobbler throw between 32, 35 & 40′′ in azimuth at 2 Hz. The atmospheric opacity was always , and the sky noise was medium to low ( mJy beam-1). Gain calibration was carried out regularly using Neptune, Uranus or Mars, and monitored using very bright millimetre sources (typically Jy). The data were reduced using MOPSIC (Zylka, 1998) and the absolute flux scale of MAMBO-2 is uncertain at the 20% level. Photometry of AMS05 is presented in table 1.
| Photometric Band | MagAB/Flux Density |
|---|---|
| u⋆ | |
| Heii | 22.26 |
| Sloan g’ | 24.98 |
| R | 24.90 |
| J | 21.43 |
| H | 20.30 |
| Ks | 20.40 |
| 3.6m | 37.8 2.5 Jy |
| 4.5m | 65.6 3.3 Jy |
| 5.8m | 142.2 13.3 Jy |
| 8.0m | 294.8 12.2 Jy |
| 24m | 1.43 0.09 mJy |
| 1.2mm | 1.04 mJy |
| 4.9 GHz | 0.44 0.05 mJy |
| 1.7 GHz (VLBI) | 485.6 24.2 Jy |
| 1.4 GHz | 1.04 0.05 mJy |
| 610 MHz | 1.31 0.08 mJy |
2.4 Spectroscopy of AMS05
| Core separation | Component Flux | Component centre | Component FWHM | |
|---|---|---|---|---|
| (′′) | (erg cm-2 s-1) | (Å) | (Å) | (km s-1) |
| 0.0 | 2.04 | 4681 | 17.33.0 | 1110 190 |
| 2.7 | 7.10 | 4675 | 14.23.1 | 910 200 |
| 6.0 | 6.42 | 4673 | 12.64.0 | 810 260 |
Our spectroscopic observations were taken using the ISIS double-beamed spectrograph on the William Herschel Telescope on the nights of July 12th & 15th, 2007. The red arm of ISIS uses the new highly red sensitive REDPLUS CCD, a 4k2k array of 15.0m pixels, while the blue arm uses a thinned EEV 4k2k 13.5m pixel CCD. These observations used the red and blue arms with the R158R and R300B gratings, for exposure times of 4900 and 21800 seconds respectively using a 1.5′′ slit orientated at a position angle of 12.0∘ East of North along the long axis of the extended emission. The red-arm data were binned up to (3 2), whilst the blue data were binned (2 2). This resulted in a spectral resolution of 12.0Å in the red, and 8.5Å for the blue arm.
The data were de-biassed, illumination- and flatfield-corrected. Wavelength solutions were derived from observations of Cu-Ar and Cu-Ne emission line lamps with the same setup as for the science frames. Flux calibration was derived from observations of the spectrophotometric standard star BD+28∘ 4211.
3 Results
3.1 The Halo
Although AMS05 is detected in the Sloan-g’ band image (figure 1, centre), the observed equivalent width is at least EW 1000Å, however this value is uncertain due to the bright Lyman- emission dominating the continuum emission in the broad band image. The flux emitted as Lyman- falling in the slit is , giving a luminosity of (2.19 ). Our photometric luminosity estimate of 1.50 erg cm-2 s-1 (3.89 , which is measured in an 8′′ aperture) suggests that slit losses account for 44% of the total flux.
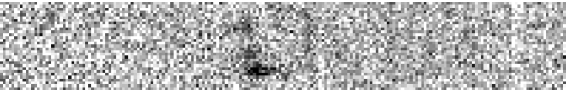
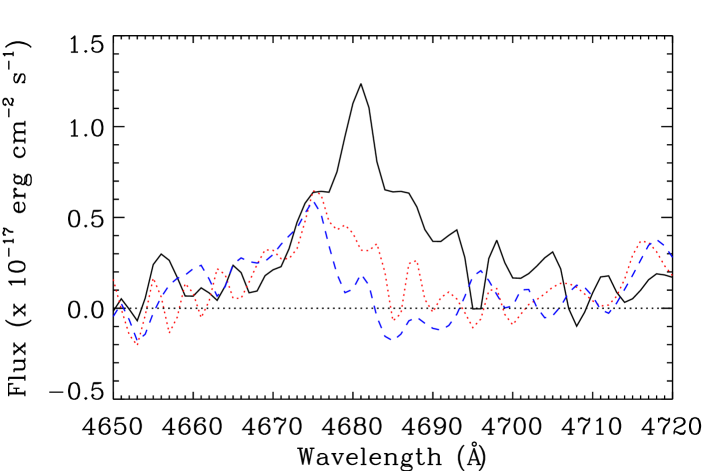
The Lyman- emission shows a remarkable velocity structure, apparent in the two-dimensional spectra presented in figure 2. The Lyman- emission is split into at least three different components in the spectrum, with peaks offset from one another by km s-1. Table 2 and figure 3 show details of spectra extracted in three separate apertures as a function of their distance from the host galaxy and radio core of the Lyman- emitting structure (which coincide with the peak in the Lyman- surface brightness).
Upon inspecting figures 2 and 3, it is immediately apparent that those components furthest away from the nucleus appear blue-shifted relative to the central component; they also show narrower linewidths. These properties bear a striking resemblance to high redshift radio galaxies (HRG); these relationships are presented for a sample of 15 HRGs in van Ojik et al.(1997), and also for the three HRGs discussed in Villar-Martín et al. (2007a).

The Lyman- emission is extended over at least 10′′ in both our narrow-band imaging (figure 1), and in our 2D spectrum (figure 2). The spatial extent – which equates to 80kpc at – may be due to inflow or outflow of gas surrounding the AGN; this is very difficult to say for certain. However, for the more powerful radio galaxies, sensitive polarisation measurements favour the infall scenario (e.g. Humphrey et al., 2007). To carry out this sort of analysis here would require much higher sensitivity radio observations with full polarization properties.
The two most separate components of the Ly emission line are offset from one another by approximately 580 km s-1 in velocity. If we naïvely interpret this as Keplerian motion, then we can estimate the mass of the halo as being 7.6 . Of course, due to the resonant nature of the Lyman- photons, it is also quite possible that the regions between the knots of Lyman- emission are sites of foreground absorption, or scattering of Lyman- photons away from the line of sight (see e.g. van Ojik et al. 1997; Jarvis et al. 2003; Wilman et al. 2004 & 2005).
As well as the optical-infrared SED discussed in section 3.2.1 below, the loosely conical structure of the Lyman- emitting region suggests that a central ionizing source is more likely to be the cause of ionization than any of the other commonly suggested methods of ionizing a Lyman- halo of similar luminosity (see e.g. Smith & Jarvis, 2007), which are more likely to appear approximately spherical.
3.2 The Host galaxy
3.2.1 Optical-Infrared SED
To constrain the SED of AMS05, we make use of some of the multi-wavelength data over the FLS field. To analyse the spectral energy distribution of AMS05, we used a combination of template AGN and simple stellar population models. For template AGN models, we used the Siebenmorgen template AGN SEDs from http://www.eso.org/~rsiebenm/agn_models/ (see e.g. Siebenmorgen, et al., 2004, for a recent review), as well as the mean QSO SED from Elvis et al. (1994) with a variety of Milky Way model dust obscurations between and 10 following Pei et al (1992). The Siebenmorgen template AGN SEDs are the result of self-consistent radiative transfer simulations with central heating sources.
The Elvis et al. (1994) mean QSO SED is empirical, based on the observations of a large sample of radio quiet QSOs. The original authors noted that the dispersion in their mean SEDs for the observations of individual objects was around a decade at all wavelengths. For the simple stellar populations, we made use of the Bruzual & Charlot (2003) stellar models. We used simple stellar populations of ages 10, 30, 50, 100, 200, 400, 600, 1000, 1400, 1800 & 2200 Myr.
The value of the goodness-of-fit parameter was calculated for each linear combination of stellar population and AGN template, with the model combination corresponding to the lowest value of chosen as our best fit in this regime.
To accurately calculate the value of the parameter, we removed the Lyman- flux from the measurement of the Sloan-g’ band magnitude since Lyman- haloes are not included in the Bruzual & Charlot (2003), Elvis (1994) or Siebenmorgen models. The presence of such profuse Lyman- emission would, left unchecked, produce artificially large measurements for the photometry of these objects since Lyman- falls near the centre of the Sloan-g’ band filter’s transmission function at the redshift studied here. This subtraction is reflected in the large error bar in the Sloan-g’ band data point in figure 4, since the Lyman- emission dominates the Sloan-g’ band flux.
The object itself is associated with detections in all bands with the exception of , J, and 1.2mm. AMS05 was originally selected by Martínez-Sansigre et al. (2005) to have a mid-IR/radio spectral energy distribution consistent with a type 2 high redshift QSO; our studies are consistent with the presence of an obscured AGN.
The optical-infrared SED of AMS05 is shown in figure 4; as mentioned in Martínez-Sansigre et al. (2005) the combination of a high S/N detection at 24m (m in the emitted frame), faint flux at 3.6m (restframe 9350 Å– z’ band), and a moderate radio luminosity of erg s-1 Hz-1 sr-1 ensures that the host galaxy to this Lyman- halo contains a powerful AGN rather than a starburst. The AGN is thought to be obscured by the torus invoked by unified schemes to explain the varying properties of AGN with orientation with respect to the line of sight (see e.g. Urry & Padovani, 1995). This is in agreement with our SED fitting; we find that the best fit to the SED of AMS05 is a combination of a 1.4 Gyr old simple stellar population and an obscured Elvis (1994) AGN component with = 5.5. The best fit composite SED is also shown in figure 4.
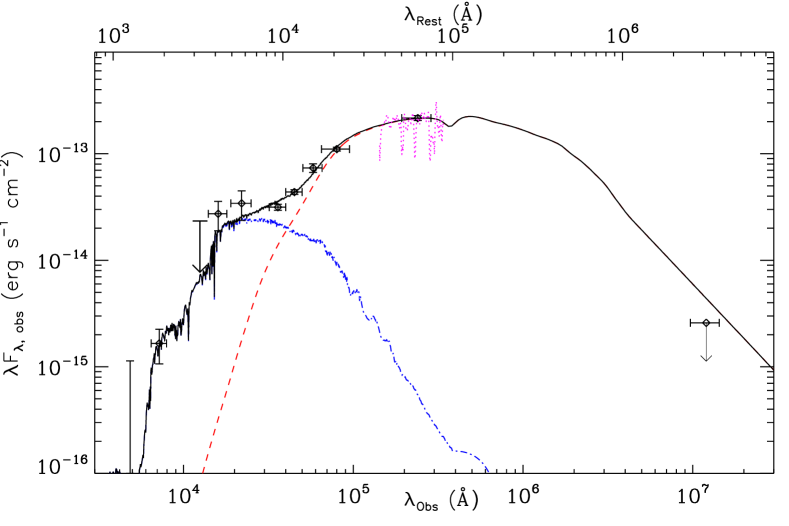
Whilst the 1.2mm non-detection would appear to be at odds with our best-fit SED, the uncertainties associated with the 1.2mm observations (for which the flux calibration has an uncertainty of 20%), in tandem with the large inherent scatter in QSO SEDs mean that this apparent discrepancy can be easily explained. It is quite possible that AMS05 has less cool dust than expected from the median SED from Elvis et al. (1994), which was merely a linear extrapolation between the far-infrared and radio wavelengths in any case.
We can use the normalisations of the SED components to estimate the stellar mass and AGN luminosity. For the stellar SED we derive a mass of 4.4 , similar in mass to powerful radio galaxies at the same redshift (e.g. Jarvis et al. 2001, Willott et al., 2003), and a bolometric AGN luminosity of 3.4 , with the latter number being derived assuming that at 8 m (Elvis et al., 1994, Richards et al. 2006), and assuming the Milky-Way dust extinction law of Pei (1992). Note that the uncertainty on the bolometric correction alone could be as high as 50%.
3.2.2 Results from millimetre-wavelength observations
AMS05 was not detected to a 3 limit of 1.04 mJy at 1.2mm. To constrain the star formation rate due to cold dust mass within the halo, we consider the 1.2mm observed flux to be due to any of three different templates; a grey body, and templates based on M82 and Arp220. For the grey body template, we assume typical emissivity index and dust temperature from Omont et al. (2003 - , ), and for all models we adopt the Kennicutt (1998) calibration of SFR to far-IR luminosity (between 8 and 1000m). Using these assumptions we find that the star formation rate derived assuming grey body emission in the far infrared is yr-1 (or yr-1 if we assume a lower dust temperature, ). The M82 and Arp220 templates suggest higher limits on the star formation rates of 700 & 950 yr-1, respectively; it is clear that there may be a vigorous amount of obscured star formation residing within AMS05 that we do not observe in our optical SED (figure 4).
3.2.3 Radio SED

The radio SED of AMS05 is displayed in figure 5, overlaid with a polynomial of the form (following Jarvis & Rawlings, 2001). With a second order polynomial and three data points the best fit is exact; the radio SED of AMS05 peaks at 455 275 MHz in the observed frame (where the errors have been derived analytically, and are consistent with a set of 100,000 Monte-Carlo simulations of our observational results). This corresponds to 1.7 1.0 GHz in the rest frame.
Gigahertz peaked spectrum radio sources are usually young, radio-loud objects, whose relativistic jets have not escaped the confines of the host galaxy (e.g. O’Dea et al., 1998). However, despite the high radio luminosity (it lies close to the Fanaroff Riley break of W Hz-1 sr-1), we will now argue that AMS05 contains a luminous radio quiet AGN, and therefore we can draw no parallels between typical GPS sources and the source in question here.
Quasars are considered to be radio-loud or radio-quiet based on the ratio of their radio to optical luminosity, , with generally considered to be the dividing line (Kellerman et al., 1989). The same calculation can be made for a type-2 AGN like AMS05 if we consider its unobscured optical luminosty, derived from our SED fit. We derive which places AMS05 in the radio-quiet regime, albeit as a bright example of this class. This is further supported by the EVN observations, which reveal that 50% of the flux at 1.4 GHz is emitted on scales 220 pc, indicating the absence of the bulk of the radio emission on kpc scales. It is highly unlikely that the difference between the EVN and VLA fluxes is due to AGN variability; whilst a factor of two in variation is typical of blazars, they demonstrate strong beamed continuum and/or broad emission lines, neither of which is observed in AMS05.
Whilst the Lyman- emission bears great resemblance to the EELRs around HRGs, the above arguments indicate that AMS05 is an intrinsically different class of source. This can most clearly be seen in figure 6; using the polynomial fit to extrapolate the radio luminosity of the LAB host galaxy to 151 MHz in the rest frame we find that even though the luminosity in Lyman- emission is similar to the median HzRGs drawn from the 3CRR, 7CRS, 6CE and 6C samples in Jarvis et al. (2001), the luminosity at radio frequencies is several orders of magnitude lower.
This source appears in many ways to be very similar to the low-redshift radio-quiet quasar E1821+643 (Blundell & Rawlings 2001), which exhibits quasar-like optical emission but also has FRI-type radio emission over 100 kpc scales. Blundell & Rawlings explain this as a precessing jet, possibly due to a binary black hole system at the centre of the galaxy. This precession could result in an FRI morphology, with around 50 per cent of the radio luminosity coming from the core, but the detectability of the extended emission becomes very difficult due to the reduced surface brightness on large scales. Future low-frequency telescopes such as LOFAR would be ideally placed to map out such extended structures around such radio-quiet AGN.

3.2.4 Photon Number counts
We demonstrate that the AGN generates enough photons to ionize the observed Ly halo, using a photon number counts argument, similar to that described by Neugebauer et al., (1980). By using the median unobscured QSO SED from Elvis (1994), scaled to match our measured flux at 24m (where the effects of obscuration by dust are negligible and the QSO dominates the monochromatic luminosity), we can estimate the number of photons emitted by the naked source before the effects of obscuration along our line of sight are taken into account. We find that the nucleus emits around 1.2 ionizing photons per second, which is orders of magnitude more than that which is emitted as Lyman- photons. There is no doubt that the active nucleus is capable of ionizing the Lyman- halo, although a starburst component could easily contribute as is postulated for HzRGs (e.g. Binette et al. 2006; Villar-Martín et al. 2007b), however this contribution is constrained by the MAMBO-2 observations.
4 Conclusions
We have discovered the first highly-extended Lyman--emitting halo around a radio-intermediate type-2 obscured QSO. The halo, which is extended over 80 kpc, is similar to those haloes observed around high-redshift radio galaxies, and the more quiescent Lyman- blobs, with a luminosity estimated from our photometry of 1.50 (3.89 ). By analogy with the high-redshift radio galaxies, where polarisation data help determine the source orientation on the sky, we interpret the velocity offset and decrease in velocity dispersion toward the edge of the halo as evidence for infall rather than outflow, although again this would need deeper radio observations to determine directly.
The existence of Lyman- “fuzz” around QSOs at was predicted by Haiman & Rees (2001), and Alam & Miralda–Escudé (2002) - with suggested angular sizes ′′and 0.1-1.0′′, respectively. Whilst one example of extension on small angular scales was presented in Francis & McDonnell (2006), this new discovery is the first detection of a QSO hosting an extensive Lyman- halo of which the authors are aware.
The halo is associated with a Gigahertz-peaked radio SED, although since AMS05 is radio quiet, this does not imply that the radio source is young. The most likely cause of ionization of the large extended Lyman- emission for this halo is photoionization from the central radio-quiet AGN. However, we cannot rule out that at least part of the excess in Ly emission may arise from other sources, such as an episode of star formation (e.g. Binette et al., 2006) or cooling radiation (e.g. Fardal et al. 2001; Dijkstra et al. 2006a,b).
AMS05 appears similar to the low-redshift radio-quiet quasar E1821+643 which has large-scale FRI radio struture but an optically powerful AGN at its centre. Blundell & Rawlings (2001) suggest that the lack of bright emission on large scales in this source is due to a precessing jet caused by a binary black hole system, which would result in lower luminosity emission on the kpc scale. Future observations with the next generation of radio telescopes could detect such emission around optically powerful but sub-luminous radio sources.
Acknowledgments
The authors wish to thank Hans-Rainer Klöckner for sending unpublished VLBI data. DJBS wishes to thank the UK STFC for a PDRA. MJJ acknowledges the support of a Research Council UK fellowship. The Isaac Newton and William Herschel Telescopes are operated on the island of La Palma by the Isaac Newton Group in the Spanish Observatorio del Roque de los Muchachos of the Instituto de Astrofisica de Canarias. Based in part on observations obtained at the Gemini Observatory, which is operated by the Association of Universities for Research in Astronomy, Inc., under a cooperative agreement with the NSF on behalf of the Gemini partnership: the National Science Foundation (United States), the Science and Technology Facilities Council (United Kingdom), the National Research Council (Canada), CONICYT (Chile), the Australian Research Council (Australia), CNPq (Brazil) and SECYT (Argentina). IRAM is supported by INSU/CNRS (France), MPG (Germany), and IGN (Spain).
References
- (1) Alam, S.M.K., & Miralda–Escudé, J., 2002, ApJ, 568, 576
- (2) Alonso-Herrero A. et al., 2006, ApJ, 640, 167
- (3) Antonucci R., 1993, ARA&A, 31, 473
- (4) Barrio E., et al., 2008, arXiv:0806.3688
- (5) Bicknell, G.V., Dopita M.A., O’dea C.P.O., ApJ, 485, 112
- (6) Binnette L., Wilman R.J., Villar-Martín M., Fosbury R.A.E., Jarvis M.J., Röttgering H.J.A., 2006, A&A, 459, 31
- (7) Blundel K.M., Rawlings S.G., 2001, ApJ, 562, 5
- (8) Bruzual G., Charlot S., 2003, MNRAS, 344, 1000
- (9) Bunker A., 2003, Ap&SS, 284, 357
- (10) Chapman S.C., Richards E.A., Lewis G.F., Wilson G., Barger A.J., 2001, ApJ, 548, 17
- (11) Condon J.J., Cotton W.D., Yin Q.F., Shupe D.L., Storrie-Lombardi L.J., Helou G., Soifer B.T., Werner M. W., 2003, AJ, 125, 2411
- (12) Dey A., et al., 2005, ApJ, 629, 654
- (13) Dijkstra M., Haiman Z., Spaans M., 2006, ApJ, 649, 14
- (14) Dijkstra M., Haiman Z., Spaans M., 2006, ApJ, 649, 37
- (15) Donley J.L., Rieke G.H., Rigby J.R., Pérez-González P.G., 2005, ApJ, 634, 169
- (16) Dunkley J., et al., 2008, arxiv-0803.0586
- (17) Eales S.A., Rawlings S., Dickinson M., Spinrad H., Hill G.J., Lacy M., 1993, 409, 578
- (18) Elvis, M., et al.1994, ApJS, 95, 1
- (19) Fadda D., Jannuzi B.T., Ford A., Storrie-Lombardi L.J., 2004, AJ, 128, 1
- (20) Fadda et al., 2006, AJ, 131, 2859
- (21) Fardal M.A., Katz N., Gardner J.P., Hernquist, L., Weinberg D.H., Romeel D., 2001, ApJ, 562, 605
- (22) Fanaroff B.L. Riley J.M., 1974, MNRAS 167, 31
- (23) Francis P.J., et al., 2001, ApJ, 554, 1001
- (24) Francis P.J., & McDonnell, S, 2006, MNRAS, 370, 132
- (25) Garn T., Green D.A., Hales S.E.G., Riley J.M., Alexander P., 2007, MNRAS, 376, 1251
- (26) Gilli, Comastri & Hasinger, 2007, A&A, 463, 79
- (27) Haiman Z., Spaans M. Quataert E., 2000, ApJ, 537, 5
- (28) Haiman Z., & Rees, M.J., 2001, ApJ, 556, 87
- (29) Hardcastle M.J., Evans D.A., Croston J.H., 2007, MNRAS, 376, 1849
- (30) Jarvis M.J., Rawlings S.G., 2001, MNRAS, 319, 121
- (31) Jarvis M.J., et al., 2001, MNRAS, 326, 1563
- (32) Jarvis M.J., Wilman R.J., Röttgering H.J.A. Binette L., 2003, MNRAS, 338, 263
- (33) Jarvis M.J., van Breukelen C., Wilman R.J., 2005, MNRAS, 358, 11
- (34) Kellerman K.I., Sramek R., Schmidt M., Shaffer, D.B., Green R., 1989, AJ, 98, 1195
- (35) Koekemoer A.M. Bicknell G.V., 1998, ApJ, 497, 662
- (36) Lacy, M. et al.2004, ApJS, 154, 166
- (37) Lacy M., et al., 2005, ApJS, 161, 41
- (38) Lacy, M., et al., 2007, AJ, 133, 186
- (39) Lawrence A., 1991, MNRAS, 252, 586
- (40) Lonsdale, C. J. et al., 2003, PASP, 115, 897
- (41) Martínez-Sansigre A., Rawlings S., Lacy M., Fadda D., Marleau F.R., Simpson C., Willott C.J., Jarvis M.J., 2005, Nature, 436, 666
- (42) Martínez-Sansigre A., et al., 2006a, MNRAS, 370, 1479
- (43) Martínez-Sansigre A., Rawlings S., Garn T., Green D.A., Alexander P., Klöckner H.-R., Riley J.M., 2006b, MNRAS, 373, 80
- (44) Martínez-Sansigre, A., et al., 2007, MNRAS, 379, 6
- (45) Martínez-Sansigre, A., Lacy, M., Sajina, A. & Rawlings, S., 2008, ApJ, 674, 676
- (46) Matsuda Y., et al., 2005, ApJ, 634, 125
- (47) Maxfield L., Spinrad H., Stern D., Dey A., Dickinson M., 2002, AJ, 123, 2321
- (48) McCarthy P.J., Spinrad H., van Breugel W., Liebert J., Dickinson M., Djorgovski S., Eisenhardt P, 1990, ApJ, 365, 487
- (49) Neugebauer G., et al., 1980, ApJ, 238, 502
- (50) Nilsson K.K., Fynbo J.P.U., Møller P., Sommer-Larsen J., Ledoux C., 2006, A&A, 452, 23
- (51) Norman C., et al., 2002, ApJ, 571, 218
- (52) O’dea C.P., 1998, PASP, 110, 493
- (53) Oke, J.B. Gunn J.E., 1983, ApJ, 266, 713
- (54) Pei, Y.C., 1992, ApJ, 395, 130
- (55) Pentericci L., et al., 2000, A&A, 361, 25
- (56) Rawlings S.G., Saunders R., 1991, Nature, 349, 138
- (57) Richards G.T., et al., 2006, ApJS, 166, 470
- (58) Reuland M., et al., 2003, ApJ, 592, 755
- (59) Salpeter E.E., 1955, ApJ, 121, 161
- (60) Shim H., Im M., Pak S., Choi P., Fadda D., Helou G., Storrie-Lombardi L., 2006, ApJ, 164, 435
- (61) Siebenmorgen R., Freudling W., Kruegel E., and Haas M., 2004, AA, 421, 129
- (62) Simpson C., 2005, MNRAS, 360, 565
- (63) Simpson C., 2006, MNRAS, 372, 741
- (64) Smith D.J.B., Jarvis M.J., 2007, MNRAS, 378L, 49
- (65) Smith D.J.B., Jarvis M.J., Lacy M., Martínez-Sansigre, A, 2008, MNRAS, 389, 799
- (66) Steidel C.C., Adelberger K.L., Shapley A.E., Pettini M., Dickinson M., Giavalisco M., 2000, ApJ, 532, 170
- (67) Stern D., et al., 2002, AJ, 123, 2223
- (68) Urry C.M. Padovani P., 1995, PASP, 107, 803
- (69) van Ojik R., Röttgering H.J.A., Miley G.K. Hunstead R.W., 1997, A&A, 317, 358
- (70) Venemans B. P., et al., 2005, A&A, 431, 793
- (71) Villar-Martín M., Vernet J., di Serego Alighieri S., Fosbury R., Humphrey A., Pentericci L., 2003, MNRAS, 346, 273
- (72) Villar-Martín M., Tadhunter C., Morganti R., Holt J., 2005, MNRAS, 359, 5
- (73) Villar-Martín, M., 2007, NewAR, 51, 194
- (74) Villar-Martín, M., Tadhunter, C., Morganti, R., Holt J., 2005, MNRAS, 359, 5
- (75) Weidinger M., Møller P., Fynbo J.P.U., Thomsen B., 2005, A&A, 436, 825
- (76) Willott C.J., Rawlings S.G., Blundell K.M., Lacy M., 1998, MNRAS, 300, 625
- (77) Willott C.J., Rawlings S.G., Blundell K.M., Lacy M., 1999, MNRAS, 309, 1017
- (78) Willott C.J., Rawlings S.G., Blundell K.M., Lacy M., 2000, MNRAS, 316, 449
- (79) Willott C.J., McLure R.J., Jarvis M.J., Rawlings S.G., Hill G.J., Mitchell E., Dunlop J.S., 2003, NewAR, 47, 187
- (80) Wilman R.J., Jarvis M.J., Röttgering H.J.A., Binette L., 2004, MNRAS, 351, 1109
- (81) Wilman R.J., Gerssen J., Bower R.G., Morris S.L., Bacon R., de Zeeuw P.T., Davies R.J., 2005, Nature, 436, 227
- (82) Zylka, R. 1998, MOPSI Users Manual, (IRAM: Grenoble)