Six White Dwarfs with Circumstellar Silicates
Abstract
Spitzer Space Telescope spectra reveal 10 m silicate emission from circumstellar dust orbiting six externally-polluted white dwarfs. Micron-size glasses with an olivine stoichiometry can account for the distinctively broad wings that extend to 12 m; these particles likely are produced by tidal-disruption of asteroids. The absence of infrared PAH features is consistent with a scenario where extrasolar rocky planets are assembled from carbon-poor solids.
1 INTRODUCTION
Approximately 1-3% of single white dwarfs with cooling ages less than 0.5 Gyr possess an infrared excess resulting from a circumstellar disk (Farihi et al. 2008b). These same stars also have distinctively high atmospheric calcium abundances (Kilic et al. 2006, Jura et al. 2007a) even though photospheric metals normally are absent in white dwarfs in this temperature range (Zuckerman et al. 2003). The disks likely are caused by the tidal disruption of asteroids, and there is subsequent metal accretion onto the white dwarfs (see Jura 2008). Polluted white dwarfs and their disks are powerful tools to investigate extrasolar asteroids – the building blocks of extrasolar rocky planets.
There are 14 single white dwarfs currently known to have a definite or highly-likely continuum infrared excess (Zuckerman & Becklin 1987, Becklin et al. 2005, Kilic et al. 2005, 2006, Jura et al. 2007a, Kilic & Redfield 2007, von Hippel et al. 2007, Farihi et al. 2008a,b, Brinkworth et al. 2008, Melis et al. 2008, in preparation). Previously, spectra with the Infrared Spectrograph (IRS, Houck et al. 2004) on the Spitzer Space Telescope (Werner et al. 2004) have been reported for two stars: G29-38 (Reach et al. 2005, Reach et al. 2008) and GD 362 (Jura et al. 2007b). Both stars exhibit a strong 10 m emission feature whose red wing can be modeled as arising from olivine-like glasses. Here, we report IRS results for 6 additional white dwarfs with an infrared excess.
2 OBSERVATIONS AND DATA
IRS spectra would be desirable for all white dwarfs with a definite or highly-likely continuum infrared excess. We observed the first 6 white dwarfs listed in Table 1. An IRS spectrum was obtained for LTT 8452 by another group but never published; for completeness, we report the results here. We did not target G166-58 because a nearby bright background galaxy precludes useful observations at 8 m. SDSS 1228+1040 (Gaensicke et al. 2006, Brinkworth et al. 2008), PG 1457086 (Farihi et al. 2008b) and Ton 345 (Melis et al. 2008, in preparation), were not known to have an infrared excess at the time the present program was implemented.
Observations with IRS were executed during Spitzer Cycle 4, between 2007 July and 2008 February. Spectroscopy was performed in staring mode using modules SL1 and SL2 which essentially cover the 5–15 m region with spectral resolution between 64 and 128. The respective ramp times for these targets in each module are listed in Table 1 and were constrained by the expected sky backgrounds in the region of each target. Longer ramp times for these faint sources were prohibited by the predicted backgrounds lest the data become problematic due to saturation in the peak-up sections of the array (Spitzer Science Center 2007). Additionally, IRS observations of the white dwarf LTT 8452, performed during Cycle 2 in 2006 October, were extracted from the Spitzer archive for analysis.
The spectral data were processed with the IRS calibration pipeline, versions 15 (LTT 8452), 16 (EC 115071519 and GD 56), and 17 (GD 16, GD 40, GD 133, and PG 1015+161). The combined, sky-subtracted frames were manually corrected for bad pixels using the IRSCLEAN333http://ssc.spitzer.caltech.edu/postbcd/irsclean.html package, then processed with SPICE444http://ssc.spitzer.caltech.edu/postbcd/spice.html to perform spectral extraction. The optimal extract function was used for these relatively low signal-to-noise (S/N) data; first with the default aperture function (8 pixels at 12 m) to assess the proper calibration level, then with a custom aperture function (4 pixels at 12 m) to produce a higher S/N extraction. Data at both nod positions were averaged and the custom extraction data were scaled to the well-calibrated level of the default extraction, with all orders combined and averaged in regions of overlap. No inter-order adjustments were made to the data.
The S/N can be estimated by examining the spectra themselves and evaluating the deviation within regions where a featureless, flat continuum might be expected. In this manner, the S/N over the 9–11 m region was estimated by taking the mean flux in that region and dividing by the standard deviation in the 6-8 m region. The spectra shown in Figures 1–6 have S/N between 3.5 and 8.0 in the 9–11 m interval.
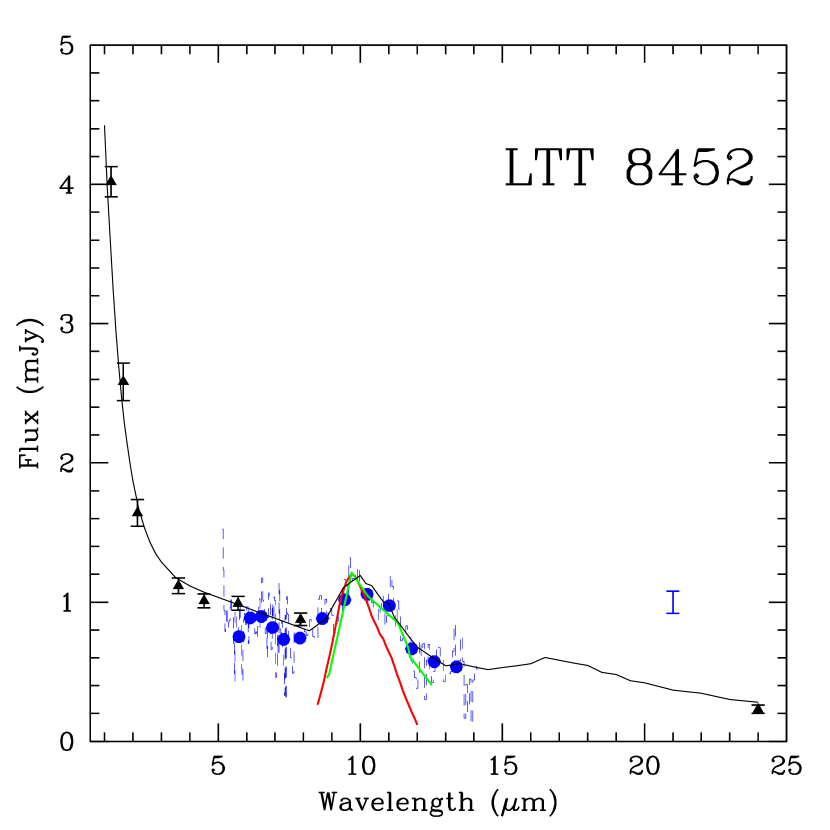
The IRS dataset for LTT 8452 is somewhat problematic; it appears to suffer from saturation effects in the peak-up portions of the array due to high background, and possibly from point source overexposure. While the latter does not produce an unrecoverable problem for IRS data, the former has the potential to significantly compromise the S/N and the spectrophotometric flux calibration. In the co-added spectroscopic BCD frames, the median flux levels in the blue and red sub-arrays are just above 850 and 1050 electrons s-1, respectively, corresponding to point source flux levels of more than 0.1 Jy, a value which saturates the blue sub-array in a ramp time of 14 seconds, and the red sub-array in around 30 seconds (Spitzer Science Center 2007). At least two bright point sources are seen in the peak-up arrays in the nod-subtracted spectroscopic frames, and it is likely the overall background level exceeded the recommended 25 MJy/sr limit for 240 sec ramp times (consistent with the background predictions made by SPOT for this object). In any case the spectroscopic signal is unaffected by flux bleeding from the peak-up sub-arrays; hence one can confidently say there are no features in the spectrum of LTT 8452 which are the result of the overexposure. However, the S/N is clearly compromised relative to expectations, and the overall calibration level does not match its IRAC photometry. The spectrum of LTT 8452 has been re-scaled up by a factor of 2.5 to match these fluxes.
No detectable signal was present in the IRS observations of PG 1015+161. It is likely the source was too faint for the short ramp times required by the relatively high background region of the sky.
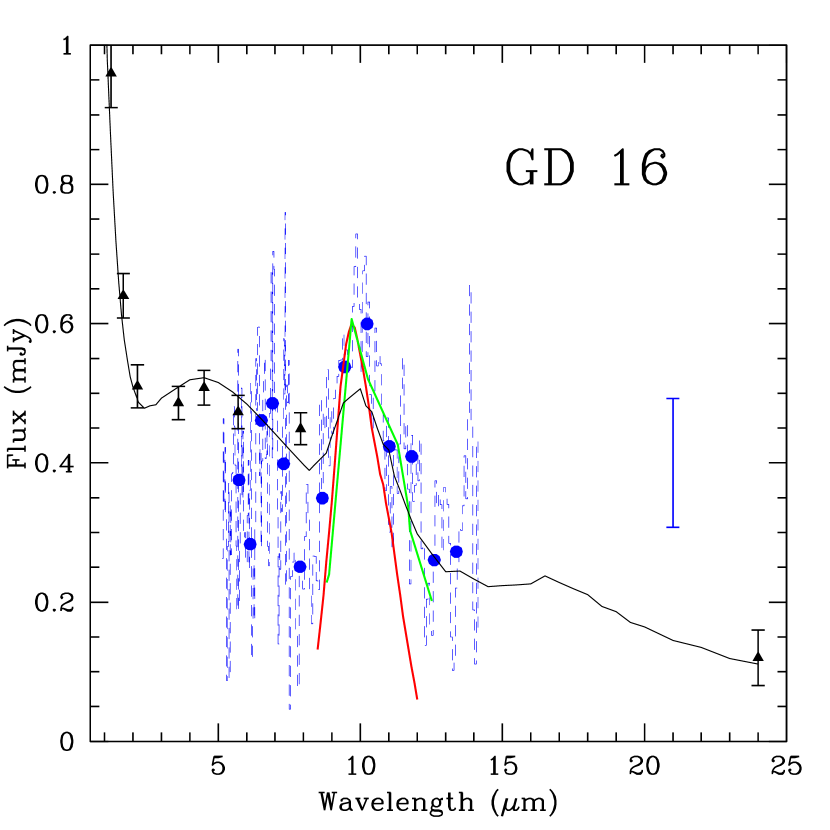
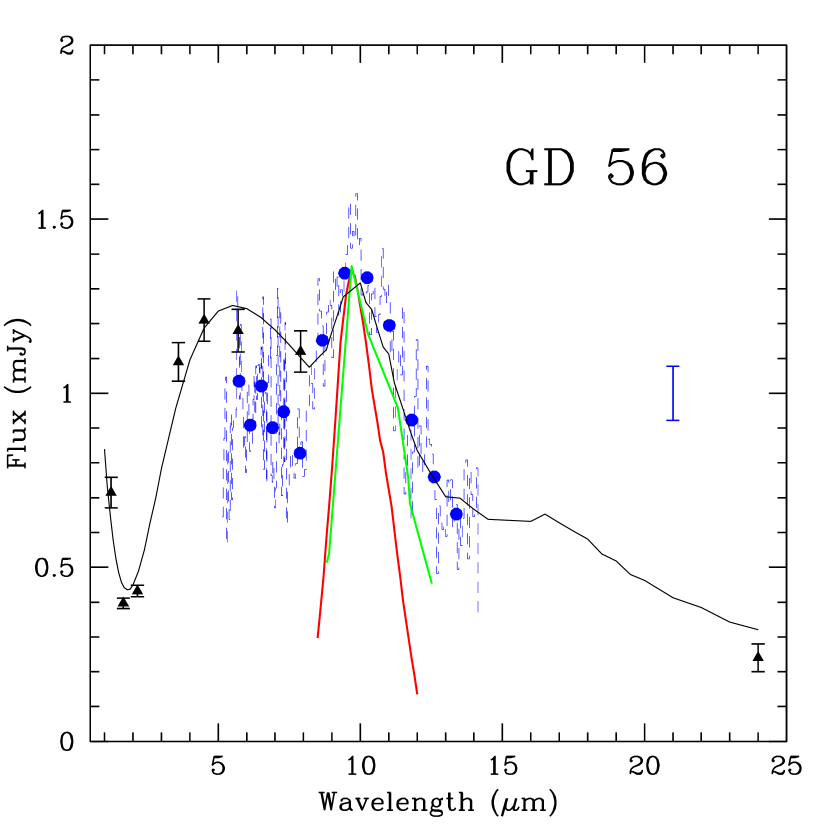
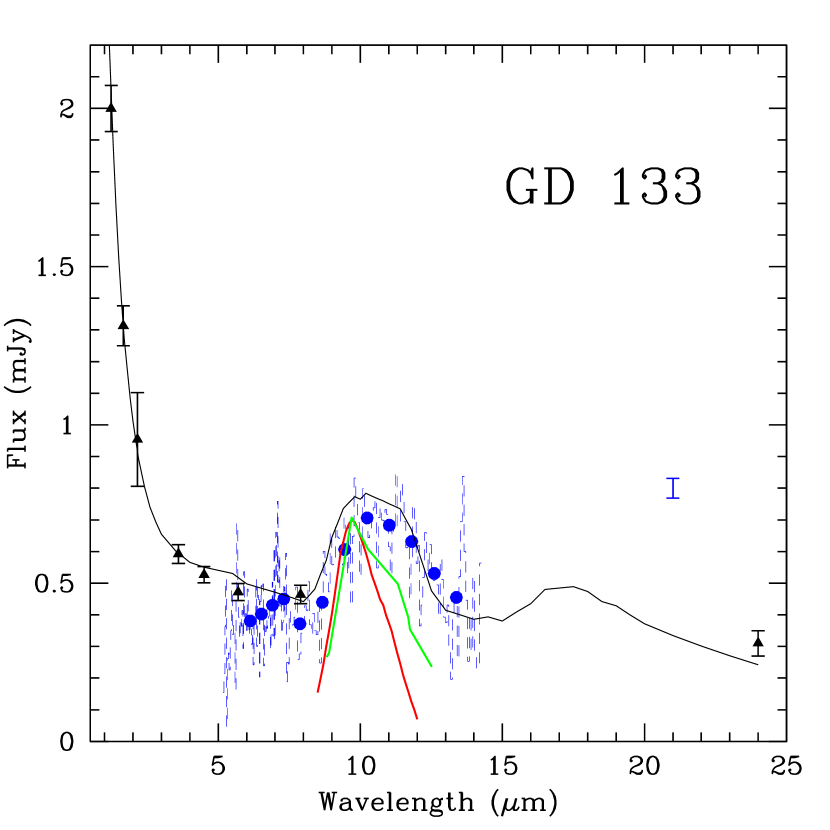
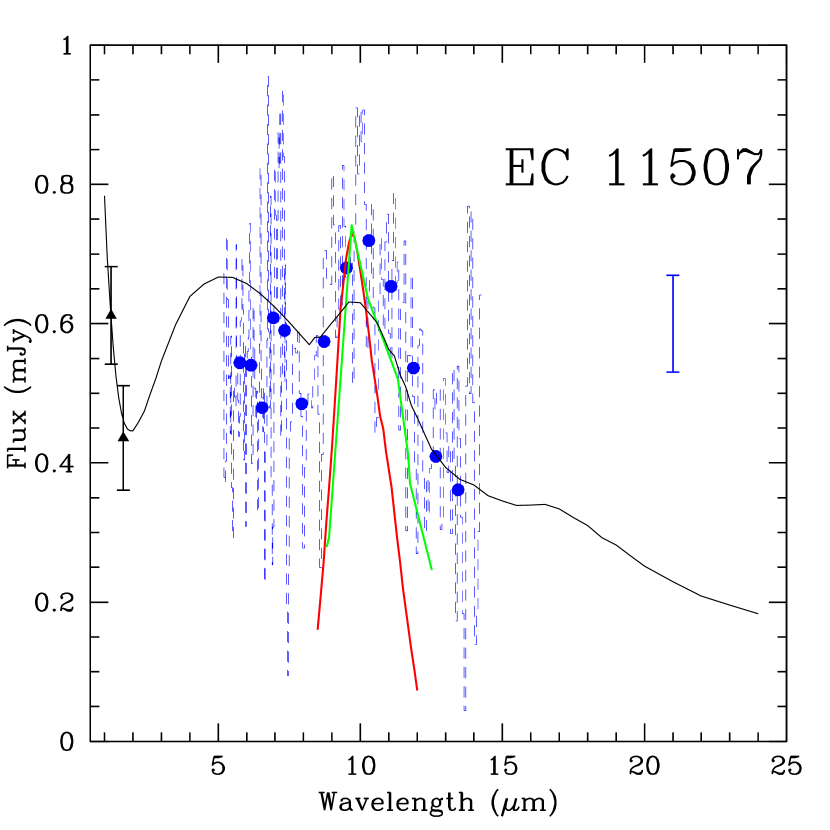
The resulting spectra with both smoothed and unsmoothed data along with relevant photometry are displayed in Figures 1–6. Additionally, for each star, we present the profile of the interstellar silicate feature inverted from absorption to emission (Kemper et al. 2004), the profile of the silicate emission in BD +20 307, a main-sequence debris disk star with a remarkably strong 10 m feature (Song et al. 2005), and a model of the circumstellar disk emission described in more detail below. According to Min et al. (2007), the interstellar silicate profile of Kemper et al. (2004) is generally representative of diffuse interstellar matter. In the study by Wyatt et al. (2007) of main-sequence debris disks with warm dust that emits near 10 m, BD +20 307 has by far the largest fraction of stellar luminosity that is reprocessed by dust in a system where the grains cannot be primordial. Thus the infrared spectrum of BD +20 307 likely is our best current measure of the spectrum of dust derived from extrasolar rocky parent bodies. Rhee et al. (2008) have reported an infrared excess around HD 23514, an F-type main-sequence star in the Pleiades, which, like BD +20 307, also reprocesses more than 1% of the host star’s luminosity. However, the silicate emission from HD 23514 peaks near 9 m, and the feature is very non-standard. Each observed white dwarf displays silicate emission that peaks near 10 m. All profiles are notably better matched by the profile from BD +20 307 than the interstellar profile, and in all cases the red wing of the feature extends to at least 12 m. The white dwarf spectra are more closely matched by dust derived from rocky parent bodies than by interstellar dust.
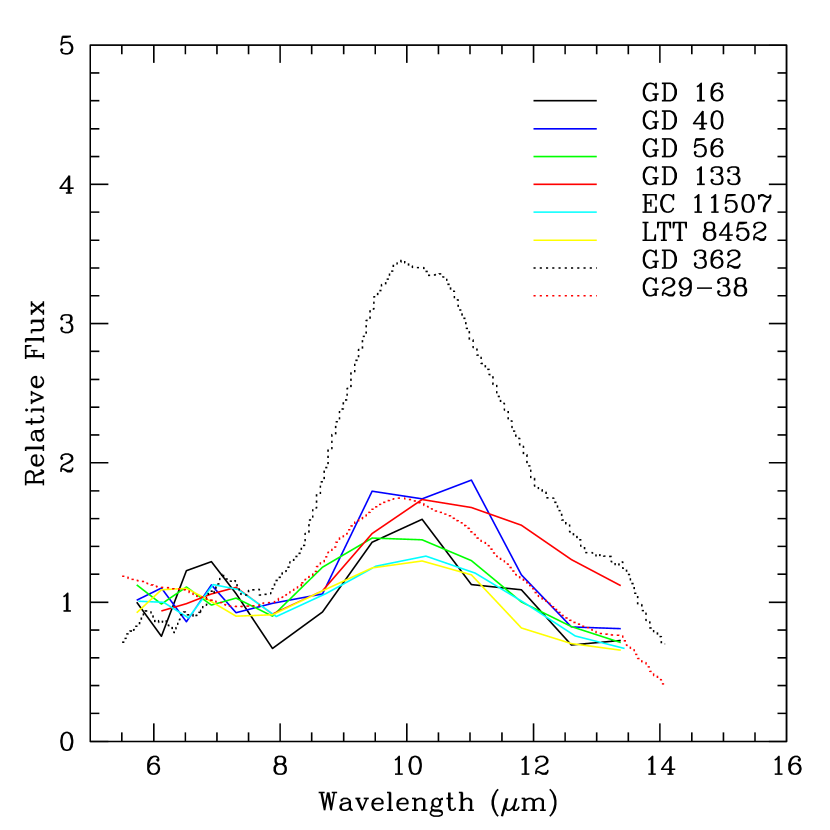
For comparison, the smoothed data from Figures 1–6 plus the IRS data for GD 362 and G29-38 are shown in Figure 7. The features are not identical; GD 362 exhibits the greatest line-to-continuum ratio while GD 133 possesses a particularly broad feature. We see no evidence of PAH emission or any other spectroscopic features.
3 MODELS
The continuum infrared fluxes which typically reprocess 1% of a white dwarf’s luminosity are fit by a flat, passive, opaque dusty disk (Jura 2003, Jura et al. 2007a). Our IRS observations show that typically 0.1% of the stellar luminosity is reprocessed as a 10 m silicate emission. While the overall disk parameters are largely determined by the continuum fluxes, we use the IRS data to constrain the composition of the circumstellar dust.
To exploit the IRS data, we elaborate upon our previous very simple models for white dwarf dust disks. In these models, the inner boundary is near the location where sublimation of silicates becomes rapid while the outer boundary lies within the tidal radius of the star. These simple models presume that the disk is vertically isothermal at every radius, as may occur in regions where the gas density is high enough for thermal conduction to be important and emission from such regions cannot explain the silicate features. There are at least two possible generalizations. (1) The “top” of the disk is directly illuminated by the light from the host star and is hotter than the midplane if thermal conduction is not dominant. Disks with little gas possess a vertical temperature gradient and an emission feature can result. (2) The outer zones of the disks can be optically thin. To explain the data for GD 362 with its particularly strong silicate emission, Jura et al. (2007b) employed both elaborations to the simple disk in a model with three radial zones. Here, except for GD 56 described below, we match the data in Figures 1–6 with models consisting of two radial zones.
We have found that both kinds of generalizations to the simple disk model can be made to fit the data. In order to compute models with a hot layer on top of a cold interior, we need to estimate thermal conduction by the gas as a function of location in the disk. While at least some disks contain gas (Gaensicke et al. 2006, 2007), its amount and spatial distribution are unknown. In this paper, because fewer unknown parameters are required, we only present results for calculations with an optically thin outer region.
In our models, each radial zone is characterized by the Planck-mean infrared optical depth measured vertically through the disk, . In the inner zone we assume 1 and that the dust is vertically isothermal. In this zone, at distance from the star of radius and effective temperature , the disk temperature, , is (Jura 2003):
| (1) |
The observed flux from the opaque portion of the disk depends upon its inclination angle.
In the outer zone, we take 1. However, even though the disk is vertically transparent, since light from the incident star arrives nearly parallel to the disk surface, it is mostly absorbed. If denotes the ratio of the mean opacity for absorption of optical and ultraviolet light compared to the mean opacity at infrared wavelengths where the dust emits, then at the “top” of the disk where the vertical optical depth is zero, the temperature, , is (Jura et al. 2007b):
| (2) |
For both the relatively large grains and the temperature range of interest here, we adopt the very rough approximation that = 1. Therefore, in this zone, the vertical temperature variation is (Jura et al. 2007b):
| (3) |
In equation (3), is the mean cosine of the slant angle of the radiation incident from the star onto the disk (Jura et al. 2007b):
| (4) |
Because we take 1, emission from both “sides” of the disk contributes to the observed flux which is independent of the disk inclination angle.
We list in Table 2, our adopted model parameters for each star. As described below, the model for GD 56 is more complex and requires additional parameters. Each model requires two stellar parameters: temperature, and angular radius, where is the distance between the Sun and the white dwarf. There are also 5 disk parameters: inner disk radius, , transition radius from being optically thick to optically thin, , outer disk radius, , disk inclination angle, , and grain radius, . We employ values of derived from the previous studies listed in Table 2. We fit from the and photometry with the assumption that emission from the disk is unimportant at these wavelengths and by approximating the stellar spectrum as a blackbody at its effective temperature. The disk parameters are chosen to fit the data shown in Figures 1–6.
We find the inner boundaries of the dust disks to be located where the grain temperature ranges between 1000 K and 1500 K according to equation (1) and therefore solids rapidly sublimate. We take to fit the strength of the silicate emission and to lie within the tidal radius of the white dwarf. Following Jura et al. (2007b), we assume the particles are glassy silicate spheres with an olivine stoichiometry with equal abundances of magnesium and iron (Dorschner et al. 1995). Olivines are the dominant silicates in a model of the spectrum of G29-38 (Reach et al. 2005), while Lisse et al. (2008) found that the red wing of the 10 m feature in the spectrum of the debris-disk binary system HD 113766 is mainly the result of olivines. For simplicity, we assume single-size dust particles with between 1 m and 2 m. In order to reproduce a strong emission feature at wavelength, , we expect that . This provides an upper limit to the particle size. We infer a lower bound to the particle size from two arguments. Small grains are likely to be relatively hot and sublimate rapidly. Also, as shown by Dorschner et al. (1995), particles with radii larger than 1 m display enhanced red wings to the silicate feature as found in our data. The model disk need not be unique (Jura et al. 2007a), but, here, we present results for only one set of parameters. Results are shown in Figures 1–6; within the uncertainties, the models reproduce the data.
Jura et al. (2007a) found their flat disk models for GD 56 under-predicted the measured fluxes between 3.6 m and 7.9 m. Since the infrared spectrum of GD 56 displays silicate emission similar to that found in other white dwarf disks, dust reprocessing of light from the central star – rather than some other source in the system – seems likely. Here, we show that a passive, warped disk can account for the data.
Armitage & Pringle (1997) have discussed warped disks, and Jura et al. (2007b) applied their models to a portion of the disk around GD 362. Asymmetries in the double-peaked optical emission lines seen in two disks (Gaensicke et al. 2006, 2007) indicate deviations from flat systems with material in circular orbits. Here, we consider a warped disk with a three-radial-zone model. The innermost zone of the disk is flat, opaque, vertically-isothermal, and unwarped. There is a transition radius, , where the disk is also opaque and vertically-isothermal, but warped. If is the cosine of the angle between the warped portion the disk and the line of sight to the central star so that = 0 corresponds to no warp, then in this portion of the warped disk:
| (5) |
We propose that the outer zone of the disk is optically thin but also warped. With the assumption that 1, the temperature variation within the outer zone of disk is modified from equation (3) to:
| (6) |
In this warped disk case, only the top half of the system is illuminated even in the optically thin outer zone. We consider a parameter regime where the warp angle is sufficiently small that the solid angle subtended by the infrared-emitting disk is not appreciably changed.
The warped portions of the disk receive more light and are warmer than if the disk was flat. Consequently, the model can account for more near-infrared emission than predicted for a flat disk. We show in Figure 3, with the warping parameters listed in the caption, a model that reproduces the data for GD 56.
Above, we have described disk models for the infrared excess seen at six white dwarfs. A natural explanation for such a disk is the tidal disruption of an asteroid that strayed close to the star. An alternative model to explain circumstellar dust orbiting a white dwarf is that grains are accreted from the interstellar medium and then drift inwards under the action of Poynting-Robertson drag. Such a model can be tested for white dwarfs where hydrogen is the dominant light element since the dwell time of metals in the atmosphere is sufficiently short that accretion must be ongoing. Specifically, four white dwarfs in Table 4 have atmospheres where hydrogen is the dominant light element, and the atmospheric dwell times for calcium are 10 days, 7 days, 9 days and 200 years, for GD 56, GD 133, EC 115071519 and LTT 8452, respectively (Koester & Wilken 2006). Using the metal accretion rates derived by Koester & Wilken (2006), Jura et al. (2007a) showed that the measured value of Fν(24 m) was lower than predicted by this interstellar accretion model by factors of 40 and 140 for GD 56 and GD 133, respectively. Extending their analysis (equation [3] in Jura et al. 2007a) to LTT 8452, and using the stellar distance and accretion rate given by Koester & Wilken (2006), the interstellar accretion model over-predicts Fν(24 m) by more than a factor of 1000. There is no reported measurement of Fν(24 ) for EC 115071519, so we do not consider this star. When relevant data are available, the tidally-disrupted asteroid model is favored.
4 DISCUSSION
All eight white dwarfs with IRS-measured spectra of their infrared excess exhibit a 10 m silicate emission feature with a red wing that extends beyond 12 m (Reach et al. 2005, Jura et al. 2007b, Figures 1–6). As discussed by Lisse et al. (2008), such features are characteristic of olivines and appear in the spectra of evolved solids associated with planet formation.
All white dwarfs with an infrared excess are sufficiently hot they could excite emission from circumstellar PAH’s, yet none do (this paper, Farihi et al. 2008a, Jura et al. 2007b, Reach et al. 2005, Reach et al. 2008). The mid-infrared spectra of 25% of Herbig Ae stars with near 10,000 K are dominated by PAH emission and they do not show any silicate features (Sloan et al. 2005). At least 50% of Herbig Ae stars (Meeus et al. 2001) display at least some PAH emission even if not dominant. Thus, qualitatively, the absence of PAH emission in their IRS spectra suggests that white dwarfs are orbited by silicate-rich, carbon-poor material. Currently, GD 40 and GD 362, two white dwarfs with infrared silicate emission, also have a detailed measure of their atmospheric composition. The apparently low carbon fraction in the disk is paralleled with a low carbon abundance in their atmospheres since (C)/(Fe) 1.02 in GD 362 (Zuckerman et al. 2007, Table 2) and (C)/(Fe) = 0.1 in GD 40 (Wolff et al. 2002). For reference, in the Sun, (C)/(Fe) = 9.3 (Lodders 2003).
The rocky material in the inner solar system is carbon deficient. In CI chondrites – the most primitive of meteorities – and in Earth’s mantle, (C)/(Fe) is 0.9 and 0.009, respectively (Lodders 2003, McDonough & Sun 1995). Our new data are consistent with the view that extrasolar asteroids are carbon-deficient by a factor of 10 or more (Jura 2006, 2008). Therefore the building blocks of extrasolar rocky planets have the same substantial carbon deficiency as found in the inner solar system.
5 CONCLUSIONS
We report 10 m silicate emission from dusty disks orbiting six externally-polluted white dwarfs. The red wings extending to 12 m are characteristic of micron-sized glasses with an olivine stoichiometry, particles that likely arise from tidally-disrupted asteroids. The strong silicate emission and the absence of PAH emission support the scenario that extrasolar rocky planets are assembled from silicate-rich, carbon-poor solids.
This work has been partly supported by NASA grants to UCLA and is based on observations made with the Spitzer Space Telescope which is operated by the Jet Propulsion Laboratory, California Institute of Technology, for NASA.
References
- (1) Armitage, P. J., & Pringle, J. E. 1997, ApJ, 488, L47
- (2) Becklin, E. E., Farihi, J., Jura, M., Song, I., Weinberger, A. J., & Zuckerman, B. 2005, ApJ, 632, L119
- (3) Boersma, C. et al. 2008, A&A, 448, 241
- (4) Brinkworth, C. et al. 2008, submitted
- (5) Dorschner, J., Begemann, B., Henning, Th., Jager, C., & Mutschke, H. 1995, A&A, 300, 503
- (6) Farihi, J., Zuckerman, B., & Becklin, E. E. 2008a, ApJ, 674, 431
- (7) Farihi, J., Jura, M., & Zuckerman, B. 2008b, submitted to ApJ
- (8) Gaensicke, B. T., Marsh, T. R., Southworth, J., & Rebassa-Mansergas, A. 2006, Science, 314, 1908
- (9) Gaensicke, B. T., Marsh, T. R., & Southworth, J. 2007, MNRAS, 380, L35
- (10) Houck, J. et al. 2004, ApJS, 154, 18
- (11) Jura, M. 2003, ApJ, 548, L91
- (12) Jura, M. 2006, ApJ, 653, 613
- (13) Jura, M. 2008, AJ, 135, 1785
- (14) Jura, M., Farihi, J., & Zuckerman, B. 2007a, ApJ, 663, 1285
- (15) Jura, M., Farihi, J., Zuckerman, B., & Becklin, E. E. 2007b, AJ, 133, 1927
- (16) Kemper, F., Vriend, W. J., & Tielens, A. G. G. M. 2004, ApJ, 609, 826
- (17) Kilic, M., & Redfield, S. 2007, ApJ, 660, 641
- (18) Kilic, M., von Hippel, T., Leggett, S. K., & Winget, D. E. 2005, ApJ, 632, L115
- (19) Kilic, M., von Hippel, T., Leggett, S. K., & Winget, D. E. 2006, ApJ, 646, 474
- (20) Koester, D., Napiwotzki, R., Voss, B., Homeier, D., & Reimers, D. 2005, A&A, 439, 317
- (21) Koester, D., & Wilken, D. 2006, A&A, 453, 1051
- (22) Lisse, C. M., Chen, C. H., Wyatt, M. C., & Morlok, A. 2008, ApJ, 673, 1106
- (23) Lodders, K. 2003, ApJ, 591, 1220
- (24) McDonough, W. F., & Sun, S.-s. 1995, Chemical Geology, 120, 223
- (25) Meeus, G., Waters, L. B. F. M., Bouwman, J., van den Ancker, M. E., Waelkens, C., & Malfait, K. 2001, A&A, 365, 476
- (26) Min, M., Waters, L. B. F. M., dde Koter, A., Hovenier, J. W., Keller, L. P., & Markwick-Kemper, F. 2007, A&A, 462, 667
- (27) Reach, W. T., Kuchner, M. J., von Hippel, T., Burrows, A., Mullally, F., Kilic, M., & Winget, D. E. 2005, ApJ, 635, L161
- (28) Reach, W. T., Lisse, C., von Hippel, T., & Mullally, F. 2008, ApJ, in press (astro-ph 0810.3276)
- (29) Rhee, J. H., Song, I., & Zuckerman, B. 2008, ApJ, 675, 777
- (30) Sloan, G. C. et al. 2005, ApJ, 632, 956
- (31) Song, I., Zuckerman, B., Weinberger, A. J., & Becklin, E. E. 2005, Nature, 436, 363
- Spitzer Science Center (2007) Spitzer Science Center. 2007, Spitzer Observer’s Manual, version 8 (Pasadena: SSC)
- (33) von Hippel, T., Kuchner, M. J., Kilic, M., Mullally, F., & Reach, W. T. 2007, ApJ, 662, 544
- (34) Werner, M. W. et al. 2004, ApJS, 154, 1
- (35) Wolff, B., Koester, D., & Liebert, J. 2002, A&A, 385, 995
- (36) Wyatt, M. C., Smith, R., Greaves, J. S., Beichman, C. A., Bryden, G., & Lisse, C. M. 2007, ApJ, 658, 569
- (37) Zuckerman, B., & Becklin, E. E. 1987, Nature, 330, 138
- (38) Zuckerman, B., Koester, D., Melis, C., Hansen, B. M., & Jura, M. 2007, ApJ, 671, 872
- (39) Zuckerman, B., Koester, D., Reid, I. N., & Hunsch, M. 2003, ApJ, 596, 477
APPENDIX
Reach et al. (2005) modeled the infrared excess emission from G29-38 with an optically thin circumstellar cloud including 3 1017 g of silicates. Here, we show that this mass of optically thin silicates is a natural extension of a flat, largely opaque disk described in 3. The maximum vertical thickness, , of any optically thin layer is determined by the cosine of the slant angle, , and the Planck-mean opacity for absorption of this light, (cm2 g-1). If the space density of the grains is , then:
| (A1) |
With inner and outer radii such that , then using equation (4), the total mass of optically thin dust, , on one side of the disk, is:
| (A2) |
For spherical grains of matter density and radius , we take:
| (A3) |
Reach et al. (2005) consider models with grains with a power law in the size distribution such that varies as and the radius range is 0.01 – 1000 m. For such grains illuminated by white dwarfs with near 10,000 K, a very approximate value of the mean size for absorption is near 1.0 m. In this case, with 3 g cm-3, then 2500 cm2 g-1 for optical and ultraviolet wavelengths where the white dwarf emits most of its light. For 100 and with = 8.2 108 cm (Jura 2003), then 2 1017 g. Reach et al. (2005) estimate that the optically thin cloud of dust contains 1018 g of which 75% is amorphous carbon to account for the continuum and 25% is silicate to explain the 10 m feature. Their inferred mass of 2.5 1017 g of optically-thin silicates is naturally computed for a flat, largely opaque, passive disk which then also accounts for the continuum fluxes.
Reach et al. (2008) have acquired additional IRS data for G29-38 beyond that described in Reach et al. (2005), and they describe two models that account equally well for the data. In their first model, the dust cloud is slightly opaque, while their second model includes both a optically thick disk and an optically thin outer region composed of silicates. This second model is similar to our models described above in for the six stars listed in Table 2. In this Appendix, we note that the optically thin emission may reside “on top” of the opaque disk rather than beyond it. In any case, a major difference between the completely optically thin model and the model with both an optically thin region and a flat, opaque disk and is the total amount of circumstellar mass. An optically thin cloud has 1018 g while an opaque disk can have orders of magnitude more mass. The atmospheres of GD 40 and GD 362 which are helium-rich and therefore have a particularly deep convective zone, have been contaminated by 1023 g of metals (Jura 2006, Zuckerman et al. 2007). Therefore, it is plausible that each of these two stars possesses a massive opaque disk in addition to an optically thin dust cloud of 1018 g.
Table 1 – Dusty White Dwarf IRS Targets
| WD | Name | Fν(2.2 m) | Fν(7.9 m) | Ramp | No. Cycles | Estimated |
|---|---|---|---|---|---|---|
| Time | S/N | |||||
| (mJy) | (mJy) | (sec) | ||||
| 0146+187 | GD 16 | 0.48 | 0.45 | 14 | 60 | 3.4 |
| 0300-013 | GD 40 | 0.38 | 0.16 | 60 | 30 | 4.7 |
| 0408041 | GD 56 | 0.58 | 1.11 | 60 | 7 | 8.0 |
| 1015+161 | PG 1015+161 | 0.26 | 0.12 | 14 | 110 | 0 |
| 1116+026 | GD 133 | 0.96 | 0.46 | 14 | 60 | 6.0 |
| 1150503 | EC 11507153 | 0.33 | 60 | 7 | 3.7 | |
| 2115560 | LTT 8452 | 1.64 | 0.88 | 240 | 13 | 5.5 |
Table 2 – White Dwarf and Dust Disk Properties
| Star | References | |||||||
|---|---|---|---|---|---|---|---|---|
| (K) | (10-12) | () | () | () | (m) | |||
| GD 16 | 11,500 | 4.7 | 0.90 | 11 | 23 | 150 | 1.0 | (a) |
| GD 40 | 15,200 | 3.6 | 0.15 | 13 | 35 | 100 | 1.5 | (b) |
| GD 56 | 14,400 | 3.4 | 0.75 | 30 | 65 | 110 | 1.0 | (c) |
| GD 133 | 12,200 | 7.0 | 0.19 | 12 | 50 | 150 | 2.0 | (c) |
| EC 115071519 | 12,800 | 3.3 | 1.00 | 10 | 30 | 150 | 1.5 | (c) |
| LTT 8452 | 9,700 | 11.0 | 0.27 | 8 | 30 | 100 | 1.0 | (c) |
In this Table, , and are the stellar effective temperature, radius and distance, respectively and are taken from available measurements. The disk inclination angle, , (defined so that = 0∘ is face-on), and radial locations of various zones of the disks and the grain radius, , are fit
to the data as described in the text.
Notes: (a) Koester et al. (2005), (b) Wolff et al. (2002), (c) Koester & Wilken (2006)