A Global Study of X-ray Binaries
Abstract:
We present preliminary results on a global study of X-ray binaries using 14 Ms of data from the Rossi X-ray Timing Explorer RXTE satellite. Our initial study on GX 339-4 is recapped as an introduction to the methods used. We use a consistent analysis scheme for all objects, with three different spectral models to fit the powerlaw and disc components. We also take into account the possibility of a line being present in the data. The resulting almost 4000 observations allow the tracking of the spectral properties of the binaries as they evolve through an outburst. Our investigations concentrate on the disc and line properties of the binaries when in outburst. We also show the Disc-Fraction Luminosity diagram for the population of X-ray binaries studied which will enable us to further links with AGN.
1 Aim
The aim of this study is to investigate the properties of the population of X-ray binaries, focusing on their outbursts. We start by applying a single data reduction scheme to one black hole X-ray binary, and then extend this to other black hole X-ray binaries whose outbursts have been observed by RXTE. We then plan to use the results of this study to further the links of X-ray binaries with AGN.
2 Data Reduction
The RXTE telescope has been observing the X-ray sky for the past 11 years, resulting in a long baseline to investigate the outbursts of X-ray binaries. We used all the public data on X-ray binaries in the RXTE Archive available on the 29 July 2008, corresponding to 4085 observations or 15.47Ms from 19 X-ray binaries.. The data were re-reduced to standardise the data-products for all observations rather than using the standard data-products. The data reduction and spectral analysis was scripted for consistency.
We use data from both HEXTE as well as PCA. The high energy sensitivity from HEXTE allows the high-energy power-law slope to be more accurately constrained, which assists greatly when investigating the disc, most of whose emission falls below the sensitivity bounds of the PCA. Of the five PCA detectors, however only one (PCU-2) has been on for the entire length of the mission, and so for consistency we use that. We use data from both HEXTE Clusters where reliable backgrounds could be created.
To allow for reliable, accurate and relatively quick spectral fitting we do not fit spectra which have fewer than 1000 background subtracted PCA counts. The excluded observations occur throughout the light-curves of the objects, with a concentration in low-flux periods. As our analysis concentrates on the outbursts of the binaries, our results should not be biased by the exclusion of this low counts data. We also require that there are more than 2000 background subtracted counts from both HEXTE clusters combined to allow the high energy powerlaw to be fitted accurately. This in turn means that the disc is more easily fitted. The well calibrated energy range of the PCA detectors extends to around keV at its lower bound. The temperatures of the X-ray binary discs are around keV and so being able to clearly fit the powerlaw component means that the disc is more easily fit.
3 Spectral Fitting
We fit the spectra in xspec, using PCA absolute channel number 7111Channel 7 varies from to kev over the lifetime of the mission. to an upper energy of keV and HEXTE keV. We use a channel rather than an energetic cut-off for the PCA as this allows us to have a well calibrated spectrum to the lowest possible energies; the energies corresponding to channel number changed throughout the mission and all channels greater than 6 are well calibrated. The galactic absorption was fixed to values taken from more detailed studies of the binaries222The limitations on the low energy spectra from the PCA do not allow us to accurately fit the absorption as a free parameter in the spectrum.. To investigate the state of the X-ray binaries we fit three types of model: powerlaw, broken powerlaw and disc +powerlaw333We investigated fitting comptonisation models. However, only for the spectra with the largest numbers of counts was it possible to obtain accurate fits where no parameters required fixing. As we wanted to have an automated routine, and many spectra had orders of magnitude fewer counts, we decided not to pursue these models any further.. A version of each model also having a Gaussian line at fixed energy of keV was fitted. In fitting spectra of GX 339-4, when a broken powerlaw was selecting as the best fitting model (126/700), 87 have and a break energy of around keV and 39 have with a break energy of around keV. Most of those with occur on the rise before the 2002/03 Outburst.
The best fitting model was selected on terms. To test for the significance of the line we used both an F-test and also made sure that the line components normalisation was at least three times its error. We excluded all low flux observations erg/s as well as ones where the flux was not well determined. This resulted in a final list of 3680 observations corresponding to 14.05Ms.
4 GX 339-4
In this Section we recap some of the results presented in [2] on the outbursts of GX 339-4. The extra data available in the archive subsequent to the initial study has been included here.
4.1 Outbursts
In Fig. 1 we show the standard Hardness Intensity Diagram (HID) for all the observations of GX 339-4. The colour-scale and symbol type show the best fitting model for that observation. We also show the X-ray colours where the source transitions between the hard, intermediate444We do not distinguish between the hard-intermediate and soft-intermediate states here. and soft states.
The limitations of using RXTE data are apparent in the HID as only when the disc is very bright is it easily fit in the spectrum. The broken powerlaw points may well have a disc component, but the curvature of the disc compared to the absorbed powerlaw is not sufficient to cause the disc to be taken as the best fitting model in the intermediate states. The similarity in the transition fluxes between some of the outbursts is clearly visible, especially on the return to the hard state.
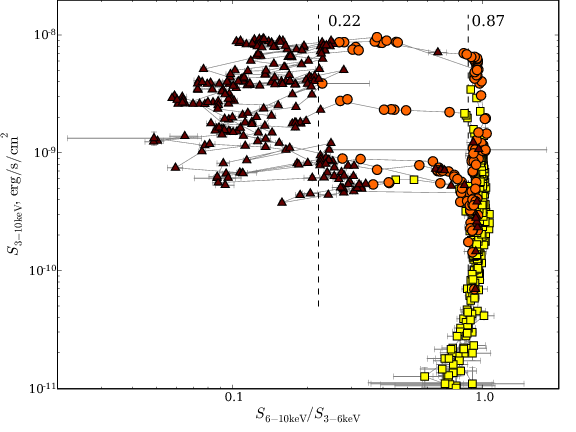
We also show in Fig. 1 the similarity between two of the outbursts of GX 339-4. Both the flux of the binary, shown as the colour scale, and the X-ray colour through the outburst are very similar, though the duration of the outbursts are in a ratio of 4:3, and they are 2 years apart. The hardening of the spectrum in the middle of the outburst, where at the same time the flux increases, is seen in all three well sampled outbursts.
4.2 Discs and Lines
As we fit disc and line components to all spectra, we can study the evolution of these features as the outbursts progress.
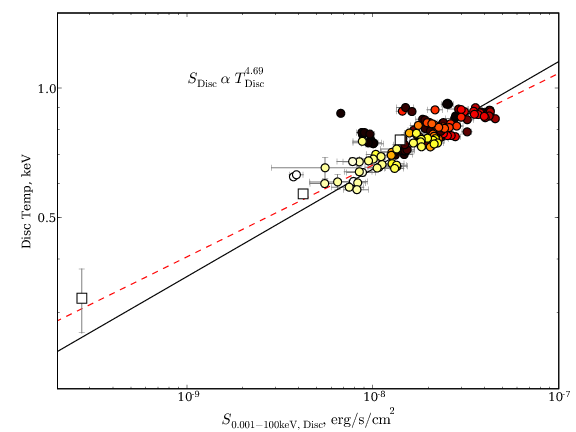
It is expected that discs follow a Stefan-Boltzmann like law where the flux goes as
as long as the geometry of the disc does not vary during the outburst. We show in Fig. 2 the change in disc flux as the temperature of the disc decays during the soft state. Although the best fit line does not quite match the theoretically expected relation, they are qualitatively consistent. The small range in temperature and flux combined with the scatter in the relation are the likely cause of the mis-match.
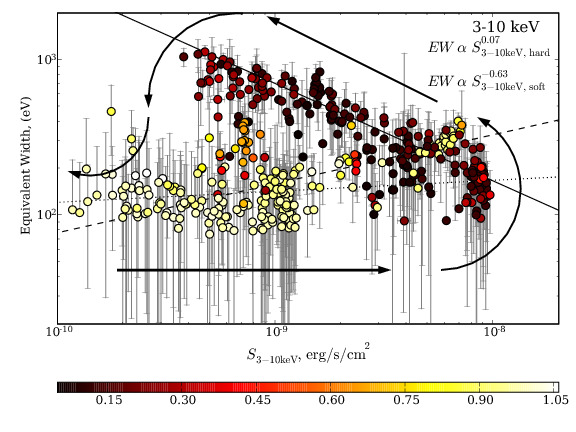
In many of the observations we are able to fit a significant line and extract reliable parameters for it. The variation of the line equivalent width (EW) with the flux is also shown in Fig. 2. The colour scale shows the X-ray colour of the observation. There appears to be little evolution of the EW with flux in the hard state. However, there is a clear anti-correlation in the soft state. This is very similar to the X-ray Baldwin effect observed in AGN. However, in GX 339-4 the variation is observed within observations of one object rather than from a study of many sources.
The AGN X-ray Baldwin effect has been mainly seen in studies of radio quiet AGN [11, 5, 1]. In the standard model for X-ray binary outbursts derived primarily from X-ray and Radio observations [3], bright radio emission is not expected or observed in the soft state. Therefore the analogy between X-ray binaries and AGN is supported by this Baldwin effect in GX 339-4.
4.3 Links to AGN
A number of studies have to date linked properties of X-ray binaries and AGN together, where observed and derived parameters are scaled by, for example, mass or accretion rate. When trying to construct a more general version of the HID to use for AGN, [6] developed the Disc Fraction Luminosity Diagram. The luminosity of an X-ray binary or AGN can easily be calculated. The X-ray colour varies a large amount during an X-ray binary’s outburst, showing the relative levels of the disc and powerlaw emission. However in AGN, it tends to give indications on to the presence and characteristics of a warm absorber or other absorption features in the spectrum. The reason being that the AGN disc’s emission peaks in the UV, whereas in X-ray binaries the discs are hotter and emit mainly in the soft X-ray band.
Therefore generalise the X-ray colour axis to enable comparisons to AGN to be performed, the Disc Fraction was calculated. This determines the amount by which the disc dominates the emission from the source. The X-ray colour does this very well for AGN, but it is difficult to compare between sources, as the absorption cannot be taken into account. [6] defined the disc fraction as
In reality this is the powerlaw fraction, however rather than use the true disc fraction (1-powerlaw fraction), we use this as the scales change in the same way as in the HID. This makes comparing the HID and DFLD easier and re-training of the brain not a problem.
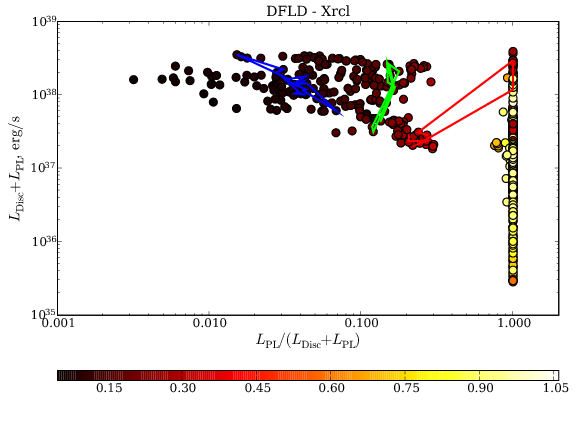
The disc and powerlaw luminosities are trivially extracted from the spectral fitting routine and the DFLD is shown in Fig. 3. We also show the mapping of the X-ray colour onto the DFLD. It is a non-linear mapping, expanding out the high luminosity soft state and compressing the low luminosity regions. We also note that because of the limitations of the RXTE data, non-dominant discs in the intermediate states are not well detected in GX 339-4.
5 Population Study
As outlined in Section 2 we have attempted to study as many X-ray binaries whose outbursts were covered by RXTE. Of the 19 X-ray binaries analysed to date, we have observations of around 20 outbursts. Not all binaries have outbursts which were observed by RXTE and some have more than one. For the remainder of this analysis we use the Disc Fraction to indicate the states of the black holes rather than the X-ray colour for the reasons mentioned above, and also because the effects of galactic absorption can be accounted for. Previous work on comparing outbursts of X-ray binaries has been done by [4, 12].
5.1 DFLD
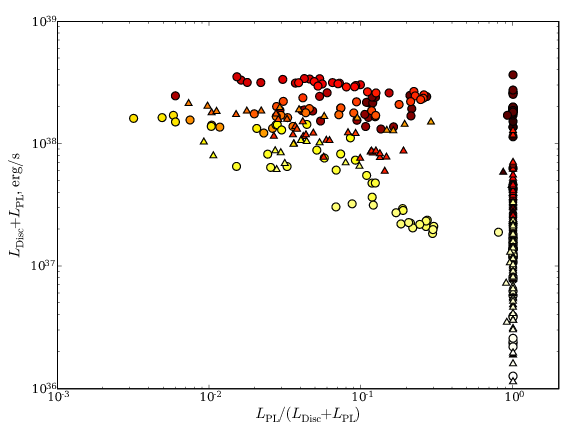
In Fig. 4 we show the DFLD for all of the binaries studied and for which reliable disc fractions could be calculated. The general shape is as expected from the preliminary study of GX 339-4, however the gap seen between the powerlaw and disc dominated states has been filled. The shape of the diagram is vary similar to that in [6] (see their Fig. 10).
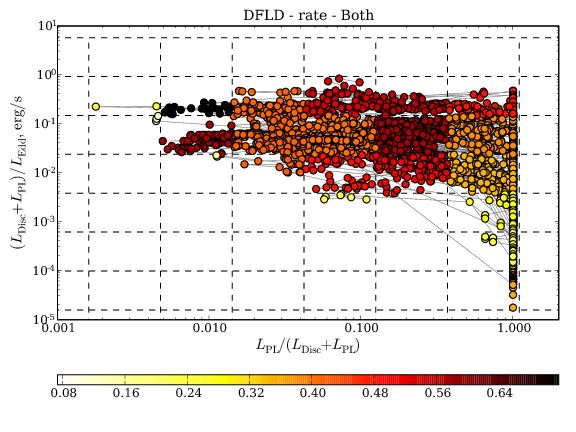
We calculate the rate of motion through the DFLD and present in Fig. 5 the results, when averaged within a given region of the DFLD. There is surprisingly little variation in the rate across the diagram, when taking into account that those regions with the fewest points tend to have extreme values. When splitting the rates into luminosity or disc fraction changes, the reason is clear. The movements in the two parameters nicely mirror each other. When there are large changes in the luminosity, the disc fraction is relatively constant (powerlaw dominated state) and vice versa in the disc dominated state. Further investigation is required to see if there is variation between objects or whether this quasi constant rate of motion through the diagram results from looking at the average for all objects.
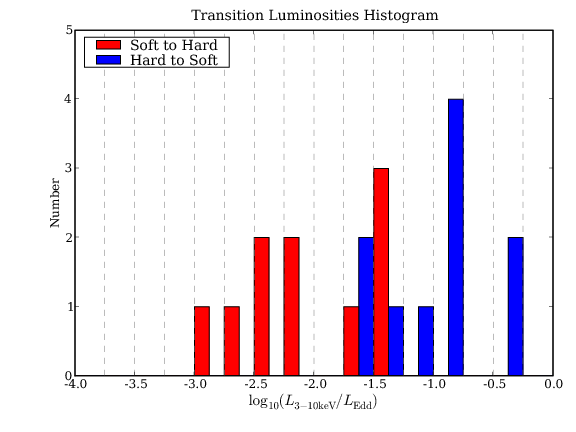
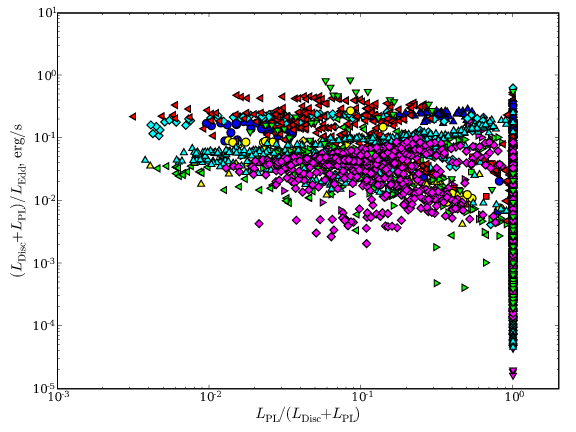
Having analysed the spectra for all the outbursts we have data for, we calculated the luminosities for the departure from and the return to the powerlaw dominated state. As can be seen in Fig. 6, in some cases we only have observations covering the last half of the outburst. Although in these cases we can easily determine the luminosity of the return to the powerlaw dominated state, we do not include these in the histogram of transitions shown in Fig. 5. We only show the luminosities for those outbursts where both the ingress to and egress from the soft state are determined.
[7] showed using the data at the time that the transitions from the soft to the hard state occurred at similar fractions of the Eddington rate (1-4%). They did restrict themselves to objects where there were good mass, distance and flux estimates for the transition times. At this stage in our analysis we have not restricted ourselves to objects which have these parameters well defined. However, there does appear to be some form of spread in both the outbound and return transitions, rather than a narrow peak.
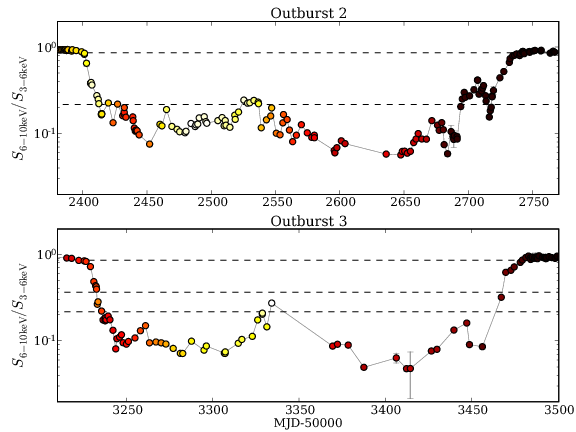
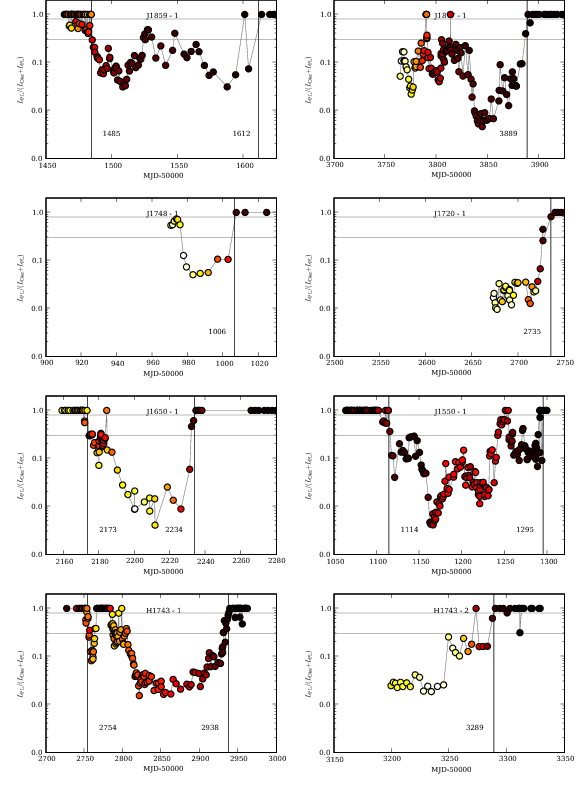
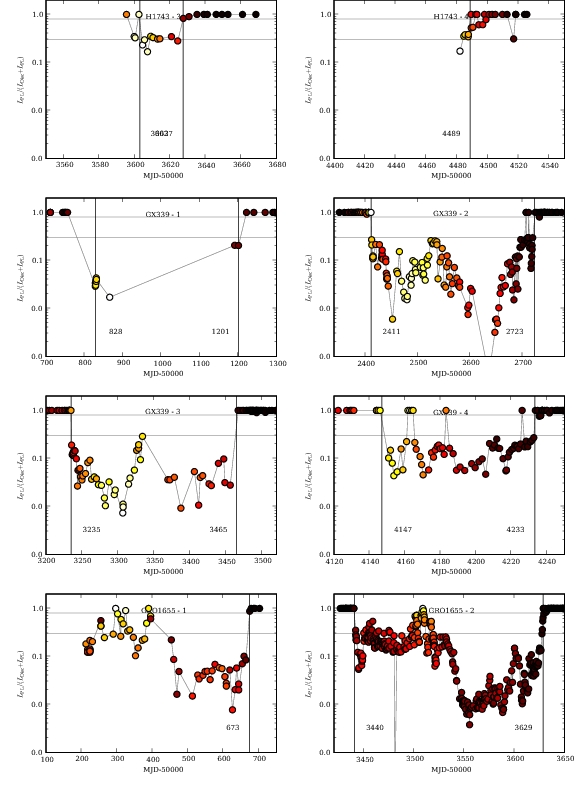
5.2 Outbursts
As the two outbursts presented in Fig. 1 were so similar, we investigated whether similarities existed between outbursts from other X-ray binaries. A selection of the outbursts analysed are shown in Fig. 6. The horizontal lines show the disc fractions used to delineate the powerlaw and disc dominated states. The vertical lines show when a transition has been deemed to occur. In a number of the well sampled outbursts, the hardening of the spectrum in the middle of the disc-dominated state and the associated brightening of the source is seen. Even in some of the outbursts where only the tail end is observed, there are hints that this feature is also present.
6 Summary
We have analysed 14Ms of RXTE data on 19 black-hole X-ray binaries, with the aim of studying their outbursts as well as the disc and line properties. We have presented preliminary results from this study, including a new diagnostic diagram derived from the luminosities of the different spectral components. Using this disc fraction we are able to take into account the differing galactic absorptions for different objects. We show that the rate of motion through the diagram is fairly uniform. There are also clear similarities between outbursts of different objects when the variation in disc fraction is plotted against the date of the observation. These disc-fraction curves also let the transitions from hard to soft and vice versa to be calculated and we show the distribution of transition luminosities.
References
- [1] S. Bianchi, M. Guainazzi, G. Matt, N. Fonseca Bonilla, 2007, On the Iwasawa-Taniguchi effect of radio-quiet AGN, A&A, 467, 19
- [2] R. J. H. Dunn, R. P. Fender, E. Körding, C. Cabanac & T. Belloni, 2008, Studying the X-ray hysteresis in GX 339-4: the disc and iron line over one decade, MNRAS, 387, 545
- [3] R. P. Fender, T. M. Belloni, E. Gallo, 2004, MNRAS, Towards a unified model for black hole X-ray binary jets, 355, 1105
- [4] J. Homan, T. M. Belloni, 2004, Ap&SS, The evolution of black hole states, 300, 107
- [5] K. Iwasawa, Y. Taniguchi, 1993 ,The X-ray Baldwin Effect, ApJ, 413, 151
- [6] E. Körding, S. Jester & R. Fender, 2006, Accretion states and radio loudness in active galactic nuclei: analogies with X-ray binaries, MNRAS, 372, 1366
- [7] T. J. Maccarone, 2003, Do X-ray binary spectral state transition luminosities vary?, A&A, 409, 697
- [8] J. M. Miller et al., 2004, Evidence of Black Hole Spin in GX 339-4: XMM-Newton/EPIC-pn and RXTE Spectroscopy of the Very High State, ApJ, 606, L131
- [9] J. M. Miller et al., 2004, Chandra/High Energy Transmission Grating Spectrometer Spectroscopy of the Galactic Black Hole GX 339-4: A Relativistic Iron Emission Line and Evidence for a Seyfert-like Warm Absorber ApJ, 601, 450
- [10] J. M. Miller et al., 2006, A Long, Hard Look at the Low/Hard State in Accreting Black Holes, ApJ, 653, 525
- [11] K. L. Page et al., 2004, An X-ray Baldwin effect for the narrow Fe Ka lines observed in active galactic nuclei, MNRAS, 347, 316
- [12] R. A. Remillard, J. E. McClintock, 2006, X-ray Properties of Black-Hole Binaries, ARA&A, 44, 49