First Results from the IceTop Air Shower Array
Abstract
IceTop is a 1 km2 air shower detector presently under construction as a part of the IceCube Observatory at South Pole. It will consist of 80 detector stations, each equipped with two ice Cherenkov tanks, which cover 1 km2. In 2008, the detector is half completed. One of the design goals of the detector is to investigate cosmic rays in the energy range from the knee up to approaching 1 EeV and study the mass composition of primary cosmic rays.
In this report the performance of IceTop, the shower reconstruction algorithms and first results, obtained with one month of data with an array of 26 stations operated in 2007, will be presented. Preliminary results are shown for the cosmic ray energy spectrum in the range of 1 to 80 PeV. Being located at an atmospheric depth of only 700 g/cm2 at the South Pole, a high sensitivity of the zenith angle distribution to the mass composition is observed.
The main advantage of IceTop, compared to other detectors in this energy range, is the possibility to measure highly energetic muons from air showers in coincidence with the IceCube detector. The muon rate at a given air shower energy is sensitive to mass composition. The prospects of this method and alternative methods to scrutinise different composition models will be presented.
I Introduction
Cosmic rays in the PeV to EeV energy regime, where the transition from galactic to extragalactic cosmic rays is expected, are studied by detecting extensive air showers (EAS) they produce in the atmosphere. In its maximum in terms of particle number, an EAS predominantly consists of electromagnetic particles. IceTop [1], located at on the south polar glacier, is built to detect showers from cosmic rays in that energy regime close to their maximum. It is built on top of the IceCube detector [2, 3], which is located between and depth. IceCube is able to detect the light from the bundles of highly energetic muons in the cores of the EAS. The sizes of electromagnetic and muonic components of EAS can be used to draw conclusions on the composition of the primary particles and/or the particle physics that takes place in the beginning of the shower development. The main difference of IceTop/IceCube compared to other, mostly surface-bound, EAS arrays is the sensitivity of deep IceCube to early interaction processes, and the fact that the IceTop signal on the surface is predominantly created by electromagnetic shower particles. This complementary setup may therefore verify existing measurements or cancel out systematic discrepancies between them, which are for instance caused by the hadronic interaction models used in the simulation of EAS events.
Furthermore, studies can be done with IceTop alone, using different inclinations to study composition and the energy spectrum. Also, efforts are being put into the identification of single muons at high distances from the shower core, both in IceCube and IceTop. This may also allow for conclusions on the interaction models or composition.
Another physics goal not discussed in the following is the use of IceTop in the context of heliospheric physics [4].
II The IceTop Detector
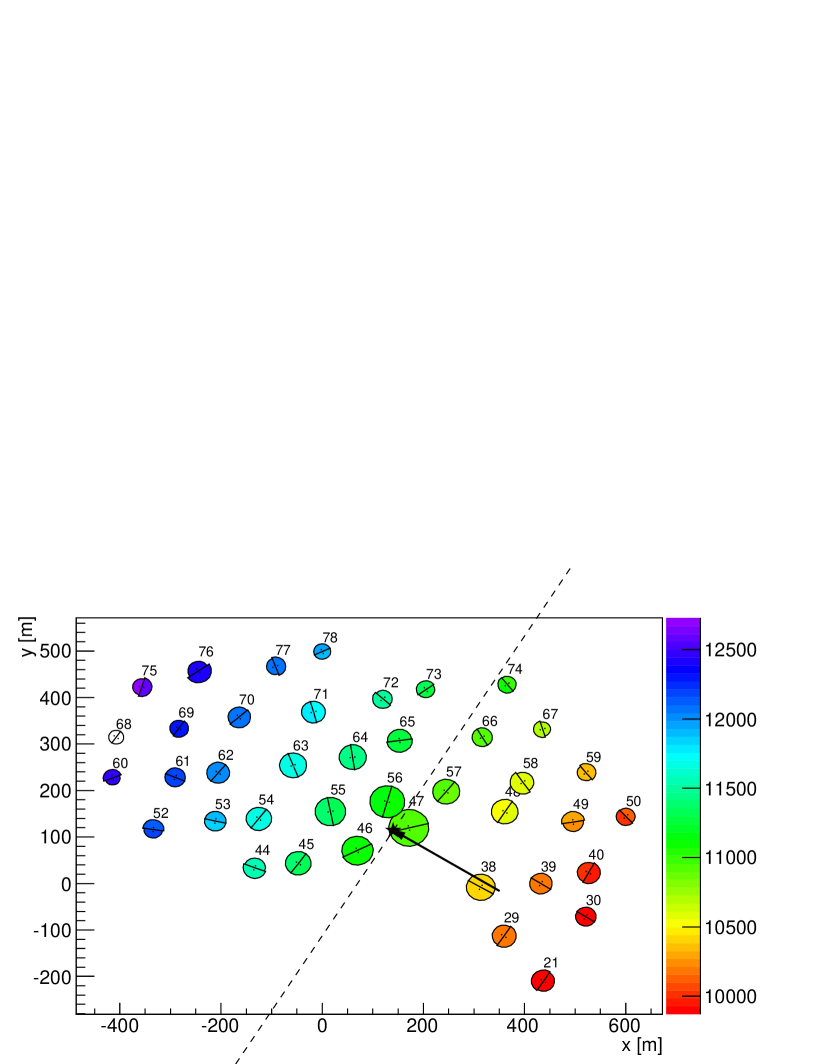
In 2007, when the data presented in this paper were taken, IceTop consisted of 26 detector stations on a triangular grid with a mean distance of . Each station comprises two diameter tanks filled with ice to a depth of . In each tank, two digital optical modules (DOMs) detect Cherenkov photons emitted by charged particles in air showers. The DOMs are mounted on top of the ice bulk, with their light sensitive halves frozen to the ice surface. A DOM is a light detection unit that contains a photomultiplier tube (PMT) and electronics to digitise recorded pulses with a precision of for about . Figure 1 shows the display of an event recorded with the 2008 detector configuration.
The light in the tanks can be reflected multiple times by the inside layers of the tank walls and may be recorded by one or both DOMs, depending on the pulse height and the DOM and trigger configuration. In 2007, the DOMs were run with two different gains to enhance the dynamic range. This lead to effective thresholds of about and , respectively. In 2008, the gain difference was slightly increased.
II-A Trigger and Calibration
To initiate the readout of DOMs, a coincidence of the two high gain DOMs of a station is required. Low gain DOMs are read out only if this local coincidence is already established. The data is written, and thus available for analysis, if the readouts of six DOMs are launched by a local coincidence. In 2007, the event rate with this configuration was about .
The low level processing and calibration of the data is done in several steps. First, an arrival time is defined by the leading edge of the pulse and the integrated charge of the pulse is converted into a number of equivalent photo electrons (PE). Making use of the muon calibration method [5], these values are further converted to vertical equivalent muons (VEM), which makes the analysis essentially independent of the exact simulation and understanding of the tank and ice properties, which otherwise would lead to high uncertainties.
The recording of waveforms in principle allows for sophisticated analyses, exploiting the information in the time structure of the pulse shapes to investigate the shower structure or particle content. At present, this is not being used.
III Shower Reconstruction
The data sets recorded with IceTop comprise a set of arrival times and calibrated signal sizes in units of VEM. Likelihood maximisation methods are used to reconstruct the location, direction and size of the recorded showers. In general, the arrival times contain the direction information and the charge distribution is connected to size and location of the shower centre. In practice, it turned out to be a stable and capable approach to start from simple first guess estimations of direction and shower core and iterate further with detailed likelihood functions. This also allows an eventual sensitivity of the arrival times to work on the core location.
III-A Fit Procedure and Data Cuts
The iterative process starts off with the analytic direction calculation under the assumption of a plane shower front, and the centre of gravity of the square root of charges (COGSC) as a seed for the shower core. Then a fit to the lateral distribution of charges is performed, keeping the direction fixed. If the core is found closer than to a station, the pulses of that stations are discarded and the fit is repeated. In the next step, a combined fit, using times, charges and a more realistic curved shower front assumption, leads to the final direction estimation. In this step, for stability reasons, the direction is kept flexible only in a limited range. Finally, the lateral function is fitted again with fixed direction to yield the shower size, energy and lateral power index results.
In this analysis, we require 5 or more triggered stations to ensure small errors on the fitted quantities. This leads to an effective reconstruction threshold (assuming a step function acceptance) of about . A constant efficiency is reached at about , depending on inclination.
The presently applied data cuts mainly assure the convergence of the fits and the containment of the events inside the array borders. The latter is achieved not only by requiring the fitted core position to be (about half a station distance) inside the array, but in addition asking the COGSC and the station with the highest charge to fulfill the same condition. The effective area of the 2007 array, reached with these cuts, is between and for zenith angles between and in the energy range of constant acceptance.
III-B Direction and Core Position
The final event direction is determined under the assumption of a fixed time delay profile relative to a plane shower front:
| (1) |
Here, is the expectation value of the time delay at a perpendicular distance from the shower axis , and is the expected (Gaussian) standard deviation at that radius. This shape was determined by fitting deviations from the fitted plane in experimental data. The radii depend on the core and direction parameters, so the fit is in general sensitive to both. The resolution that is achieved is and almost independent of energy and zenith angle.
The core position is determined after a lateral fit using the function introduced in [6]:
| (2) |
where again is the perpendicular distance to the shower axis, the signal expectation at a distance , a slope parameter related to the shower age, and a (lateral) curvature. In the fit, is used, leading to a shower size and a power index at that radius. was found constant in simulations and remains fixed in the fit.
The performance of the fit, in terms of likelihood distributions and retrieved parameter confidence intervals, is well in agreement with simulation. The achieved core resolution improves with energy, approaching at for zenith angles below .
III-C Energy Reconstruction
A simplified simulation study with proton showers was done to derive a functional form of an energy estimator for any given combination of shower size and reference radius (see also [6]). This was done because it allows us to chose the radius at which the shower size is defined, and the energy is extracted, for each event individually. At the radius where is independent from the power index parameter , the uncertainty on , and on the extracted energy estimator, is minimal. In the ideal case of a power law, this optimal radius is the mean of logarithmic radii of all fitted data points, . Consequently, to minimise the (statistical) error on the energy, is calculated for each event, using Eq. 2, and the energy estimator is derived from that.
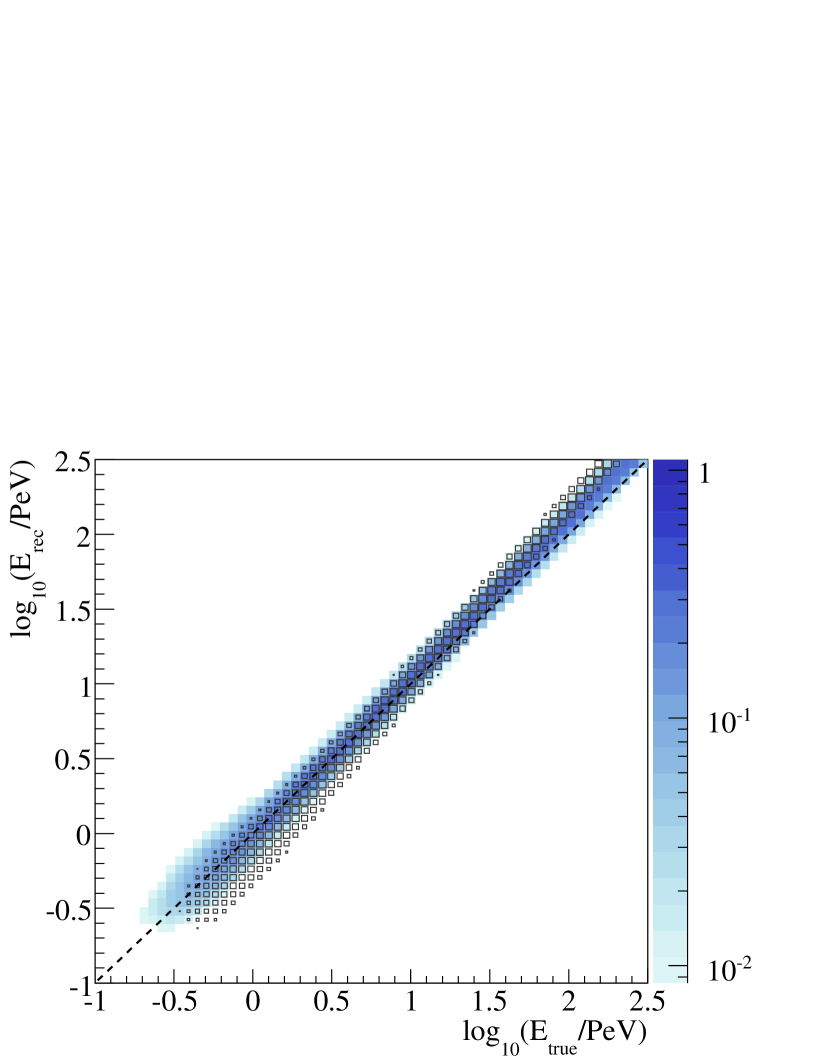
The energy resolution improves with energy and approaches in , or in , at for zenith angles below . A graphical display of the resulting response matrix can be seen in Fig. 2 for proton and iron nuclei. The faster development of showers from heavy primaries leads to a tilt of the bands against the diagonal of the matrix. Since IceTop is close to the shower maximum, the center of rotation, i.e. where the two bands cross, lies within the observed energy range. This means that at low energies, showers from heavy primaries look less energetic than proton showers, whereas at high energies they appear more energetic. It shall be noted that the point of rotation depends on many factors, such as the chosen energy extraction radius and inclination.
The deviation of the proton response from the diagonal at high energies is connected to inaccuracies of the simplified simulations with respect to the full detector simulation. It is corrected by the unfolding.
IV Studies with IceTop Alone
IceTop can be used as a standalone air shower detector, which allows for an early verification of the above techniques, analysing showers with zenith angles up to . The different attenuation of proton and iron showers, and its dependence on the zenith angle, leads to a deviation from the expected isotropic flux if an incorrect primary composition is assumed. In this way, IceTop alone is sensitive to composition [7].
IV-A Unfolding Techniques
The response matrix is defined in a way to relate the true energy spectrum to the measured distribution of first guess energies. It depends on the primary type and zenith angle. In the case of IceTop, the matrix is only two-dimensional, close to diagonal and the resolution does not vary much with energy. The unfolding of the spectrum, which essentially corrects for resolution and an eventual shift, is therefore not too difficult and was done with two iterative methods. One is a Bayesian approach as presented in [8], the other one is the Gold algorithm [9]. To determine correct error bands, a bootstrap method was used [10], which randomises the measured distributions within their error bands, analysing the resulting variations in the unfolded spectrum. The iteration depths were adjusted in simulation in a way that the deviation between unfolded spectrum and assumed true spectrum was minimised in the energy range of interest.
Both algorithms and the error determination were verified in simulation. The uncertainties that arise from the unfolding are only a minor contribution to the total systematic error.
IV-B Systematic Uncertainties
Presently, the main systematic error of the energy spectrum reconstruction comes from the calibration ( in ). Also, in this preliminary study, there are still some technical inaccuracies in the simulation, which for instance lead to an incorrect reproduction of the signal threshold function and consequently an inaccuracy of the likelihood function. These technical issues contribute another uncertainty in .
Minor systematic errors come from the unfolding procedure, and the statistical quality of the simulated datasets (each in ). In the CORSIKA shower simulation [11] two high energy interaction models were tested up to now, namely SYBILL2.1 [12] and QGSJet01.c [13]. The derived deviation in energy assignment between the two models was found to be less than , which is probably due to the low muon content of the IceTop signal.
The sum of systematic errors is about , slightly depending on energy. It is expected that most of the problems mentioned above will be solved in the near future.

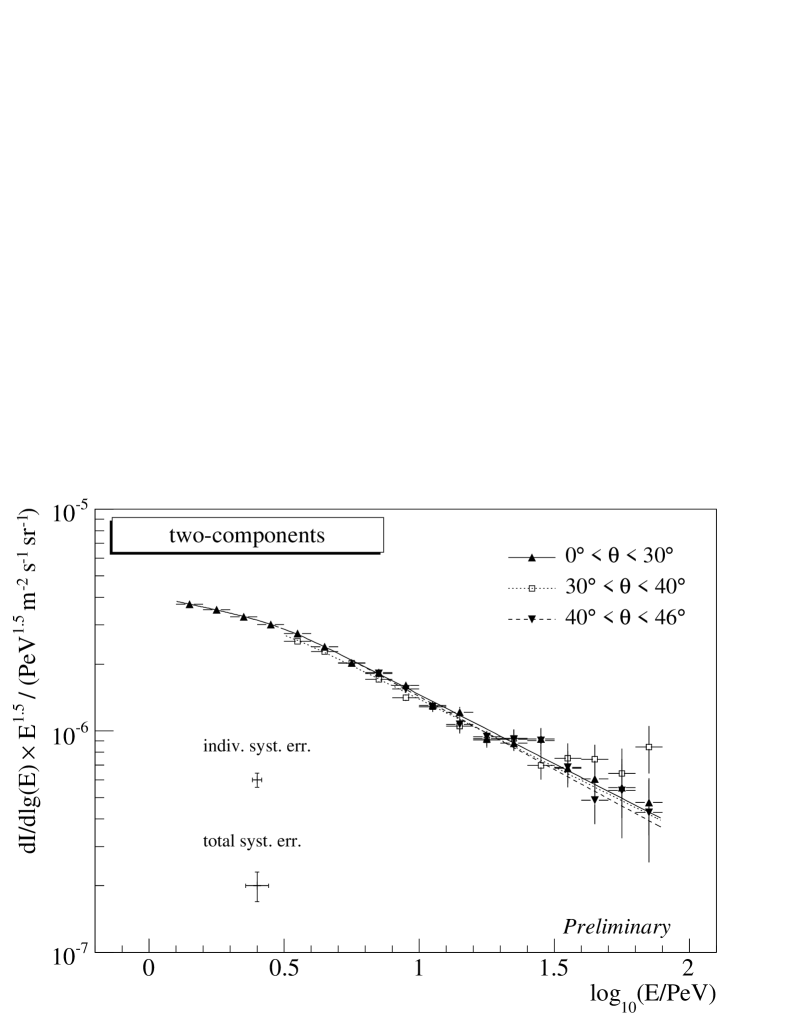
IV-C Analysis of Three Inclination Ranges
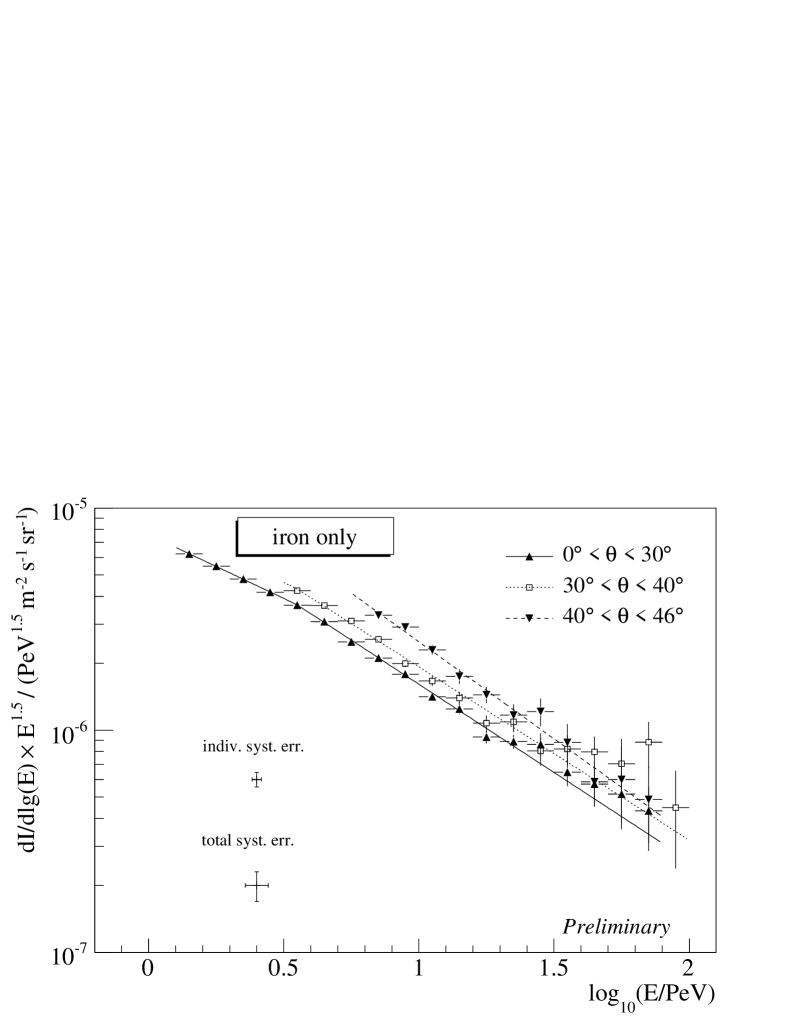
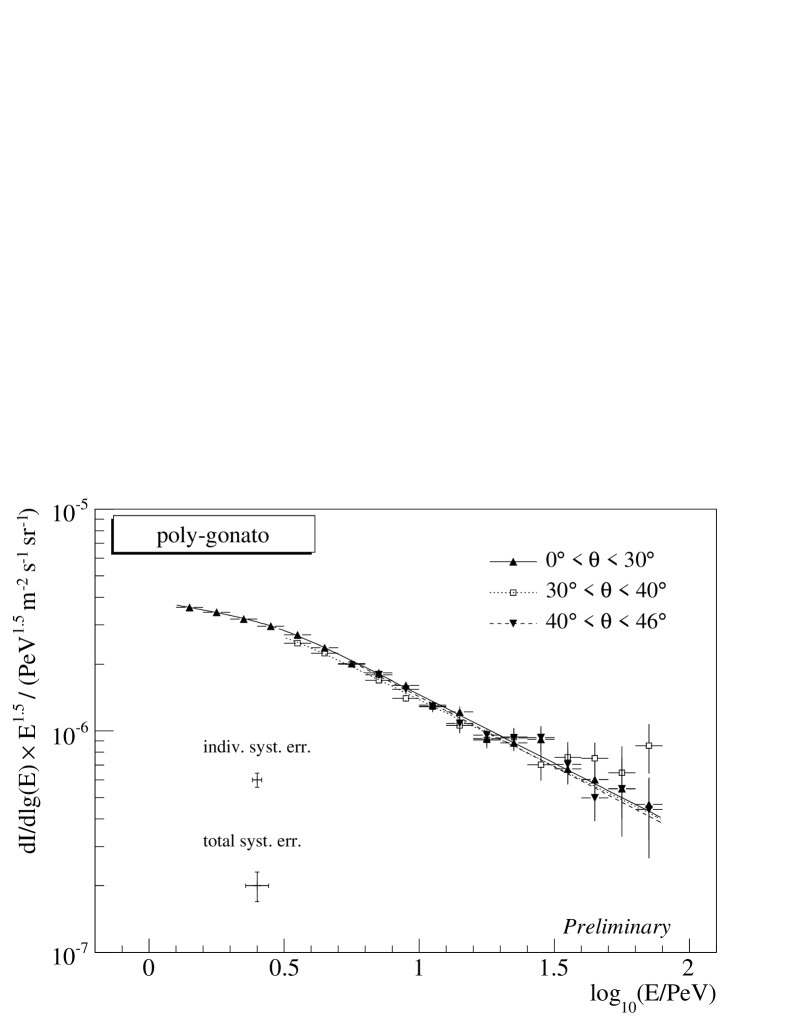
The air shower data recorded in August 2007 was subdivided into three zenith bands that are roughly equidistant in , namely , and . For each of these bands, a proton and an iron response matrix were simulated. In addition, two mixed composition response matrices were calculated. One is a two-component mixture of protons and iron [14]; the iron fraction increases from at to at . The other one is a 5-component implementation of the poly-gonato model that turned out optimal in [15]. Here, the elements above helium increase from to in the same range.
In both cases, the mixed composition matrices were calculated as a superposition of the proton and iron responses. Using them for unfolding means that only the relative composition goes into the analysis, not the absolute flux scales of the models.
Figure 3 shows the energy spectra resulting from the unfolding for the four response matrices. The pure proton and iron assumptions lead to deviating spectra with opposite ordering for protons and iron. Furthermore, the proton spectra diverge towards higher energies, whereas the iron spectra converge. This suggests that the response matrix needed for a isotropic flux must be generated assuming a mixed composition with a mean mass increasing with energy. In fact, the spectra obtained with the poly-gonato and two-components models do agree much better.
IV-D Results on Composition
To quantify the observed discrepancy of the unfolded spectra, likelihood values were calculated that characterise the compatibility of the spectra. The most sensitive method is to compare the values from the three zenith ranges with their mean for each individual spectrum bin. Since the absolute likelihoods rather characterise the statistical quality of the dataset than the model itself, likelihood ratios were taken to validate the models against each other. In this comparison, care was taken to distinguish between systematic errors that apply on all zenith bins equally (e.g. the muon calibration error) and errors that do or may apply on the zenith bins independently.
The likelihood ratios with respect to the poly-gonato model were for pure proton and for pure iron composition, respectively. This excludes both of the pure composition assumptions. No preference could clearly be identified between the two mixed composition models.
Although this finding is as yet not surprising, the power of it may increase considerably as systematic and statistical errors will be reduced in the near future. Furthermore, the benefit of this analysis is that it is complementary to the coincident measurement, since it exploits only the development of the (mainly electromagnetic) showers and therefore is less dependent on the production mechanisms for highly energetic muons.
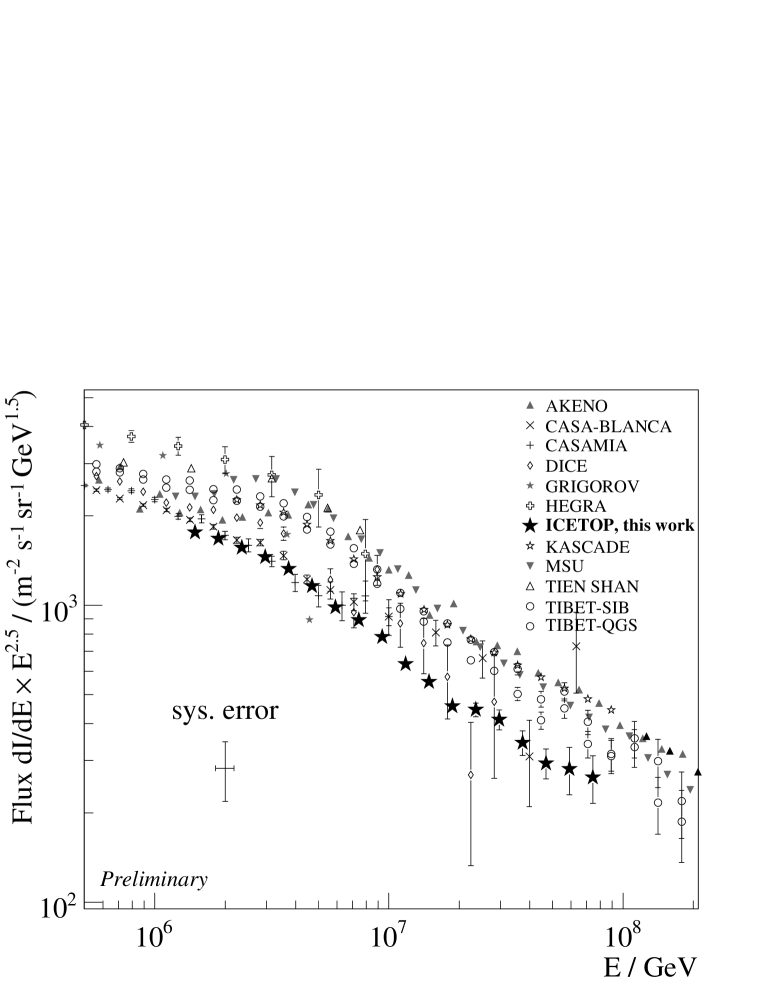
IV-E Results on the Energy Spectrum
Figure 4 shows several energy spectra from other experiments, along with a preliminary spectrum from IceTop, assuming the 5-component poly-gonato composition model. The two-components model delivers almost the same result and is equally qualified by the derived probabilities, so this choice by now is arbitrary. The following systematic errors are given for the context of the poly-gonato composition assumption, so they do not assess a possible deviation from that.
The spectrum can be fitted with a broken power law (). It determines the knee position at and a power index change from to . The preliminary estimate of the systematic uncertainty of the power indices is .
The absolute flux, or energy assignment, is below that of most other spectra. Taking into account the systematic error of our and the other measurements, however, the deviation corresponds to no more than about .
The low flux, or energy assignment, is a feature that is already found in the energy distributions before the unfolding. Simulation improvements in the near future will reduce the systematic error and probably clarify whether the reason of this deviation is physical or not.
V IceTop-IceCube Coincident Analysis
Detecting events with IceTop and IceCube in coincidence can be used to do a composition analysis, but also to improve the event reconstruction. Both of these efforts are still under development, but will make IceCube a three-dimensional air shower detector in the near future.
V-A Reconstruction of Coincident Events
Air showers near vertical, with the shower axis contained in both IceTop and IceCube, can be observed in coincidence. The signal in IceCube is caused by a muon bundle that usually has a spread of some tens of meters, which is much less than the grid constant (). This means that the single muon reconstruction algorithms used in the neutrino analysis of IceCube can in principle be applied to air shower data and lead to a good estimation of arrival direction. Existing simulations indicate that a combined IceTop-IceCube reconstruction may improve the overall shower direction resolution.
A muon bundle reconstruction has to consider the ice properties and longitudinal development of the muon number. It can lead to an estimation of size, i.e. muon content, and the spread of the bundle and its light in time and space. Adding the IceTop size and parameters, a coincident event is then characterised by at least 4-5 parameters and has only two variables to be determined, namely energy and mass. This allows for several reconstruction and analysis approaches that at present are still under development.
V-B Analysis of Coincident Events
A well-known quantity that is related to the primary mass of an cosmic ray air shower is the ratio of electromagnetic to muonic particles (). Heavy nuclei tend to produce more muons and in addition develop faster, which mostly leads to a lower on ground level.
The limiting issue in analyses is still the understanding of the early high-energetic interactions that strongly affect the muon production. It is therefore of great importance to have experiments that detect air showers in orthogonal approaches. Unlike many other experiments, IceTop has the ability to complement its almost dominantly electromagnetic signal at the surface with a measurement of the exclusive and highly energetic muon bundle in the deep IceCube detector.
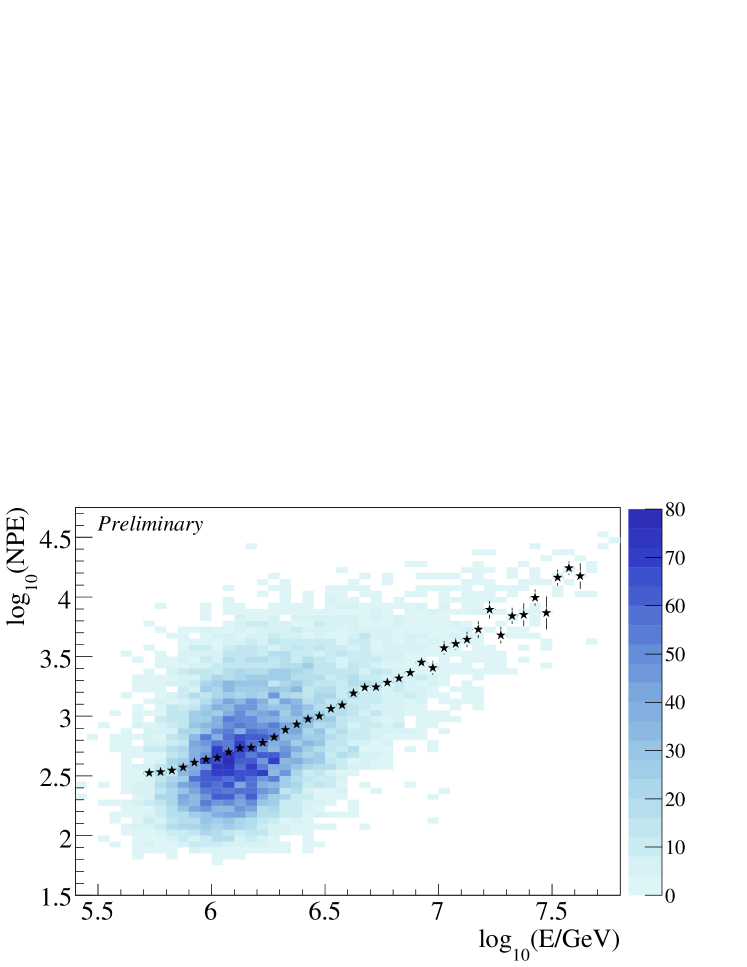
Figure 5 shows experimental data of photon numbers in IceCube vs. reconstructed energy in IceTop. As expected, the muon bundle size, related to the IceCube photon number, clearly increases with energy. Simulations show that the mean signals of the two extreme cases of proton and iron showers are significantly separated in this graph. As in other experiments, the strong variations, intrinsic to the hadronic shower cascades, require a statistical analysis of the data, probably involving unfolding and/or sophisticated event classification techniques.
VI Surface Muon Counting
Although IceTop records light curves in high precision in the tanks, muon signals are difficult to identify due to the quantitative dominance of electromagnetic particles. However, at large distances from the shower core, where the overall charge expectation is well below , single muons can produce bright signals that can be used to estimate their abundance in a statistical way. In 2007, the array was already big enough to identify such muons (Fig. 6).
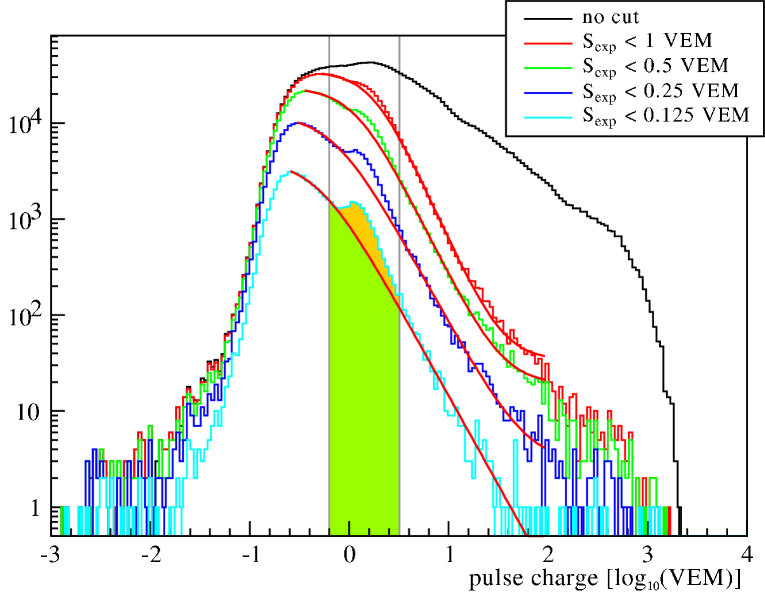
This can be a twofold benefit: First, the number of muons, or an estimator for it, can be used to do a composition analysis and scrutinise interaction models. A first work that is still in progress is comparing muon peak heights in data with those in simulations. It already reproduces the effect in general, and shows quite a large difference between proton and iron simulations, which suggests a good sensitivity for a composition analysis and model testing.
Secondly, the muon peak may be used to do an online monitoring of the calibration data, complementing the muon calibration runs that are currently done on a regular basis in between the data runs.
Also under study is the identification of highly energetic muons with high transverse momenta in deep IceCube. These may be seen far from the main muon bundle and deliver information about high- particles; the interactions that produce these particles may be understood in a perturbative QCD context [17].
VII Conclusion
The IceTop air shower array at the South Pole is half completed and continuously taking physics data. Shower reconstruction algorithms have been developed and tested. They lead to competetive resolutions in shower direction, core position and primary energy.
A first study of the energy spectrum, using IceTop as a standalone detector and the data from one month in 2007, yielded two results: First, a sensitivity on cosmic ray composition was found by comparing energy spectra from different inclinations. A first study, using pure proton, pure iron and two mixed modellings of cosmic rays, showed a clear preference for the two mixed composition models. Secondly, an energy spectrum between was extracted that shows all expected features, and, within uncertainties, agrees relatively well with other measurements.
The reconstruction and analysis of IceTop/IceCube coincident events is still under development. IceCube offers various possibilities to interpret the three-dimensional shower images, making use of time and signal height information on the surface and deep in the ice.
A new analysis is being developed that aims at the identification of single muon signals in IceTop, at large distances from the shower axis. This will lead to another, yet complementary composition analysis method and may be usable for testing air shower models.
References
- [1] T. Gaisser et al., in arXiv:0711.0353v1, Proc. 30th ICRC, Mérida, Mexico, 2007, pp. 15–18.
- [2] A. Achterberg et al., Astropart. Phys., vol. 26, pp. 155–173, 2006.
- [3] A. Karle et al., in arXiv:0711.0353v1, Proc. 30th ICRC, Mérida, Mexico, 2007, pp. 7–10.
- [4] T. Kuwabara et al., in arXiv:0711.0353v1, Proc. 30th ICRC, Mérida, Mexico, 2007, pp. 19–22.
- [5] L. Demirörs et al., in arXiv:0711.0353v1, Proc. 30th ICRC, Mérida, Mexico, 2007, pp. 47–50.
- [6] S. Klepser et al., in arXiv:0711.0353v1, Proc. 30th ICRC, Mérida, Mexico, 2007, pp. 43–46.
- [7] S. Klepser, “Reconstruction of extensive air showers and measurement of the cosmic ray energy spectrum in the range of 1 - 80 PeV at the South Pole,” Doctoral thesis, Humboldt-Universität zu Berlin, July 2008. [Online]. Available: http://edoc.hu-berlin.de/docviews/abstract.php?id=29166
- [8] G. D’Agostini, Nucl. Instrum. Meth., vol. A362, pp. 487–498, 1995.
- [9] R. Gold, Argonne National Laboratory Report ANL-6984, 1964.
- [10] B. Efron and R. Tibshirani, An introduction to the bootstrap. London: Chapman & Hall/CRC, 1998.
- [11] D. Heck, J. Knapp, et al., FZKA, vol. 6019, 1998.
- [12] R. Engel, T. Gaisser, P. Lipari, and T. Stanev, “Air shower calculations with the new version of SIBYLL,” in Proc. 26th ICRC, Salt Lake City, 1999.
- [13] S. Ostapchenko, AIP Conf. Proc., vol. 928, pp. 118–125, 2007.
- [14] R. Glasstetter et al., “Analysis of electron and muon size spectra of eas,” in Proc. 26th ICRC, Salt Lake City, USA, 1999. [Online]. Available: http://www-ik.fzk.de/KASCADE˙home.html
- [15] J. Hoerandel, Astropart. Phys., vol. 19, pp. 193–220, 2003.
- [16] A. Lucke, “Analysis of Signal Structures measured with the IceTop Detector to separate Electromagnetic, Muonic and Hadronic Component,” Diploma thesis, Humboldt-Universität zu Berlin, 2008.
- [17] S. Klein et al., in arXiv:0711.0353v1, Proc. 30th ICRC, Mérida, Mexico, 2007, pp. 35–38.