The Keck Aperture Masking Experiment: spectro-interferometry of 3 Mira Variables from 1.1 to 3.8 m
Abstract
We present results from a spectro-interferometric study of the Miras Cet, R Leo and W Hya obtained with the Keck Aperture Masking Experiment from 1998 Sep to 2002 Jul. The spectrally dispersed visibility data permit fitting with circularly symmetric brightness profiles such as a simple uniform disk. The stellar angular diameter obtained over up to 450 spectral channels spaning the region 1.1-3.8 m is presented. Use of a simple uniform disk brightness model facilitates comparison between epochs and with existing data and theoretical models. Strong size variations with wavelength were recorded for all stars, probing zones of H2O, CO, OH, and dust formation. Comparison with contemporaneous spectra extracted from our data show a strong anti-correlation between the observed angular diameter and flux. These variations consolidate the notion of a complex stellar atmosphere consisting of molecular shells with time-dependent densities and temperatures. Our findings are compared with existing data and pulsation models. The models were found to reproduce the functional form of the wavelength vs. angular diameter curve well, although some departures are noted in the 2.8-3.5 m range.
Subject headings:
instrumentation: interferometers – techniques: interferometric – stars: AGB and post-AGB – stars: individual: Mira stars: individual: W Hya stars: individual: R Leo1. Introduction
Due to their large diameters and high luminosities, Mira variables are a favourite target for
optical and near-infrared (NIR) interferometric observations, which have shown
dependencies of diameter on wavelength, pulsation phase and pulsation cycle (e.g., Haniff et al. 1995; van Belle et al. 1996; Perrin et al. 1999; Jacob et al. 2000; Young et al. 2000; Hofmann et al. 2002; Thompson et al. 2002; Ireland et al. 2004c; Woodruff et al. 2004;Woodruff et al. 2008).
This wealth of interferometric information has advanced the studies of molecular
and dust abundances in the atmosphere (e.g. Ireland et al. 2004a, b; Ireland & Scholz 2006),
the pulsation mode of these stars (e.g., Woodruff et al. 2004; Fedele et al. 2005),
and photospheric/circumstellar asymmetries (e.g. Ragland et al. 2006) as well as
the characteristics of the circumstellar environment (e.g. Danchi et al. 1994).
Miras are long period variables (LPVs) of roughly one solar mass which evolve along the Asymptotic Giant Branch (AGB) and are characterized by well-defined pulsation periods and large pulsation amplitudes (up to ). The extended atmospheres of these late-type giants show phase-dependent density and temperature stratifications which, together with complicated intensity profiles and the presence of molecular layers, leave no simple observable quantity to define the structure of the star’s envelope. The pulsations also help drive strong winds thus enriching the interstellar medium with molecules such as H2O, CO, TiO and SiO (Tsuji et al. 1997; Tej et al. 2003a; Ohnaka 2004). A better understanding of their atmospheric structures will thus further the understanding of these late stages of stellar evolution, and might help shed light on one of the most important sources for the chemical enrichment of the interstellar medium.
To fully characterize the structure of a Mira star’s atmosphere, one would need the complete intensity profile
at all wavelengths and all pulsation phases, recorded over a large number of pulsation cycles.
The last decade has shown a multitude of angular diameter measurements of Miras in various wavelengths,
with some instruments returning impressive resolution of the brightness profile (e.g. IOTA: Ragland et al. 2006, VLTI: Wittkowski et al. 2008, etc).
The difficulty lies in gathering multi-phase, multi-wavelength data on a single object.
Here, we present multi-epoch, spectro-interferometric observations of the nearby Mira stars Cet, R Leo and W Hya covering
the NIR spectrum from 1.1-3.8 m near-simultaneously, with one-dimensional spatial information out to the diffraction limit of the Keck I telescope.
With our data set we are able to sample phase-dependent molecular stratification and help probe the structure
of the stellar atmospheres.
2. Observations and Data Reduction
2.1. Aperture-masking Observations
Our sample of 3 Miras (W Hya is sometimes classified as a semi-regular pulsator with strong Mira characteristics) were chosen for their large angular diameters and NIR brightness (see Table 2.1). Observations were performed with the 10 m Keck I telescope using the Near Infrared Camera (NIRC). The telescope pupil was converted into a sparse interferometric array by placing an aperture mask in the beam in front of the infrared secondary mirror, allowing the recovery of the Fourier amplitudes and closure phases for baselines up to 10 m.
| Name | Period | Spectral | Distance |
|---|---|---|---|
| [days] | Type Range | [pc] | |
| W Hya | 385 | M7.5-9ep | |
| R Leo | 312 | M6-9.5e | |
| Cet | 332 | M5-9e |
| Grism | Keck/NIRC blocking | Grism wavelengths | effective wavelengths | spectral resolution |
|---|---|---|---|---|
| Filter Name | [m] | [m] | [m] | |
| GR 150 | JH | 0.82–2.08 | 1.0–1.6 | |
| GR 120 | HK | 1.05–2.58 | 1.4–2.5 | |
| GR 60 | KL | 1.98–4.75 | 2.1–4.5 |
| Object name | Date | JD | Grisms | Slit width | |
|---|---|---|---|---|---|
| 2450000 | [pixels] | ||||
| Cet | 1998Sep29 | 1056 | 0.71 | GR60,120,150 | 1.5, 1.5, 1.5 |
| 2002Jul23 | 2479 | 4.98 | GR60,120 | 1.5, 3.5 | |
| R Leo | 1999Feb04 | 1213 | 0.49 | GR120,150 | 3.5, 3.5 |
| 1999Apr25 | 1295 | 0.75 | GR60,120,150 | 4.5, 4.5, 4.5 | |
| W Hya | 1999Feb05 | 1213 | 0.58 | GR60,120,150 | 2.5, 3.5, 3.5 |
| 1999Apr25 | 1295 | 0.79 | GR60,120,150 | 4.5, 4.5, 4.5 | |
| 2000Jan25 | 1570 | 1.53 | GR60,120,150 | 1.5, 3.5, 4.5 |
Our experimental methods are derived from the highly successful aperture masking program at the Keck observatory which, in addition to studies of evolved pulsating stars and giants (Tuthill et al., 2000a; Monnier et al., 2004; Woodruff et al., 2008), has also delivered advances in stellar astrophysics ranging from young stellar objects (Danchi et al., 2001; Tuthill et al., 2002b) to dusty mass-loss shrouds in proto-planetary nebulae and massive stars (Monnier et al., 2000; Tuthill et al., 2002a, 2006). A full description of the experiment, including a discussion of the conceptual principles and signal-to-noise considerations underlying masking interferometry, is given in Tuthill et al. (2000b), while further discussion of systematics and seeing induced errors can be found in Monnier et al. (2004).
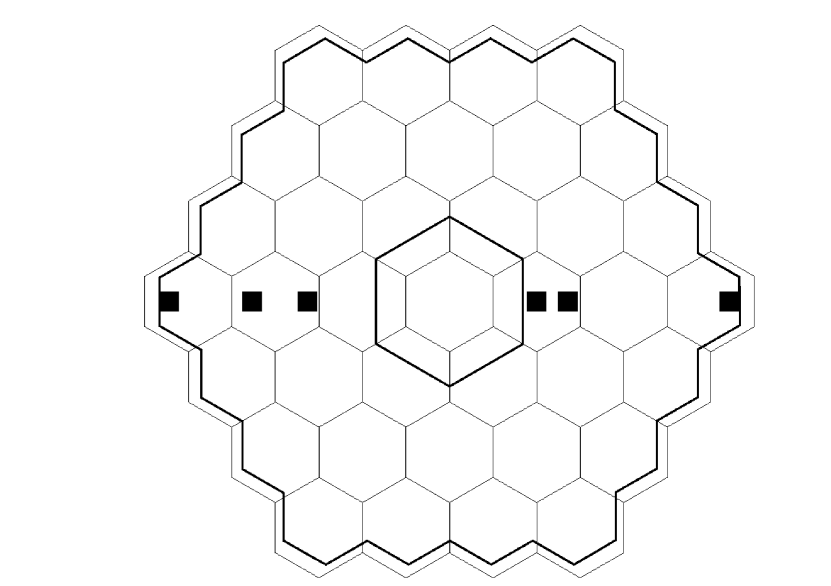
In a significant extension to the capabilities of our previous experimental setup, data presented here were obtained in a spectrally-dispersed manner delivering continuous wavelength coverage across the infrared J, H and K bands (from 1.0 m to 3.7 m). The use of a one-dimensional non-reduntant aperture mask, as depicted in Figure 1, in combination with a cross-dispersing grism element already installed in the NIRC camera (Matthews et al., 1996), resulted in spectral information being encoded in one dimension on the readout array, while spatial interference fringes were recorded in the other dimension. Note that with this setup, the full two-dimensional imaging data recovered in the previous experiment was sacrificed for one-dimensional brightness profiles across the waveband.
Figure 1 shows the aperture mask, which was designed to fit within the Keck’s segmented primary. The design is a trade-off between uniform Fourier coverage and avoiding features within the pupil, such as the central obstruction and the boundaries between mirror segments. Although the mask only passes a small amount of the light gathered by the 10 m primary mirror, and still more light is lost at the slit entrance, the LPV targets discussed in this paper are among the most luminous objects in the near-infrared sky and the low overall throughput did not adversely affect the signal-to-noise of the final data. On the contrary, we found that there was even sufficient flux recorded on the shoulders and in between the traditional near-infrared band windows, where atmospheric absorption is high, so that nearly continuous wavelength coverage could be obtained, with the exception of the strong telluric emission features, due to water, between 2.6 and 2.9 m.
The NIRC camera has three grisms intended to cover the J-H, H-K and K-L spectral regions (see Table 2). All three of these grisms were used and, as the reasonable degree of wavelength overlap between them provided a useful check on the reliability of the data. Also, four different slit widths (1.5, 2.5, 3.5, 4.5 pixels as projected on the detector) were used in order to strike a balance between spectral resolution and available flux. The grisms’ wavelength resolution are given in Table 2 and are to be multiplied with the slit width used in the observation (see Table 3) convolved with 1 pixel of the detector to obtain the “true” wavelength resolution of the instrument.
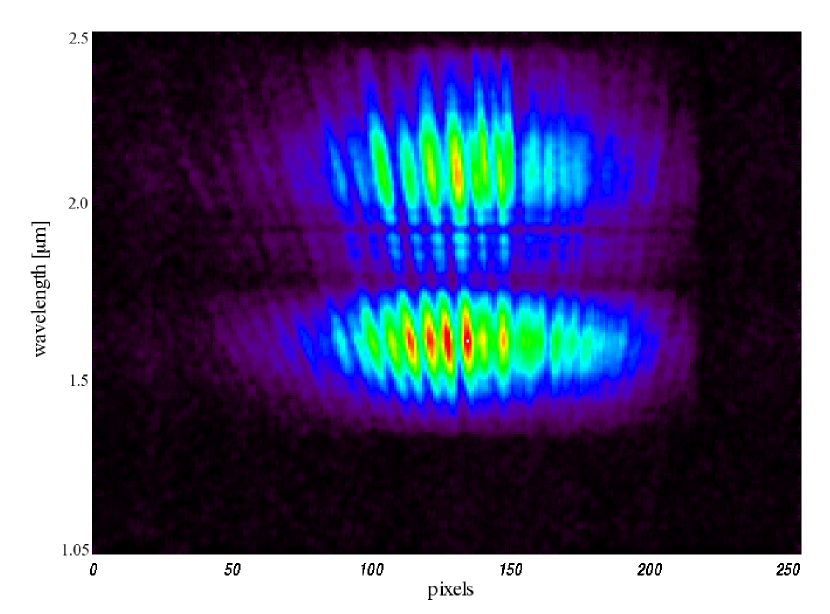
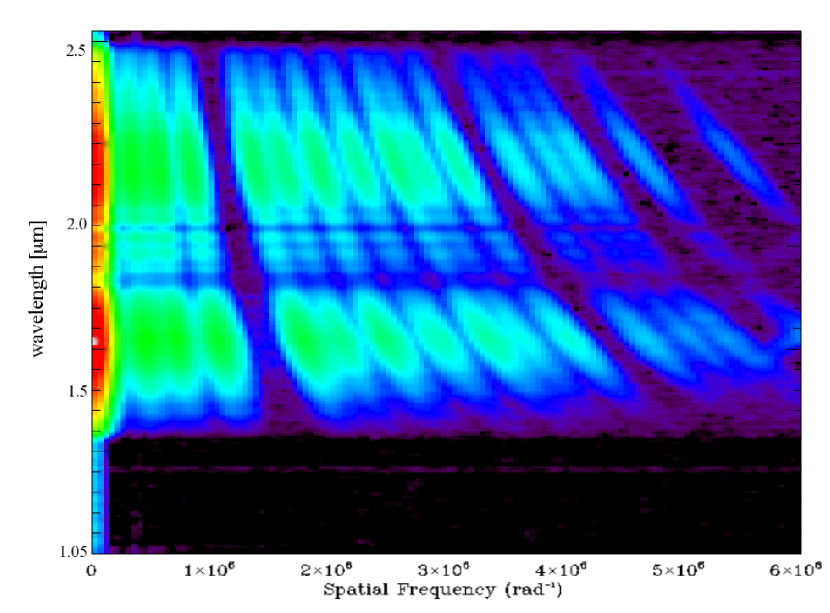
After passing the mask and being dispersed in the NIRC spectrographic mode, the beams were focused on the pixel array at a scale of 20.57 mas pixel-1. This is sufficient to Nyquist-sample data collected for m or longer wavelengths. An example of a typical short-exposure (=0.14 s) frame is shown in the left panel of Figure 2. Following the methods of Tuthill et al. (2000b), 100 of these frames could be collected with reasonable efficiency (duty cycle 20%) into a data cube for processing, to statistically calibrate the atmospherically degraded point-spread function.
The power spectrum accumulated over a cube of 100 frames is illustrated in the right panel of Figure 2. Power on fifteen baselines can be clearly seen as peaks appearing at discrete spatial frequencies that vary smoothly with wavelength. By recording the power on each baseline for a given wavelength bin, a one-dimensional visibility function could be recovered for that channel. When calibrated for the total flux level in each channel, these raw 1-dimenional data could be collated and fitted with any convenient model (e.g. a uniform disk; model fitting is discussed in Section 2.2), yielding a continuous sampling of the angular size of the target as a function of wavelength. Before such fitting could take place, calibration for the telescope-atmosphere transfer function was needed. For a number of instrumental reasons, this procedure turned out to be more complicated than in the past, as described below.
At wavelengths shorter than m, the longest baseline corresponds to spatial frequencies higher than the Nyquist sampling condition. This power is aliased back into the power spectrum at lower spatial frequencies. This effect can be observed in the power spectrum in Fig. 2 as an apparent reflection of the long-baseline power peaks when the wavelength is below m. Where this wrapped signal overlaps with power from shorter baselines, the data become confused and were discarded.
In common with established practice in interferometry, observations of PSF calibrator stars with smaller and well-characterized angular diameters were interleaved with those of the science target (see Table 2.1). However, for observations with the grism setup utilized here, an observational difficulty compromised this “standard” calibration process. Due to the experimental requirement for a stationary optical path between the mask and detector, the Keck image rotator was not used for any masking experiment. This precluded use of the normal telescope guiding system, and each series of 100 exposures (lasting of up to a couple of minutes) were taken with the telescope in a blind tracking mode. While small drifts in tracking had no impact on the original masking experiment (Tuthill et al., 2000b), this was not the case when the grism was employed because wander of the stellar image across the slit was found to result in significant modification to the optical transfer function. This motivated the construction of an alternate calibration strategy outlined in section 2.2.
The spectrally dispersed visibility data resolve only one spatial dimension at a single position angle for each target and hence permits fitting with circularly symmetric brighness profiles such as a simple uniform disk. The spectro-interferometric data were recorded at 6 different epochs spanning more than 4 years. Table 3 lists these observations.
2.2. Uniform Disk Diameters and Calibration
As discussed in Woodruff et al. (2008), the true stellar intensity profile is not a uniform disk (UD), but shows a complex center-to-limb variation that varies with wavelength, pulsation phase and cycle. Fitting the observed 1-d visibilities with a simple profile like a UD provides a useful estimate of the apparent change of size as a function of wavelength. Since we are only resolving low-resolution structure in the star’s intensity profile, it becomes difficult to differentiate between a UD, a fully-darkened disk, or a Gaussian. Any one of these simple models will show a similar relative change in diameter with wavelength, so we chose UD diameters to allow comparison of findings with existing literature and to avoid the difficulties encountered when fitting more sophisticated profiles (cf. Hofmann et al. 1998; Scholz 2003).
All spectrally-dispersed observations using the grism were accompanied on the same night with orthodox two-dimensional aperture masking observations in the NIRC narrowband filter set (with the exception of the band for W Hya in 1999 Apr 25). Since calibration of these observations was not impacted by the blind tracking errors, we could obtain good contemporaneous angular diameters of our targets at a range of discrete wavelengths across the grism passband. Assuming that the tracking-induced instabilities in the optical transfer function were a smoothly-varying function with wavelength, we could use our robust discrete UD angular diameters to pin the calibration at those wavelengths, and perform a smooth interpolation in between to cover all passbands used in the dispersed experiment. In the case of W Hya in 1999 Apr 25, we used 2-D making observations conducted at the same phase albeit one year earlier, on 1998 Apr 14 (cf. Woodruff et al. 2008), for one calibration of the GR60 grism.
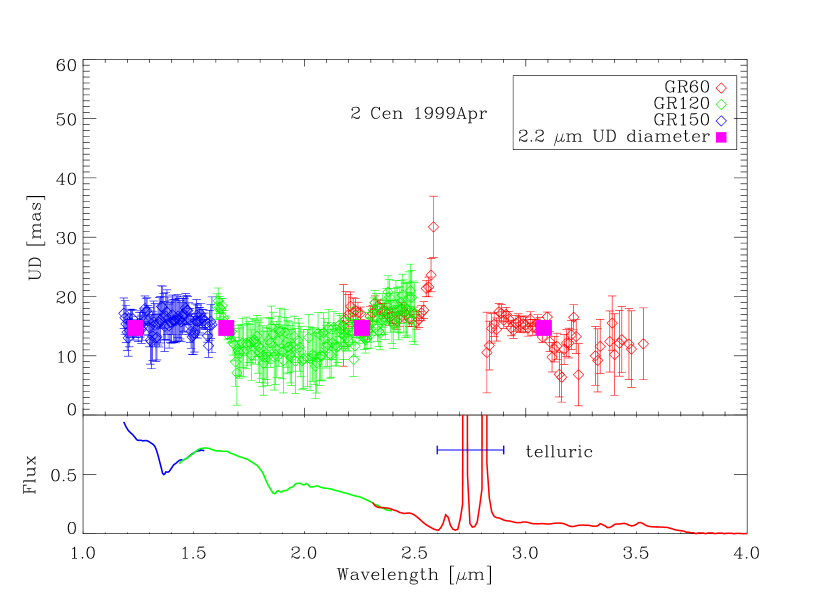
Observations of the PSF reference stars were then used as check stars to verify the utility of this calibration process. Although these check stars were typically smaller and fainter in the NIR than the targets, and therefore yield proportionately higher relative errors on the diameter measurement, the results of applying our calibration methodology to these objects confirmed that it was robust. PSF reference stars had typical spectral types from late K to early M, and (in comparison with Mira stars) these stars have compact atmospheres so that any diameter changes with wavelength are expected to be small. After applying our new calibration strategy to these check stars, the results verified these expectations and showed that the method produced a well-characterized constant diameter measurement over all three grism passbands. This is shown in Fig. 3 for the reference star 2 Cen, observed contemporaneously with W Hya in 1999 Apr 25.
2.3. Low resolution spectra
The observations of reference stars also allowed the spectral response of the optical system to be estimated. We extracted the total flux as a function of wavelength for both science objects and reference stars, making it possible to recover basic low resolution NIR spectra in the 1.0-4.0 m range (see Table 2) contemporaneously to our visibility measurements. Since the spectral calibration suffers from the same observational difficulty which compromised the calibration process of the visibilities outlined in Section 2, it was not possible to obtain calibrated absolute fluxes from our measurements.
3. Results
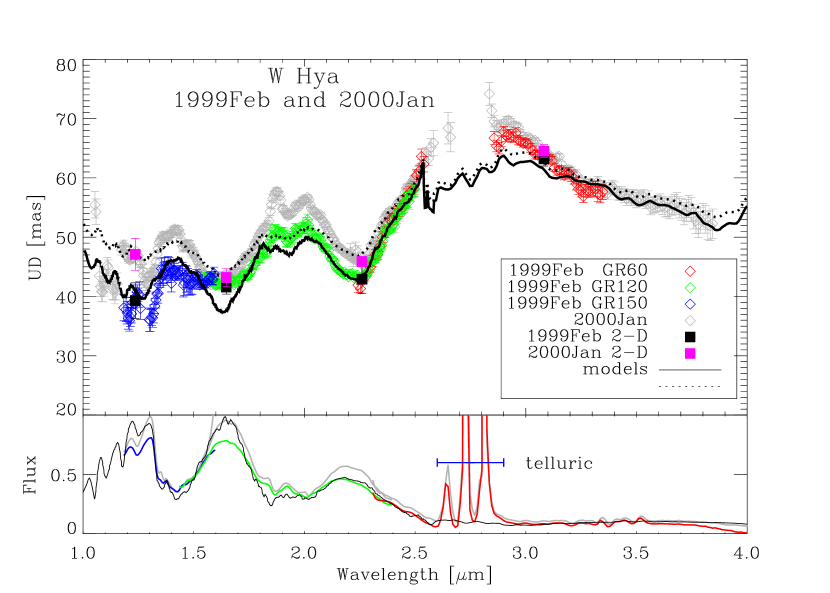
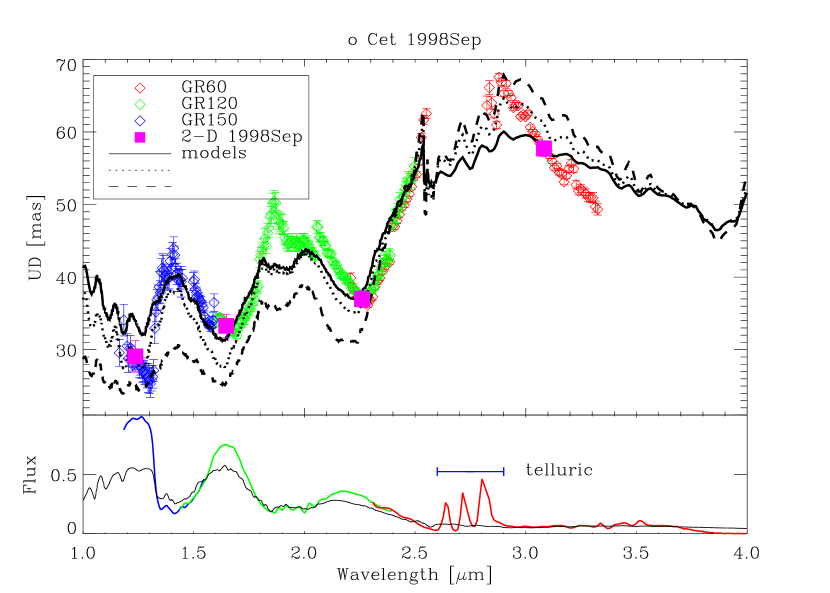
Figures 4 to 9 show the UD diameters of W Hya, R Leo and Cet as a function of wavelength (UD()), together with contemporaneous spectra. The gaps in the data correspond to regions of attenuated signal due to the telluric absorption bands, with the exception of the gaps at wavelengths greater than 3.5 m, which are caused by saturation of the detector due to high flux from the sky background. Also shown in the Figures are the best fitting UD() from dynamic model atmospheres with the respective model spectra which are described and compared with the data in Section 4.
The UDs show wavelength-dependent features that are consistent with expected opacity changes due to molecular abundances. Although some VO is responsible for UD() variations in the -band, the majority of the features are caused by the presence of H2O (plus contributions of CO and OH) in the stellar atmosphere (see, e.g., Tej et al. 2003b; Wittkowski et al. 2008). There is a very close anti-correlation between the spectral features and the apparent angular diameters at varying wavelengths. We find local minima in the UD diameters at 1.3–1.4, 1.6–1.7, and 2.2 m, corresponding to the regions of increased flux in the spectra. This anti-correlation can be explained by a molecular blanketing model, where opaque layers above the continuum-forming layers (the photosphere) lead to a perceived UD angular diameter increase at certain wavelengths. This wavelength-dependent absorption is also responsible for the diminished flux in the same bandpasses. The less contaminated bandpasses, which are closer to sampling the continuum-forming layers, exhibit smaller measured UD diameters and higher fluxes. These results can be readily compared with the findings for S Ori of Wittkowski et al. (2008), which show UD diameter minima in the same wavelength regions and present a very close match regarding the overall form of the UD() curve.
For the partially-resolved reference star 2 Cen we assumed a UD diameter of 14.7 mas (cf. Dumm & Schild 1998) at the same wavelengths used to pin the Mira grism data (cf. Figure 3). Note that some variation of size with wavelength is expected for this M4.5 III star. The corresponding spectrum is also fairly smooth, exhibiting only small H2O absorption features at 1.4 and 1.9 m.
Figures 4 and 7 also show significant cycle-to-cycle and phase effects, which tend to be more pronounced towards shorter wavelengths. This effect is predicted by the models, as discussed in the next Section.
4. Comparison with models
In this section the predictions of recent dynamic model atmospheres of M-type Miras are compared with the present observations. The distances to the model stars were chosen such that the UD()model overlaps our grism data in the wavelength region 2.2-2.5 m. These distances do not guarantee good fitting to model photometry since we only consider a comparison between the functional form of the model predictions as a function of wavelength and the observed data. A comparison between model photometric and angular diameter fit distances will be given in a future paper describing the models. The new models, spanning several pulsation periods, are based on a new code for treating pulsation and calculating atmospheric stratifications, as described below.
The code of Keller & Wood (2006) was used for constructing two series of self-excited pulsation models with parameters close to the well-studied prototypes Cet and R Leo: (i) o54 model series with period 330 days (non-pulsating “parent star” with mass 1.1 M, luminosity 5400 L, radius 216 R, effective temperature 3370 K, solar abundances with Z=0.02); (ii) r52 model series with period 307 days (1.1 M, 5200 L, 209 R, 3400 K, solar Z=0.02). The temperature structure of the atmospheric layers was calculated with an opacity-sampling technique accounting for major molecular species blanketing M-type atmospheres as well as for dust opacity (Ireland et al. 2008, henceforth called ISW08). The o54 series covers three time intervals, each containing 1.25 (interval hx, hereafter o54(hx)), 1.25 (jx) and 3.75 (fx) successive cycles in phase steps of about 0.1 times the pulsation period. For the r52 series, there are two time intervals with 2.25 (gx) and 2.5 (fx) successive cycles.
Instantaneous relaxation of hot matter behind shock fronts is assumed, and the approximation of local thermodynamical equilibrium was adopted except for scattering processes affecting continuous, TiO line and dust extinction (see ISW08 for details). All model atmospheres are cut off at 5 parent star radii, which is considered to be the transition zone to a wind-dominated circumstellar shell. Though W Hya has a longer period than these prototype model series, we would expect that scaling their atmospheric geometry structure to the larger size of a longer-period Mira provides a fair approximation for this star.
Inspection of the model series shows that, apart from the strong dependence of the shape of UD()model curves with optical phase, these curves also vary quite noticeably between cycles. Whilst an observed small set of isolated UD()obs values or an observed narrow wavelength interval of the UD()obs curve might readily be fitted by model predictions in different cycles, close agreement is much harder to achieve over a broad wavelength range, as we find with our NIR observations. This reflects the varying structure of upper atmospheric layers, depending on the shock front position in the present cycle as well as on the shock front history of preceding cycles, which results in varying strengths of different molecular absorption features. Systematic observations of monochromatic cycle-to-cycle size variations of Miras are not available, but the present observations of W Hya in 1999Feb (phase 0.58) and 2000Jan (phase 1.53) are almost one full cycle apart and clearly show noticeable differences of the UD()obs curve, which are significantly larger than the small 0.05 phase-difference effect expected from models (Fig. 4).
4.1. W Hya
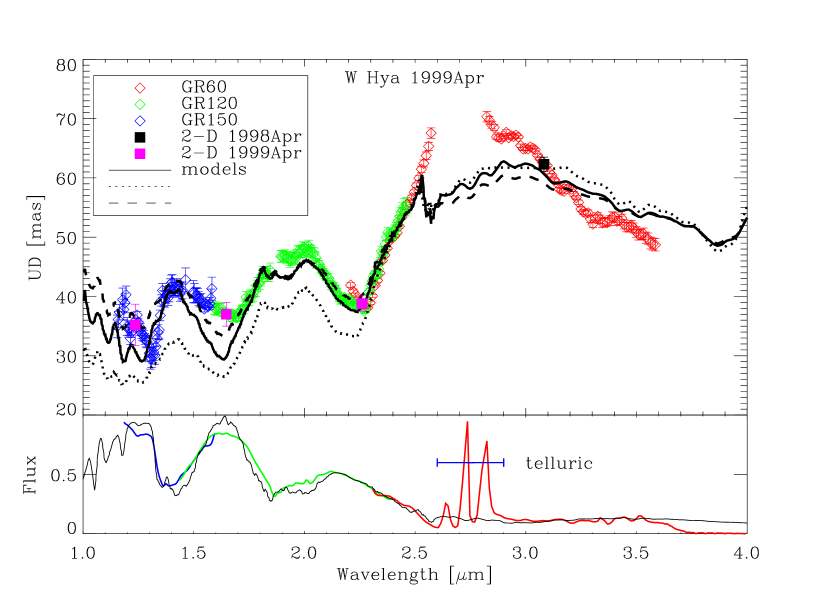
We compared the 3 phases of observation of W Hya with predictions of different cycles of both the o54 and r52 model series. Whilst no good agreement was found with available r52 cycles, there is reasonable agreement with one modelled phase sequence of the o54 series when the phase assignment of the model series is estimated to be slightly earlier, say of the order of 0.05 to 0.1 (which is well within the typical model vs. star phase uncertainty of at least 0.1). Even better agreement is achieved between our phase 0.58 observation and models with nearby phases 4.55 and 4.61 but, since subsequent model cycles are presently not available, the observed phases 0.79 and 1.53 cannot be compared to models in this case.
For good agreement with observed UD diameters, the model star had to be put at a “fit-distance” of about 78 pc, as compared to pc for the real star (Whitelock et al. 2008), where the difference reflects the fact that W Hya has a noticeably longer period (385 days) and hence is larger than the o54 model star (330 days, parent star radius 216 R).
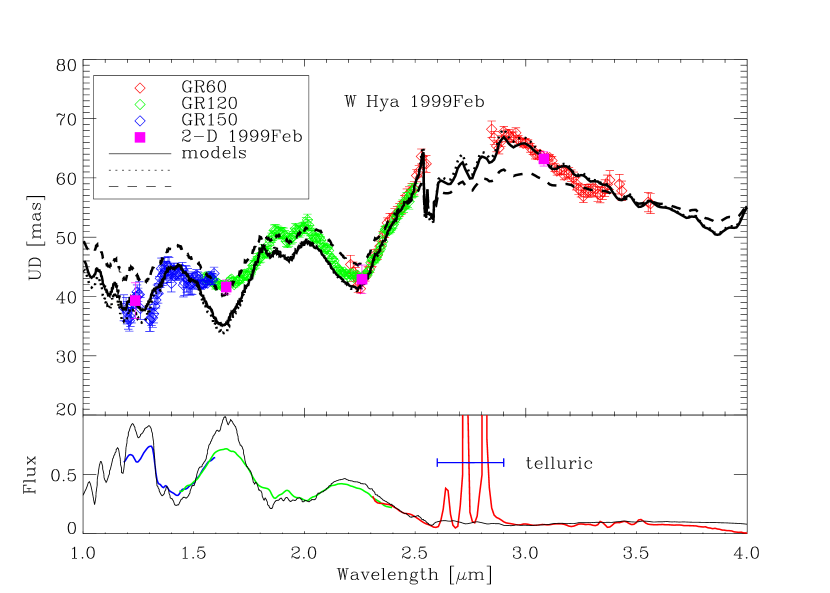
In Figure 4 we show the 1999Feb and 2000Jan ( and , respectively) observation together with UD() curves of o54(fx) models with phases 2.51 and 3.49 of successive cycles. Figure 5 shows the 1999Apr observation () together with the phase 2.70 model, as well as the phase 2.80 and 3.70 models for demonstrating significant phase and cycle-to-cycle effects. Figure 6 shows the 1999Feb observation of W Hya () with phase 4.55 and 4.61 models plus the phase 3.59 model of the preceding cycle which gives a less satisfactory overall fit. We note that the cycle containing phases 3.49 to 3.70 has generally smaller UD values than the other cycles used in Figs. 4 to 6, i.e. the model star appears smaller in this cycle and had to be scaled accordingly.
4.2. R Leo
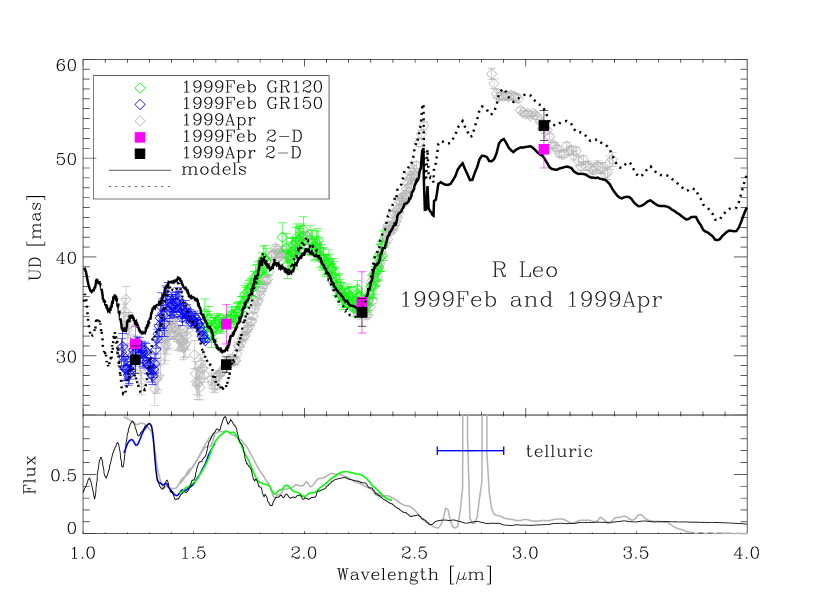
For the observations of R Leo at two phases, none of the four available cycles of the r52 model series (which was originally designed to describe R Leo) matches the observed UD() curve well, whereas two cycles of the o54 series with a slightly longer period give a fair fit. For good agreement with observations, the model star was set at a distance of pc, to be compared with parallaxes given by Gatewood (1992, pc) and van Leeuwen (2007, HIPPARCOS pc) and with a weighted-mean distance suggested by Whitelock et al. (2008, pc). Here, similar to the case of W Hya, we note that the observation is in the phase range of pronounced UD() phase dependence when the Mira light curve increases very steeply. Fig. 7 shows the observed UD() curves together with model curves. These give a fair fit within the bands, whereas the modeled UD diameters in the bandpass is about 15 percent larger than the observed value at phase 0.49.
4.3. Cet
For Cet, observations were made at two phases in two quite distinct cycles (1998Sep and 2002Jul) so that the phase-cycle-effects cannot be studied readily in this case. Two basic problems occur when we fitted available models to the observed UD() curves. (i) The model parent stars have to be placed at a distance of 80 pc (o54) or 70 pc (r52), both of which are marginally smaller than values given in the literature, e.g. 92 pc after Whitelock et al. (2008). (ii) The decrease of the UD diameter measured on 1998Sep at the long-wavelength side of the strong 3 m water band tends to be noticeably steeper than predicted by any models. Figure 8 shows the 1998Sep observation of Cet at together with same phase models of two successive cycles, showing cycle effects, and a model with 0.1 later phase, demonstrating the strong phase effects around . In Fig. 9 the () observation of Cet is shown with two model curves of the r52(fx) series.

5. Summary
We have measured the wavelength dependent diameters of three
Mira variables stars from 1.0-3.4 m and their respective spectra at up to 3 different epochs, the first study of this type in
the near-infrared. All observed stars show strong variations of their UD angular diameters as a function of wavelength,
often exhibiting a factor of 2 in UD diameter between 1.0 m and 3.0 m.
We find that the UD() relation shows variations with phase and the pulsation cycle,
revealing the complexity of cycle and phase-dependent opacity contributions from molecules, predominantly H2O and CO, in different layers.
We found that there is fair agreement between the measured UD() relationship and spectra, and those predicted by theoretical models designed to represent o Cet (see ISW08). When comparing the two stars whose parameters are thought to resemble the model input parameters the most, R Leo and Cet, with model predictions (Ireland et al. 2008), we find that the model UD diameters are slightly too small throughout the m region.
Our data also shows good agreement with results for the Mira star S Ori by Wittkowski et al. (2008), in that the minimum UD angular diameters are smallest at 1.3-1.4 and 1.6-1.7 m and increase by a factor of 1.4-1.5 around 2.0 m. For a full comparison with published interferometric UD angular diameters in continuum bandpasses, see Woodruff et al. (2008).
Further work with these data, including asymmetry studies, will be presented in subsequent publications.
References
- Danchi et al. (1994) Danchi, W. C., Bester, M., Degiacomi, C. G., Greenhill, L. J., & Townes, C. H. 1994, AJ, 107, 1469
- Danchi et al. (2001) Danchi, W. C., Tuthill, P. G., & Monnier, J. D. 2001, ApJ, 562, 440
- Dumm & Schild (1998) Dumm, T. & Schild, H. 1998, New Astronomy, 3, 137
- Dyck et al. (1998) Dyck, H. M., van Belle, G. T., & Thompson, R. R. 1998, AJ, 116, 981
- Fedele et al. (2005) Fedele, D., Wittkowski, M., Paresce, F., Scholz, M., Wood, P. R., & Ciroi, S. 2005, A&A, 431, 1019
- Gatewood (1992) Gatewood, G. 1992, PASP, 104, 23
- Haniff et al. (1995) Haniff, C. A., Scholz, M., & Tuthill, P. G. 1995, MNRAS, 276, 640
- Hofmann et al. (2002) Hofmann, K.-H., Beckmann, U., Blöcker, T., Coudé du Foresto, V., Lacasse, M., Mennesson, B., Millan-Gabet, R., Morel, S., Perrin, G., Pras, B., Ruilier, C., Schertl, D., Schöller, M., Scholz, M., Shenavrin, V., Traub, W., Weigelt, G., Wittkowski, M., & Yudin, B. 2002, New Astronomy, 7, 9
- Hofmann et al. (1998) Hofmann, K.-H., Scholz, M., & Wood, P. R. 1998, A&A, 339, 846
- Ireland & Scholz (2006) Ireland, M. J. & Scholz, M. 2006, MNRAS, 367, 1585
- Ireland et al. (2004a) Ireland, M. J., Scholz, M., Tuthill, P. G., & Wood, P. R. 2004a, MNRAS, 355, 444
- Ireland et al. (2004b) Ireland, M. J., Scholz, M., & Wood, P. R. 2004b, MNRAS, 352, 318
- Ireland et al. (2008) —. 2008, ArXiv e-prints
- Ireland et al. (2004c) Ireland, M. J., Tuthill, P. G., Bedding, T. R., Robertson, J. G., & Jacob, A. P. 2004c, MNRAS, 350, 365
- Jacob et al. (2000) Jacob, A. P., Bedding, T. R., Robertson, J. G., & Scholz, M. 2000, MNRAS, 312, 733
- Keller & Wood (2006) Keller, S. C. & Wood, P. R. 2006, ApJ, 642, 834
- Matthews et al. (1996) Matthews, K., Ghez, A. M., Weinberger, A. J., & Neugebauer, G. 1996, PASP, 108, 615
- Monnier et al. (2004) Monnier, J. D., Millan-Gabet, R., Tuthill, P. G., Traub, W. A., Carleton, N. P., Coudé du Foresto, V., Danchi, W. C., Lacasse, M. G., Morel, S., Perrin, G., Porro, I. L., Schloerb, F. P., & Townes, C. H. 2004, ApJ, 605, 436
- Monnier et al. (2000) Monnier, J. D., Tuthill, P. G., & Danchi, W. C. 2000, ApJ, 545, 957
- Mozurkewich et al. (2003) Mozurkewich, D., Armstrong, J. T., Hindsley, R. B., Quirrenbach, A., Hummel, C. A., Hutter, D. J., Johnston, K. J., Hajian, A. R., Elias, II, N. M., Buscher, D. F., & Simon, R. S. 2003, AJ, 126, 2502
- Ohnaka (2004) Ohnaka, K. 2004, A&A, 424, 1011
- Perrin et al. (1998) Perrin, G., Coudé du Foresto, V., Ridgway, S. T., Mariotti, J.-M., Traub, W. A., Carleton, N. P., & Lacasse, M. G. 1998, A&A, 331, 619
- Perrin et al. (1999) Perrin, G., Coudé du Foresto, V., Ridgway, S. T., Mennesson, B., Ruilier, C., Mariotti, J.-M., Traub, W. A., & Lacasse, M. G. 1999, A&A, 345, 221
- Ragland et al. (2006) Ragland, S., Traub, W. A., Berger, J.-P., Danchi, W. C., Monnier, J. D., Willson, L. A., Carleton, N. P., Lacasse, M. G., Millan-Gabet, R., Pedretti, E., Schloerb, F. P., Cotton, W. D., Townes, C. H., Brewer, M., Haguenauer, P., Kern, P., Labeye, P., Malbet, F., Malin, D., Pearlman, M., Perraut, K., Souccar, K., & Wallace, G. 2006, ApJ, 652, 650
- Scholz (2003) Scholz, M. 2003, in Interferometry for Optical Astronomy II, ed. Wesley A. Traub, SPIE Proc., 4838, 163
- Sloan & Price (1998) Sloan, G. C. & Price, S. D. 1998, ApJS, 119, 141
- Tej et al. (2003a) Tej, A., Lançon, A., & Scholz, M. 2003a, A&A, 401, 347
- Tej et al. (2003b) Tej, A., Lançon, A., Scholz, M., & Wood, P. R. 2003b, A&A, 412, 481
- Thompson et al. (2002) Thompson, R. R., Creech-Eakman, M. J., & van Belle, G. T. 2002, ApJ, 577, 447
- Tsuji et al. (1997) Tsuji, T., Ohnaka, K., Aoki, W., & Yamamura, I. 1997, A&A, 320, L1
- Tuthill et al. (2006) Tuthill, P., Monnier, J., Tanner, A., Figer, D., Ghez, A., & Danchi, W. 2006, Science, 313, 935
- Tuthill et al. (2000a) Tuthill, P. G., Danchi, W. C., Hale, D. S., Monnier, J. D., & Townes, C. H. 2000a, ApJ, 534, 907
- Tuthill et al. (2002a) Tuthill, P. G., Men’shchikov, A. B., Schertl, D., Monnier, J. D., Danchi, W. C., & Weigelt, G. 2002a, A&A, 389, 889
- Tuthill et al. (2002b) Tuthill, P. G., Monnier, J. D., Danchi, W. C., Hale, D. D. S., & Townes, C. H. 2002b, ApJ, 577, 826
- Tuthill et al. (2000b) Tuthill, P. G., Monnier, J. D., Danchi, W. C., Wishnow, E. H., & Haniff, C. A. 2000b, PASP, 112, 555
- van Belle et al. (1996) van Belle, G. T., Dyck, H. M., Benson, J. A., & Lacasse, M. G. 1996, AJ, 112, 2147
- van Leeuwen (2007) van Leeuwen, F. 2007, Hipparcos, the New Reduction of the Raw Data (Hipparcos, the New Reduction of the Raw Data. By Floor van Leeuwen, Institute of Astronomy, Cambridge University, Cambridge, UK Series: Astrophysics and Space Science Library, Vol. 350 20 Springer Dordrecht)
- Whitelock et al. (2008) Whitelock, P. A., Feast, M. W., & van Leeuwen, F. 2008, MNRAS, 386, 313
- Wittkowski et al. (2008) Wittkowski, M., Boboltz, D. A., Driebe, T., Le Bouquin, J.-B., Millour, F., Ohnaka, K., & Scholz, M. 2008, A&A, 479, L21
- Woodruff et al. (2004) Woodruff, H. C., Eberhardt, M., Driebe, T., Hofmann, K., Ohnaka, K., Richichi, A., Schertl, D., Schöller, M., Scholz, M., Weigelt, G., Wittkowski, M., & Wood, P. 2004, A&A, 421, 703
- Woodruff et al. (2008) Woodruff, H. C., Tuthill, P. G., Monnier, J. D., Ireland, M. J., Bedding, T. R., Lacour, S., Danchi, W. C., & Scholz, M. 2008, ApJ, 673, 418
- Young et al. (2000) Young, J. S., Baldwin, J. E., Boysen, R. C., Haniff, C. A., Pearson, D., Rogers, J., St-Jacques, D., Warner, P. J., & Wilson, D. M. A. 2000, MNRAS, 318, 381