A Catalog of 24 Sources Toward the Galactic Center
Abstract
We present a (2201195 pc) Multiband Imaging Photometer for Spitzer 24 image of the Galactic Center and an accompanying point source list. This image is the highest spatial resolution (6 pc) and sensitivity map ever taken across the GC at this wavelength, showing the emission by warm dust in unprecedented detail. Over 120,000 point sources are identified in this catalog with signal-to-noise ratios greater than five and flux densities from 0.6 mJy to 9 Jy.
Subject headings:
Galaxy: center - infrared: stars1. INTRODUCTION
The Galactic Center (GC) has long been a source of great interest at infrared (IR) wavelengths due to the complex, obscured nature of the region and its areas of energetic, massive star formation (Becklin & Neugebauer 1968; Rieke et al. 1978). Early experiments at far-IR wavelengths produced maps with resolution on the order of arcminutes, offering some of the first looks into the inner workings of the Galaxy (e.g., Odenwald & Fazio 1984; Campbell et al. 1985).
As IR technology improved dramatically, a new generation of images became available, and two large surveys were launched. The first was a map of the inner galaxy conducted with Infrared Space Observatory (ISO; Kessler et al. 1996) at 7 and 15 . These data had a resolution of 6 or better and were combined with DENIS data to quantify the spatial distributions of the stellar populations and their properties in the GC and to determine the interstellar extinction in that region. This ISOGAL project (Omont et al. 2003) had nearly complete point-source detection down to 10-20 mJy at 7 and 10 mJy at 15 , subject to issues of crowding and background levels in some areas. The observed regions (16 deg2) were distributed along the inner Galactic Disk, mostly within , . The second survey was that of the Galactic plane within (Price et al. 2001), carried out with the Midcourse Space Experiment (MSX; Mill et al. 1994) at a spatial resolution of pixel-1 and with bands sensitive from 6-25 .
Extending these works with the new capabilities of the Multiband Imaging Photometer for Spitzer (MIPS; Rieke et al. 2004), we present a (2201195 pc, assuming a distance of 8.5 kpc) scanmap of the GC at 24 and an associated point source catalog for and . The efficiency of the mapping and the high sensitivity of the instrument allow a quick and deep map of the GC to be produced that outperforms previous missions. For comparison, the MSX E passband at 21.34 , with an isophotal bandwidth of 6.24 , is similar to the MIPS 24 window. The MSX noise equivalent radiance in this wavelength range is approximately 40 MJy sr-1 for the inner galaxy and 65 MJy sr-1 for the outer galaxy, with a sensitivity of mJy. The MIPS sensitivity is 0.22 MJy sr-1, corresponding to a point source limit for low background of 212 Jy. With complex backgrounds, the order of magnitude smaller beam area with MIPS results in larger gains. However, due to its lower sensitivity, almost no sources along the galactic plane are saturated in the MSX data set, making it complementary to the new, deeper observations. For a comparison of the sensitivity and saturation levels of 2MASS, IRAC, MSX, and MIPS 24 , see Table 1 of Robitaille et al. (2007), and see their Figure 1 for spectral response curves of filters for those instruments.
Our data are also complementary to the Spitzer Legacy program MIPS Inner Galactic Plane Survey (MIPSGAL; P.I. S. Carey) which observed 220 deg2 of the inner Galactic plane, and for , at 24 and 70 with MIPS (Carey et al. 2005, 2006; Shenoy et al. 2007) but avoided the GC. There is some mild scanning overlap between our observations and those of MIPSGAL at the edges of each survey, but together they provide a large, comprehensive overview of this region.
A smaller survey of the GC has been conducted with the Spitzer’s Infrared Array Camera (IRAC; Fazio et al. 2004), covering the inner ( pc) and much of the Central Molecular Zone of the Galaxy with the four bandpasses at 3.6, 4.5, 5.8, and 8.0 (Program ID 3677, P.I. Stolovy; Stolovy et al. 2006; Ramirez et al. 2008; Arendt et al. 2008). Future work will combine their point source catalog with ours, and other more detailed results about the nature of the sources are presented elsewhere (Yusef-Zadeh et al. 2008; Yusef-Zadeh et al. 2008, in preparation). Table 1 summarizes the relevant parameters of the various GC region surveys.
2. OBSERVATIONS
The MIPS observations of the GC (Program ID 20414) were obtained in fast scan mode with scan legs and with full array () offsets. Eight astronomical observation requests (AORs), each containing twelve of these scan legs, were designed symmetrically about the GC and were obtained at an angle of from the plane for a field size of . The entire map, at a scale of , is shown in Figure 1. The fast scan observing mode was chosen due to the brightness of the GC itself, to avoid saturating completely over the plane, resulting in a total MIPS mapping time of 18 hours. Despite the short exposure, the inner 100 square arcminutes are saturated, as are many individual sources throughout the image, especially along the plane.
The operation of MIPS in scan-map mode allows for simultaneous mapping at all three wavelengths. However, the use of full array offsets means that the 70 data from the survey, with only half of the array working, are incomplete and, moreover, are laden with scan-related artifacts due to crossing the galactic plane multiple times, so the scan map has limited value, especially near the central region. The 160 map is completely saturated.
Starting with raw data from the Spitzer Science Center (SSC), data reduction was performed using version 3.02 of the MIPS Data Analysis Tool (DAT; Gordon et al. 2005). The DAT performs standard processing of infrared detector array data (e.g., dark subtraction, flat fielding) as well as steps specific to the MIPS arrays (droop correction). The data were then additionally processed with custom routines specifically written for scan map data sets with bright sources, such as the SAGE program to observe the Large Magellanic Cloud (LMC; Meixner et al. 2006) and the GTO program to observe M 31 (Gordon et al. 2006). In these routines, possible readout offset was corrected because one of the four MIPS readouts drifts slightly. The processing excludes images affected by saturating sources, e.g., persistence that appears in a frame after a source has saturated the detector, and corrects for artifacts associated with the direction of scan. The first four data collection events in each scan leg are excluded because of transients associated with the boost frame. Two of the eight scan legs (AORs 14657280 and 14657536) were observed six months apart from the others. The difference in the background level due to changes in the zodiacal light between the two sets of observations was subtracted within the custom programming. Due to the complicated nature of diffuse emission in the Galactic Center region, all other background subtraction was performed on individual sources locally as photometry was extracted (see section 3). The entire mosaic was calibrated using the most recent values available for 24 data (Engelbracht et al. 2007).
3. CREATION OF THE SOURCE CATALOG
To create a source catalog, we used the StarFinder program, an IDL code created for deep analysis of stellar fields (Diolaiti et al. 2000). The image mosaic was broken into approximately 50 tiles, most of which are pixels in size, to speed efficiency of the StarFinder software. StarFinder can be used such that it extracts the point spread function (PSF) directly from the images to take into account the actual structure of the instrumental response. However, in this case, the PSF is not taken from the image itself, but generated using the STinyTim (Krist 2002) model, as in the case of the SAGE project. The PSF of the MIPS instrument is very stable and using the STinyTim model allows us to avoid re-deriving a PSF for every new data set (see Gordon et al. 2007 for discussion of MIPS PSF comparisons). Objects were constrained to have a FWHM of , a signal-to-noise threshold of 5, and a minimum correlation of 0.9. The correlation parameter indicates an object’s match to the input PSF. Higher numbers indicate closer matches, with 1 being perfect. Photometry was performed by StarFinder, where a background box size of ten times the FWHM of the PSF is specified. Table 2 contains a truncated source list for the GC, including (1) 2MASS identification of the source, if any (see Section 4.1), (2) RA, (3) DEC, (4) calculated error in RA, (5) calculated error in DEC, (6) flux density at 24 , (7) error in the flux density, and (8) the correlation. These errors are the Starfinder nominal fitting errors only. More representative uncertainties are of order 7% for the flux densities and for the positions (see the discussion in Section 4.1). The entire source list can be accessed via the electronic edition of this article.
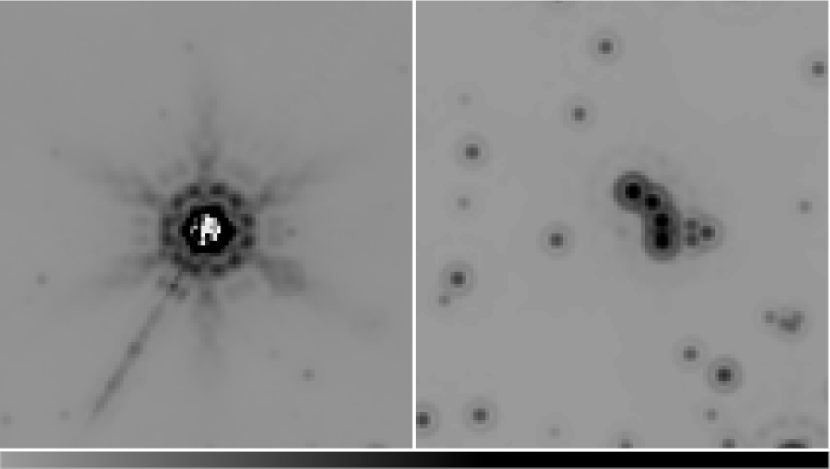
There are some obvious difficulties in producing a usable point source catalog for this data set. The first is that there are many saturated areas in the image. For instance, the inner , including the well known Arches and Quintuplet Cluster regions, are saturated, along with several regions of bright diffuse emission along the galactic plane. Point sources detected along the edges of these regions may be false or may have their flux densities influenced by areas of unusually bright emission in the diffuse background (background estimates generated by the SSC’s SPOT run from 100-300 MJy sr-1 in the GC region). Especially near the largest continuous saturated area in the center of the mosaic, all flux densities for point sources in the catalog within 2 of the saturated edge should be treated with caution. An example of this effect is shown in Figure 2, where a region of diffuse emission near the Galactic Center is shown. The MIPS image on the left shows real sources embedded in bright diffuse emission, while the sources identified by StarFinder on the right show false bright point sources, e.g., at the very center of the image and all along the bright edge of the diffuse emission.
Individual objects scattered about the mosaic that are saturated at 24 are not found by StarFinder and so are not included in Table 2. StarFinder occasionally locates points in the Airy pattern around very bright or saturated point sources and adds them to the catalog as if they were real, individual sources. Figure 3 shows a typical example of this phenomenon around a saturated source at 17h53m18.8s, -26d56m37.2s J2000. On the left is the reduced MIPS image, and on the right is an image created by StarFinder of all the objects it identifies in the field. The central, saturated object is not identified by StarFinder as a source, but the ring associated with the MIPS instrument pattern is incorrectly identified as several individual point sources. Due to the large area covered by the map, it is not feasible to remove by hand each of these false sources from the catalog (although many were removed in this manner for tiles along the plane). For this reason, all sources within a radius of 30 of objects with fluxes above Jy, just outside the Airy ring, are possibly false. Though some of the sources detected within this radius may be real, we caution that even real sources close to bright or saturated sources likely have unreliable flux densities affected by the bright neighbor.
4. DISCUSSION
4.1. Calibration and Positional Accuracy
Objects in the source list have an average flux density uncertainty given by StarFinder of 3%. In addition to this, photometric calibration uncertainties for MIPS 24 data are estimated to be 4% (Engelbracht et al. 2007), dominated by uncertainties in the absolute calibration. Figure 4 shows the flux density distribution of sources in the catalog.
The average positional uncertainty for objects cataloged by StarFinder is . This value represents only nominal fitting errors, and a more representative positional uncertainty for MIPS 24 data is (e.g., Meixner et al. 2006). Positions for sources were compared and cross-correlated with the Two Micron All Sky Survey (2MASS; Skrutskie et al. 2006) to test for possible distortion effects or other systematic problems. Over the entire field, we find an average systematic offset of +16 in right ascension and +05 in declination between the 2MASS and 24 sources. This offset in right ascension is larger than normally found between 24 and 2MASS data, though the reason is unclear. There is also some variation in the offset from tile to tile, particularly in right ascension. Figure 5 shows this variation across the field in uncorrected coordinates.
Given the variations, we therefore performed coordinate corrections for each of the 50 image tiles individually. Each object in the 24 catalog was matched with the closest neighbor in the 2MASS catalog within 0.0012 deg (). A coordinate shift between the 2MASS and 24 data was determined using a constant in right ascension and in declination for each of the 50 tiles. The 24 source coordinates were adjusted according to the individual calculated shifts; these adjusted coordinates appear in Table 2. The rms positional uncertainty after this adjustment is in RA and in DEC. Matching between the two catalogs was conducted again using a reduced radius of 0.0006 deg (; similar resolution to the 2MASS map). The nearest neighbor within the matching radius was identified as well as all neighbors within the matching radius. Less than 2% of the 24 sources have multiple 2MASS matches in this radius. The 2MASS matches are listed in Table 2.
4.2. Intruders and Chance Identifications
The main purpose in assembling the source catalog is to expedite Galactic studies. We define intruders as sources that are within the Solar System or outside the Milky Way. Two additional classes are spurious detections, for example due to cosmic ray hits on the detectors, and ghosts and other consequences of nearby strong sources or strongly emitting extended regions. The issue of spurious sources is largely managed by the high level of redundancy in the MIPS 24 data-taking. For this program, each source was observed ten times as it crossed the detector array on one scan map leg, and then ten more times as it crossed in the opposite direction on the next leg. Ghosts and similar issues have been discussed in Section 3.
One form of intruder is extragalactic sources. From, e.g., Papovich et al. (2004), the average counts for 24 sources brighter than 1 mJy is about 600 per square degree, for sources brighter than 5 mJy it is about 30 per square degree, while for sources brighter than 10 mJy it is about 25 per square degree. The total source count at 24 in the Galactic Center is about 10000 per square degree, most brighter than 5 mJy. Thus, the extragalactic contamination is likely to be at the 0.3% level. Although this low level sounds benign, programs isolating sources with extreme properties need to be pursued with caution to avoid extragalactic objects (most of the extragalactic sources will be below the 2MASS detection limits, for example).
The Galactic Center is at low ecliptic latitude (), so there will be a significant population of asteroids projected onto it. The 24 map was made in a single visit, and the time between scan legs was inadequate to identify asteroids by their motion. From typical asteroid counts as a function of ecliptic latitude (Hines et al. 2007; D. C. Hines, private communication, 2008), we expect up to 1000 per square degree brighter than 1 mJy and 20 per square degree brighter than 10 mJy. Again, compared with the total source counts, the implied level of contamination is 0.3%, but 24 -only detections should be viewed with caution until they have been confirmed through detection in some other way, e.g., by IRAC at 5.8 and 8 (Ramirez et al. 2008).
Another form of false result is association of a 24 source with a random object not physically associated. An example is our identification of sources in our catalog with those in 2MASS. For 2MASS, we take the positional errors to be (Cutri et al. 2003; Zacharias et al. 2003). The errors are therefore dominated by those at 24 , and we have allowed positional discrepancies up to . In two 40 40 arcmin reference fields, we found 60,000 2MASS sources and 4,000 24m ones. If the two source catalogs were uncorrelated, the probability of a randomly associated 2MASS object for any given 24 one would be 15%. However, the catalogs are strongly correlated and a better estimate of the number of false identifications is , based on the cases with two 2MASS sources within the matching radius. Our adopted tolerance is about 2.5 times the expected typical () 24 positional errors, so the number of false associations with 2MASS sources can be reduced significantly by requiring slightly more accurate positional agreement, at the cost of rejecting a modest number of correct associations.
The IRAC catalog of a region (Ramirez et al. 2008) is another logical set of sources for band merging, particularly at 5.8 and 8 where many of the 24 sources should be detected independently. At 8 , the scale is , and there are roughly 110,000 sources/square degree (Ramirez et al. 2008). The probability of a random association of an 8 source with one at 24 is then 25%. The other IRAC bands need to be used as part of band merging, since they both have more accurate positions and can provide spectral information to confirm the plausibility of any associations. These complications arise because the IRAC catalog is confusion limited. As a result, we have not attempted to cross identify with the IRAC sources. The optimum way to do so will depend on the specifics of a program and the resulting expectations for the mid-infrared spectral energy distributions of its target objects.
4.3. What is in the Catalog?
On the Vega system, 11.3 mJy at 24 corresponds to 7th magnitude. Detections in 2MASS and with IRAC are typically confusion limited at 12 - 13th magnitude. At the Galactic nucleus itself, where AV 30, these detection limits correspond to reddening corrected colors of KS - [24] 3. The extinction over the mapped region is highly variable; it is much greater than 30 magnitudes just to the SE of the nucleus because of the projection of the Galactic plane onto this region, and it is substantially less over much of our map out of the plane. Nonetheless, it is noteworthy that over significant regions, the 24 data are deep enough to identify sources with modest KS - [24] excesses. The distance modulus to the Galactic Center is m-M = 14.4. Therefore, m = 13 corresponds to M = -1.4 for no extinction and to M = -4.8 for A (assuming the extinction law of Rieke & Lebofsky 1985). Normal giant stars of type G8 and later have M -1.4, while giants of type M5 and later and supergiants of virtually all types have M -4.8 (Lang 1992; Tokunaga 1999). Therefore, the dominant objects in the catalog are red giants and supergiants with 24 excess emission. Extreme forms of mass losing late-type stars will also be well represented, e.g., OH/IR stars (with many examples in the Galactic Center region being at 1 Jy at 20 and with K - Q from 5 to 10, Blommaert et al. 1998).
There will be additional classes of source, many below the 2MASS detection limits. We can estimate roughly how many such objects to expect. Of the 60,000 objects brighter than 10 mJy roughly 25% or 15,000 do not have 2MASS identifications. Taking the false identification rate to be 2%, there are another 900 such sources for a total of 15,900. Approximately 540 of these sources are likely to be extragalactic or asteroids; the remaining must represent extreme mass losing and embedded post-main-sequence stars, ultra-compact H ii regions and other products of recent star formation, planetary nebulae, and supernova remnants. The latter two categories will be rare. Only a few hundred planetary nebulae are expected in this region (Jacoby & Van de Steene 2008). Supernova remnants are also relatively uncommon and may not always be strong infrared emitters (e.g., Reach et al. 2006). A large number of candidate young stellar objects have been identified and will be explored in a future paper (Yusef-Zadeh et al. 2008, in preparation).
4.4. Source Distribution and Extended Emission
The 24 sources are concentrated along the Galactic plane with a scale height similar to the distribution of molecular gas in the GC region (; Bally et al. 1988). There is an excess of sources at negative longitudes. This asymmetry could be explained by the high extinction experienced by mid-IR sources in the region where dense molecular clouds are highly concentrated. Alternatively, the distribution of compact dusty sources could be intrinsic due to an excess of young stellar objects or evolved asymptotic giant branch stars. These possibilities will be discussed in Yusef-Zadeh et al. (2008, in preparation).
The large scale view of the surveyed region at 24 shows that the central sources distributed between -1.8 and are the brightest. The mean brightness of this region is roughly 4 to 5 times higher than the region beyond the inner few degrees of the Galactic center. Several extended H ii regions detected at 24 are identified on the basis of radio continuum and submillimeter counterparts (Yusef-Zadeh et al. 2004; Pierce-Price et al. 2000). H ii complexes along the Galactic plane at 24 are associated with Sgr A – E and the radio arc. At positive longitudes, a string of infrared dark clouds (IRDCs) is concentrated between l and Sgr B2 near l=0.7. Submillimeter emission from these clouds is prominent (Lis & Carlstrom 1994; Pierce-Price et al. 2000). At negative latitudes, the distribution of dust emission at 24 shows that the IRDCs associated with the 20 and and 50 km s-1 molecular clouds M-0.13-0.08 and M-0.02-0.07, are detected, respectively (Herrnstein & Ho 2005; Armstrong & Barrett 1985). Both of these clouds are known to be located near the GC. At positive latitudes, two extended clouds known as the western and eastern GC lobes are shown prominently near l and , respectively. At negative latitudes, there are several counterparts to foreground H emission line nebulae which are prominent at 24 .
5. SUMMARY
A new MIPS mosaic of the GC at 24 reveals the warm dust emission in the area at unmatched sensitivity and spatial resolution. A point source catalog for objects in the inner has been produced, containing over 120,000 candidate sources between 0.6 mJy and 9 Jy. Of these sources, are likely to be intruder sources not associated with the GC, such as extragalactic objects or asteroids. These data are complementary to other surveys of this region and should fuel multi-wavelength comparisons and studies of the inner Galaxy.
References
- (1)
- (2) Arendt, R. G., et al. 2008, ArXiv e-prints, 804, arXiv:0804.4491
- (3) Armstrong, J. T., & Barrett, A. H. 1985, ApJS, 57, 535
- (4) Bally, J., Stark, A. A., Wilson, R. W., & Henkel, C. 1988, ApJ, 324, 223
- (5) Blommaert, J. A. D. L., van der Veen, W. E. C. J., van Langevelde, H. J., Habing, H. J., & Sjouwerman, L. O. 1998, A&A, 329, 991
- (6) Becklin, E. E., & Neugebauer, G. 1968, ApJ, 151, 145
- (7) Campbell, M. F., Niles, D. W., Kanskar, M., Hoffmann, W. F., & Thronson, H. A. 1985, Advances in Space Research, 5, 3
- (8) Carey, S. J., et al. 2005, Bulletin of the American Astronomical Society, 37, 1252
- (9) Carey, S. J., et al. 2006, Bulletin of the American Astronomical Society, 38, 1023
- (10) Cutri, R. M., et al. 2003, The IRSA 2MASS All-Sky Point Source Catalog, NASA/IPAC Infrared Science Archive. http://irsa.ipac.caltech.edu/applications/Gator/
- (11) Diolaiti, E., Bendinelli, O., Bonaccini, D., Close, L. M., Currie, D. G., & Parmeggiani, G. 2000, Proc. SPIE, 4007, 879
- (12) Engelbracht, C. W. et al. 2007, accepted to PASP
- (13) Fazio, G. G., et al. 2004, ApJS, 154, 10
- (14) Gordon, K. D., et al. 2005, PASP, 117, 503
- (15) Gordon, K. D., et al. 2006, ApJ, 638, L87
- (16) Herrnstein, R. M., & Ho, P. T. P. 2005, ApJ, 620, 287
- (17) Hines, D. C. 2007, Bulletin of the American Astronomical Society, 211, 1210
- (18) Jacoby, G. H., & Van de Steene, G. 2008, to be published in A&A
- (19) Kessler, M. F., et al. 1996, A&A, 315, L27
- (20) Lang, K. R. 1992, ”Astrophysical Data: Planets and Stars,” Springer: New York
- (21) Lis, D. C., & Carlstrom, J. E. 1994, ApJ, 424, 189
- (22) Meixner, M., et al. 2006, AJ, 132, 2268
- (23) Mill, J. D., et al. 1994, Journal of Spacecraft and Rockets, 31, 900
- (24) Odenwald, S. F., & Fazio, G. G. 1984, ApJ, 283, 601
- (25) Omont, A., et al. 2003, A&A, 403, 975
- (26) Papovich, C., et al. 2004, ApJS, 154, 70
- (27) Pierce-Price, D., et al. 2000, ApJ, 545, L121
- (28) Price, S. D., Egan, M. P., Carey, S. J., Mizuno, D. R., & Kuchar, T. A. 2001, AJ, 121, 2819
- (29) Ramirez, S. V., Arendt, R. G., Sellgren, K., Stolovy, S. R., Cotera, A., Smith, H. A., & Yusef-Zadeh, F. 2008, ApJS, 175, 147
- (30) Reach, W. T. et al., 2006, AJ, 131, 1479
- (31) Rieke, G. H., & Lebofsky, M. J. 1985, ApJ, 288, 618
- (32) Rieke, G. H., Telesco, C. M., & Harper, D. A. 1978, ApJ, 220, 556
- (33) Rieke, G. H., et al. 2004, ApJS, 154, 25
- (34) Robitaille, T. P., Cohen, M., Whitney, B. A., Meade, M., Babler, B., Indebetouw, R., & Churchwell, E. 2007, AJ, 134, 2099
- (35) Shenoy, S. S., et al. 2007, American Astronomical Society Meeting Abstracts, 210, #12.01
- (36) Skrutskie, M. F., et al. 2006, AJ, 131, 1163
- (37) Stolovy, S., et al. 2006, Journal of Physics Conference Series, 54, 176
- (38) Tokunaga, A. T. 1999, in ”Astrophysical Quantities,” 4th Ed., Ed: Arthur Cox, Springer: New York
- (39) Yusef-Zadeh, F., Hewitt, J. W., & Cotton, W. 2004, ApJS, 155, 421
- (40) Yusef-Zadeh, F., et al. 2008, American Astronomical Society Meeting Abstracts, 212, #18.07
- (41) Zacharias, N., McCallon, H. L., Kopan, E., & Cutri, R. M. 2003, 25th Meeting of the IAU, 16, 43
- (42)
| Survey | Coverage | Wavelength | Resolution |
|---|---|---|---|
| (deg2) | () | (arcsec) | |
| 2MASS | All Sky | 1.25 | 2 |
| 2MASS | All Sky | 1.65 | 2 |
| 2MASS | All Sky | 2.15 | 2 |
| IRAC1 | 3 | 3.6 | 2 |
| IRAC2 | 3 | 4.5 | 2 |
| IRAC3 | 3 | 5.8 | 2 |
| IRAC4 | 3 | 8.0 | 2 |
| ISO1 | 16 | 7 | 6 |
| ISO2 | 16 | 15 | 6 |
| MSXA | 3600 | 8.28 | 18 |
| MSXC | 3600 | 12.13 | 18 |
| MSXD | 3600 | 14.65 | 18 |
| MSXE | 3600 | 21.3 | 18 |
| MIPS | 12 | 23.8 | 6 |
| 2MASS ID | RA | DEC | Corr. | ||||
|---|---|---|---|---|---|---|---|
| (deg) | (deg) | (arcsec) | (arcsec) | (Jy) | (Jy) | ||
| (1) | (2) | (3) | (4) | (5) | (6) | (7) | (8) |
| 266.287841 | -30.977419 | 0.02927 | 0.0291 | 3.551 | 0.02323 | 0.9679 | |
| 17434488-3044340 | 265.937084 | -30.742722 | 0.02918 | 0.02632 | 3.532 | 0.02271 | 0.9486 |
| 17435853-3049345 | 265.993959 | -30.826151 | 0.02939 | 0.02374 | 3.187 | 0.02148 | 0.9867 |
| 266.14624 | -30.438144 | 0.02468 | 0.01924 | 3.169 | 0.02009 | 0.9799 | |
| 17434410-3056446 | 265.933789 | -30.945665 | 0.01518 | 0.02561 | 2.312 | 0.01703 | 0.9852 |
| 266.255206 | -31.209862 | 0.02478 | 0.02745 | 1.998 | 0.01255 | 0.9523 | |
| 265.761335 | -30.949127 | 0.02335 | 0.02361 | 1.973 | 0.009045 | 0.9953 | |
| 17443502-3034437 | 266.14593 | -30.578774 | 0.0172 | 0.01993 | 1.953 | 0.01406 | 0.9759 |
| 17441335-3056200 | 266.056184 | -30.939233 | 0.01247 | 0.006901 | 1.776 | 0.008141 | 0.9562 |
| 17451342-3038180 | 266.305943 | -30.638432 | 0.02665 | 0.02199 | 1.309 | 0.009429 | 0.9831 |
| 17441640-3039103 | 266.068336 | -30.65275 | 0.0258 | 0.02424 | 1.256 | 0.007597 | 0.9847 |
| 17434905-3041136 | 265.954328 | -30.687175 | 0.02936 | 0.02643 | 1.139 | 0.006561 | 0.99 |
| 17435511-3045401 | 265.979572 | -30.760982 | 0.02681 | 0.02864 | 1.1 | 0.007661 | 0.9764 |
| 17432702-3051042 | 265.862481 | -30.851173 | 0.0305 | 0.02928 | 1.098 | 0.007793 | 0.9778 |
| 17452158-3052455 | 266.340014 | -30.879241 | 0.02936 | 0.02879 | 1.078 | 0.007192 | 0.9874 |
| 17443132-3048224 | 266.130579 | -30.806163 | 0.01412 | 0.02999 | 1.039 | 0.007664 | 0.9821 |
| 17450523-3054496 | 266.27189 | -30.913826 | 0.02931 | 0.02925 | 0.9833 | 0.006514 | 0.9806 |
| 17450768-3035121 | 266.281693 | -30.587087 | 0.02922 | 0.03381 | 0.8739 | 0.0068 | 0.9738 |
| 17441761-3056218 | 266.073363 | -30.939407 | 0.02717 | 0.02896 | 0.8129 | 0.005895 | 0.9722 |
| 17434355-3050521 | 265.931548 | -30.847771 | 0.02747 | 0.03038 | 0.7588 | 0.005271 | 0.9776 |
Note. — For the full list of over 120,000 sources, see the online version of this paper.