Renewed activity from the X-ray transient SAXJ 1810.8-2609 with INTEGRAL 11affiliation: INTEGRAL is an ESA project with instruments and science data center funded by ESA member states (especially the PI countries: Denmark, France, Germany, Italy, Switzerland, Spain), Czech Republic and Poland, and with the participation of Russia and the USA.
Abstract
We report on the results of
INTEGRAL observations
of the neutron star
low mass X-ray binary SAX J1810.8-2609 during its latest active phase
in August 2007.
The current outburst is the first one since 1998 and the derived luminosity
is
in the 20–100 keV energy range.
This low outburst luminosity and the long-term time-average
accretion rate of yr-1
suggest that SAX J1810.8–2609 is a faint soft X-ray transient.
During the flux increase, spectra are consistent with a thermal
Comptonization model with a temperature plasma of
23-30 keV
and an optical depth of
1.2-1.5, independent from luminosity of the system.
This is a typical low hard spectral state for which the X-ray emission is attributed to
the upscattering of soft seed photons by a hot, optically thin electron plasma.
During the decay, spectra have a different shape, the high energy tail being
compatible with a single power law.
This confirm similar behavior observed by BeppoSAX during the previous outburst,
with absence of visible cutoff in the hard X-ray spectrum.
INTEGRAL/JEM-X instrument observed four X-ray bursts
in Fall 2007.
The first one has the highest peak flux (
in 3–25 keV)
giving an upper limit to
the distance of the source of about 5.7 kpc, for a
erg s-1.
The observed recurrence time of 1.2 days and
the ratio of the total energy emitted in the persistent flux to that
emitted in the bursts (73) allow us to conclude that the burst fuel
was composed by mixed hydrogen and helium with X0.4.
1 Introduction
The transient X-ray source SAX J1810.8-2609 was discovered on 1998 March 10 (Ubertini et al. 1998) with the Wide Field Cameras (2-28 keV) on-board the BeppoSAX satellite. During the performed Galactic Bulge monitoring, a strong type I X-ray burst was detected identifying this compact object as a neutron star in a low-mass X-ray binary system. Assuming standard burst parameters and attributing the photospheric radius expansion to near-Eddington luminosity, the distance was estimated be kpc (Natalucci et al. 2000). The wide-band spectral data (0.1–200 keV) obtained later with the NFI/BeppoSAX showed a hard X-ray spectrum described by a power law with photon spectral index and a soft component which was compatible with blackbody radiation of temperature kT0.5 keV (Natalucci et al. 2000).
During a ROSAT follow-up observation on 1998 March 24 an X-ray source (named RX J1810.7–2609) was detected at a position consistent with the WFC error box (Greiner et al. 1998). Optical-to-infrared follow-up observations of the 10′′ radius ROSAT HRI X-ray error box revealed one variable object (R= on March 13, R on 1998 August 27) which was proposed as the optical/IR counterpart of RX J1810.7–2609 and SAX J1810.8–2609 (Greiner et al. 1998).
Using Chandra instruments, Jonker et al. (2004) detected the neutron star system in quiescence at an unabsorbed luminosity of (assuming a distance of 4.9 kpc). The quiescent spectrum is well-fitted with an absorbed power law with a photon index and the Galactic absorption value () consistent with the value derived in outburst.
Since 1998 this burster remained in a quiescent state. Only in August 2007 Swift observed a new phase of activity (Parson et al. 2007). The Swift/UVOT instrument detected a weak source in the white-band filter at the position of SAX J1810.8–2609 and did not detect it in any other single filter (Scady et al. 2007). The source was observed on a daily basis with Swift using exposure, starting August 6, 2007. In all observations the Swift/XRT spectrum was well fitted using an absorbed power law model with a hydrogen column density of and a spectral index of (Degenaar et al. 2007). After few months, the source went back to quiescent state, indeed on November 3rd and 5th, Swift/XRT did not detect it during two individual and observations.
The X-ray spectra of LMXBs are usually fit with a complex model: at low energies a blackbody component that approximates the spectrum of an optically thick, geometrically thin accretion disk and/or the neutron star surface, and at higher energies a Comptonization component due to repeated inverse Compton scattering of the soft seed photons by hot electrons plasma with a thermal distribution of velocities. BeppoSAX and INTEGRAL results showed that the hard component can extend up to 200 keV without any appreciable break (Di Salvo et al. 2000, 2001, Fiocchi et al. 2006, Piraino et al 1999, Iaria et al. 2001, Tarana et al. 2006). In this paper, we study the spectral behavior of the X-ray transient burster SAX J1810.8–2609, showing this behavior during the decay of the outburst. Finally, we report on four X-ray bursts observed by INTEGRAL/JEM-X instrument in Fall 2007.
2 OBSERVATIONS AND DATA ANALYSIS
The INTEGRAL (Winkler et al. 2003) observations
are divided into uninterrupted 2000 s intervals, the so-called science windows (SCWs).
Spectra and light curves of the source are obtained using data from the
two high-energy instruments
JEM-X1 (Lund et al., 2003) in the band and from IBIS/ISGRI
(Ubertini et al., 2003) in the range .
The instrument data are extracted for each individual SCW and
processed using the Off-line Scientific Analysis
(OSA v7.0) software released by the
INTEGRAL Scientific Data Centre (Courvoisier et al. 2003).
Following the standard analysis, we use the latest response matrix with 64 channels.
Then, data above 90 keV are rebinned to improve the signal to noise ratio.
The RXTE/ASM (Levine et al. 1996)
daily averaged light curve, provided by the ASM/RXTE teams at
MIT and at the RXTE SOF and GOF at NASA’s GSFC,
(Fig. 1, panel a, from
http://xte.mit.edu/ASM_lc.html)
shows that SAX J1810.8–2609 has been continuously active since beginning
of August for two months with multiple peaks.
The outburst of this transient source was frequently observed by
INTEGRAL (Haymoz et al. 2007, Galis et al. 2007)
during the Key Programme on the Galactic Centre and private Target of Opportunity observations.
The IBIS/ISGRI light curve (Fig. 1, panel b and c) shows a gradual brightening in two energy band, 22-45 keV and 45-68 keV, while the ASM peak intensity was not monitored with INTEGRAL .
We report here on the outburst emission measured by the IBIS/ISGRI instrument
by dividing it in four separate epochs (see Table 1). These correspond to time periods
during which the source spectra appear quite stable, with very small or absent spectral
variability as monitored on the time scale of a few SCWs.
We searched simultaneous IBIS and PCA (Glasser et al. 1994) data in the XTE public archive
222
http://heasarc.gsfc.nasa.gov/docs/xte/xhp_archive.html
,
but unfortunately
only for epoch 1 PCA standard products are available.
No public PCA data are available for the epoch 2, 3 and 4 .
For our analysis we use the PCA standard products OBSID 93414-01-04-01.
Data are collected in standard2 modes with a time resolution of 16s and 129 energy channels
and from PCU 2 and PCU 4.
Source and background spectra are generated with SAEXTRCT version 4.2d
and response files with the tool PCARMF v10.1.
Background rates were estimated using the epoch-5 models, as provided by the PCA calibration team.
| Instrument | Tstart | Tstop | Exposure | counts/sa | |
|---|---|---|---|---|---|
| MJD | MJD | ksec | |||
| 1 | IBIS | 54337 | 54357 | 572 | 5.800.07 |
| 2 | IBIS | 54358 | 54362 | 107 | 11.60.2 |
| 3 | IBIS | 54367 | 54370 | 121 | 10.90.2 |
| 4 | IBIS | 54373 | 54376 | 128 | 10.20.1 |
| 5 | PCA | 54345.49 | 54345.51 | 2 | 75.00.3 |
a Rates are in the 22-200 kev energy range for IBIS and in 3-30 keV for PCA spectra. Source counts are background subtracted.
3 SPECTRAL ANALYSIS
3.1 The wide band outburst emission
The IBIS spectra extracted for the four epochs listed in Table 1 have been fitted with both a simple power law and a COMPTT model (Titarchuk 1994), assuming a spherical geometry for the Comptonizing region. Results are reported in Table 2. The temperature of the Comptonizing electrons kTe and the plasma optical depth were free parameters in the fit, while the temperature of the soft photon Wien distribution kT0 was fixed at 0.6 keV. This is the value observed by BeppoSAX in 1998 and previously reported by Natalucci et al. (2000). Spectra are well described by a simple power law after the outburst peak, while a COMPTT model is required before the outburst peak. Using a thermal Comptonization model COMPTT instead of simple power law did not give significantly better fits for epoch 3 and 4, with the corresponding F-test chance probabilities being and , respectively. Instead this model is statistically highly significant for the epoch 1 and 2, with the corresponding F-test chance probabilities of and , respectively.
For the first period we build a spectrum in a broad energy band (3-200 keV),
using simultaneous IBIS and PCA data.
The most simple model which provides a good fit to this spectrum
is made up of a thermal comptonized component COMPTT in XSPEC
(Titarchuk 1994) with
a spherical geometry plus
a soft component consisting of a single temperature blackbody and an Gaussian component for iron line.
In the fitting procedure, a multiplicative constant has been introduced to take into account
possible cross calibration mismatches between the soft X-ray and the INTEGRAL data;
this constant has been found to be 1.050.05.
Results are reported in Table 2.
The iron line centroid is keV, and equivalent width .
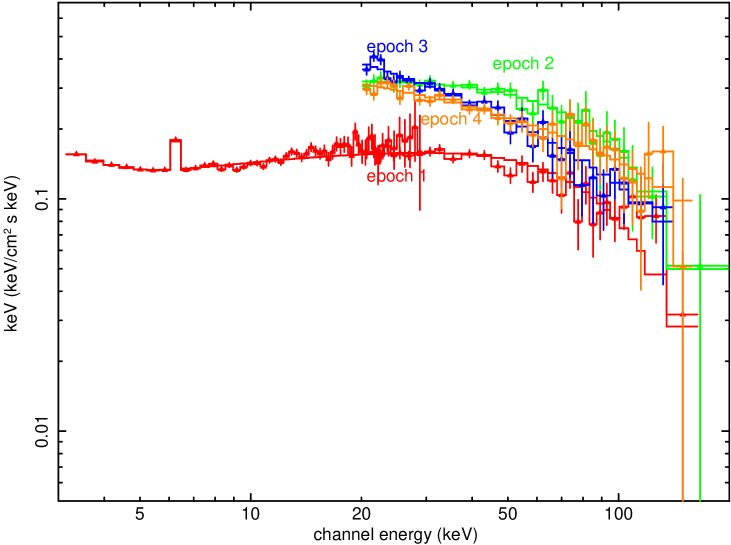
Figure 2 shows four spectra and the
residuals with respect to the corresponding best fits.
Data and models are shown in Figure 3, for four epochs.
| IBIS spectra | |||||
| Epochs 1, 2, 3, 4 | |||||
| , | |||||
| keV | (d.o.f.) | ||||
| Power Law | |||||
| 1 | … | … | 3.6 | 1.43[30] | |
| 2 | … | … | 7.5 | 1.49[29] | |
| 3 | … | … | 6.3 | 1.13[27] | |
| 4 | … | … | 6.0 | 0.92[32] | |
| comptt | |||||
| 1 | … | 3.6 | 0.70[29] | ||
| 2 | … | 7.5 | 0.40[28] | ||
| 3 | … | 6.3 | 1.02[26] | ||
| 4 | … | 6.0 | 0.81[31] | ||
| IBIS and PCA spectra | |||||
| Epoch 1 | |||||
| keV | keV | (d.o.f.) | |||
| 1 | 8.1 | 1.05[78] | |||

3.2 The bursts emission
The start time for each burst was determined when the intensity rose to 10 % above the persistent intensity level. The rise time is defined as the time between the start of the burst and the time at which the intensity reached 90 % of the peak burst intensity, as measured from the 2 s bin light curve in the full 3–25 keV band. The burst duration is the approximate time it takes to the 3–25 keV intensity (averaged over 3 consecutive bins) to decrease back to the average persistent level previous to the burst start.
The spectral analysis of the bursts is based on JEM-X data in the 3–25 keV band. Unfortunately, time resolved spectral analysis of such short bursts, requiring relatively high time resolution, leads to statistically poor results due to the little aperture of the JEM-X instrument. Therefore, a time-averaged spectral analysis over the first 18 s including the peak has been performed for each burst and every burst spectrum is well fit by a simple blackbody model.
| Dataset | Burst 1 | Burst 2 | Burst 3 | Burst 4 |
|---|---|---|---|---|
| Date (YYYYMMDD) | 20070915 | 20070924 | 20070930 | 20071001 |
| Start time (UTC) | 23:20:18 | 19:52:50 | 17:10:03 | 21:42:10 |
| (keV) | 1.4 | 2.1 | 2.6 | 2.5 |
| (km) | 18 | 6.1 | 4.1 | 4.5 |
| 17/27 | 40/43 | 30/24 | 31/57 | |
| a | ||||
| Burst parameters | ||||
| a | ||||
| b | ||||
| Rise time ( s) | 5 | 3 | 4 | 7 |
| Duration ( s) | 30 | 30 | 30 | 25 |
| c | ||||
| d | ||||
a Unabsorbed flux (0.1–100 keV) in units of erg cm-2 s-1. b Fluence (erg cm-2). c . d ; is the persistent flux in 0.1–100 keV energy range previous to the time of each burst, is the highest burst peak flux, here of Burst 1.
The inferred blackbody temperature, , and apparent blackbody radius at 5.5 kpc, , for every burst are reported in Table 3. Burst fluences are obtained from the bolometric fluxes, , extrapolated in the 0.1–100 keV energy range and integrated over the respective burst durations. The peak fluxes, , are obtained by comparing the peak count rate of the 2 s bin light curves with the time-averaged count rate of the spectra medeled with a blackbody (see Table 3). Bolometric fluxes are extrapolated between 0.1 and 100 keV using XSPEC software. All uncertainties in the spectral parameters are given at a 90 % confidence level.
The first burst has the highest peak flux reaching a value of corresponding to ( between 3–25 keV). From the light curve, it even seems to be preceded by a precursor 24 s in advance. However, since this burst was observed close to the limit of the JEM-X field of view, the significance of the precursor is quite low and therefore its reality may be doubtful. Assuming that the main peak flux corresponds to the Eddington limit for a helium burst, erg s-1, as empirically derived by Kuulkers et al. (2003), we can calculate an upper limit to the distance of the source of about 5.7 kpc. For comparison, the theoretical value of erg s-1, assuming a helium atmosphere, a canonical mass of and 10 km radius for the neutron star photosphere (e.g. Lewin et al. 1993), leads to a distance of 5.0 kpc, consistent with the distance previously derived by Natalucci et al. (2000). The three remaining bursts are all weaker, reach approximately the same peak flux, and have similar decay times. From the detection of four bursts during the total observation time of about 928 ks elapsed on the source by INTEGRAL, due to the non continuous coverage of the outburst, we can estimate an approximate recurrence time of 2.7 days in average. Nevertheless, as the fourth burst occurred the day after the third burst, namely = 1.2 days later, this interval represents a more stringent constrain on the bursting rate (see below).
The average persistent unabsorbed flux between 0.1–100 keV, erg cm-2 s-1, translates to a bolometric luminosity erg s-1, assuming an approximate distance of 5.5 kpc. This corresponds to a mass accretion rate per unit area equal to c g cm-2 s-1 (where and c is the accretion efficiency for a canonical neutron star).


The total energy released by the first burst was erg which, assuming complete and isotropic burning, corresponds to an ignition column ranging between g cm-2 for burning hydrogen with abundance X=0.7, and g cm-2 for X=0 (pure helium); here MeV/nucleon is the nuclear energy release for a given average hydrogen fraction at ignition X, and z=0.31 is the appropriate gravitational redshift at the surface of a 1.4 M⊙ neutron star (Cumming, 2003). From the relation a burst recurrence time of days is expected for X=0.7, and days for pure helium burning. The same calculations for the fourth burst with an energy release of erg lead to days for X=0.7, and days for X=0. The observed recurrence time seems thus most consistent with mixed H/He burning.


Moreover, it is also possible to calculate the burst energetics by the ratio of the total energy emitted in the persistent flux to that emitted in the bursts (e.g. Galloway et al., 2004): , for , F erg cm-2 s-1, and erg cm-2 is the fluence of the fourth burst. Assuming that all the accreted fuel is burned during the bursts, the calculated -value from the measurable quantities is consistent with 3.2 MeV/nucleon, corresponding to an hydrogen fraction X=0.4. Since other bursts could have been burnt during the observation gaps, the calculated value is only an upper limit and conversely the calculated value of X is a lower limit. We can indeed conclude that the burst fuel could be composed by mixed hydrogen and helium with X0.4.
4 DISCUSSION
The IBIS/ISGRI observations have allowed us to follow the high energy behavior of SAX J1810.8–2609 during its long and bright X-ray outburst. Light curves varied simultaneously in all X-ray bands monitored (2–10 keV, 22–45 keV, 45–68 keV). The X-ray spectra appeared always to be comparably soft, with a photon index of . The 20–100 keV luminosities are in the range (estimated for a source at 5.5 kpc), which is typical for the low hard state of neutron star binaries (Barret et al. 2000). We estimated a fluence of using an average bolometric flux of in the 0.1-500 keV energy band and an outburst duration of 40 days from ASM light curve. The long term time averaged accretion rate is yr-1, taking into account a time interval between two outbursts of 9.6yr. The ASM, IBIS and BAT 333in the 15-50 energy range, from http://heasarc.gsfc.nasa.gov/docs/swift/results/transients/weak/SAXJ1810.8-2609 light curves show the same behavior, so the outburst duration and the time between two outbursts are estimated using the ASM light curve. This time-average low mass accretion rate, the outburst luminosity of lower than typical values for neutron star soft X-ray transient (), together with low quiescent luminosity () reported by Jonker et al. 2004, strengthens the idea of these authors that this source belongs to the class of faint soft X-ray transient. In addition we note that the low average persistent bolometric luminosity is very similar as the luminosity of the Ultra Compact X-ray Binaries (see, e.g., Fiocchi et al. 2008 and Falanga et al., 2008). However, we think difficult to derive a conclusion about the ultra compact nature of the system because the derived hydrogen fraction in the burst fuel of SAX J1810.8–2609 is not consistent with an ultra compact source, since those are thought to accrete pure Helium from a white dwarf (Nelemans and Jonker, 2006).
Spectral parameters are not correlated with the observed luminosities,
but instead, they vary according with the rise/decay phases of the outburst.
During the rise of the flux,
the SAX J1810.8–2609 luminosity changes by a factor 2, while there are not modifications of the spectral shape:
the electron temperature is 23-30 keV
and optical depth of the plasma is 1.2-1.5.
This hard X-ray emission could be interpreted in the standard way, as produced by the
upscattering of soft seed photons by a hot, optically thin electron plasma.
During the decrease of the flux, spectra show a harder spectral shape
with an optical depth of the plasma lower than 0.8 and very high
electrons temperatures of 69-87 keV.
The spectral parameters measured during the decay phase of the 2007 outburst
agree with the ones found using the BeppoSAX observations (Natalucci et
al. 2000), showing the same X-ray spectral behavior: during the decay
phase of the outbursts of 1998 also no high energy spectral steepening was observed.
We cannot determine whether the emission is due to a thermal or non-thermal process,
because equally good fits are obtained either with a power law with no detectable cutoff
below 100 keV or with a thermal Comptonization spectrum with an electron
temperature in excess of 80-90 keV.
This electron distribution
could also arise from Comptonization by hybrid (thermal and non thermal) corona
(Coppi 1999), or from the Compton cloud located inside the neutron stars magnetosphere
(Titarchuk et al. 1996),
or, alternatively, the power-law component could be produced by
Comptonization of synchrotron emission in a relativistic jet
(Bosch-Ramon et al. 2005, Fender 2004).
Up to date there are few detections of radio emission associated
with neutron star X-ray transients and sometimes outbursts of soft X-ray transient were associated
with strong transient radio emission (Ball et al. 1995, Kuulkers et al. 1999, Fender & Kuulkers 2001).
A comparison with hard tails detected
from neutron star systems
and some black hole
binaries could be interesting suggesting that a similar mechanism could originate these components.
References
- Ball et al. (95) Ball, K., et al. 1995, MNRAS, 273, 722
- Barret et al. (2000) Barret, D., et al. 2000, ApJ, 533, 329
- Bosch-Ramon et al. (2005) Bosch-Ramon, V., Romero, G. E. and Paredes, J. M., 2005, A&A, 429, 267
- Cocchi, et al. (1998) Cocchi, M., et al. 1998, Nucl. Phys. B (Proc. Suppl.) 69/1-3, 232
- (5) Coppi P. S., 1999, in ASP Conf. Ser. 161, High Energy Processes in Accreting Black Holes, ed. J. Poutanen & R. Svensson (San Francisco: ASP), 375
- Courvoisier et al. (2003) Courvoisier, T. J.-L., et al., 2003, A&A 411, L53
- Cumming, (2003) Cumming, A., 2003, ApJ, 595, 1077
- Degenaar et al. (1998) Degenaar N., Klein-Wolt M. and Wijnands R. 2007, GCN Circ. 6707
- (9) Di Salvo, T., Stella, L., Robba, N. R., et al. 2000, ApJ, 544, 119
- (10) Di Salvo, T., Robba, N. R., Iaria, R. et al. 2001, ApJ, 554, 49
- (11) Falanga M., et al., 2008, A&A, 484, 43
- (12) Fender, R. P. & Kuulkers, E., 2001, MNRAS, 324, 923
- (13) Fender, R. P., 2004, Compact Stellar X-Ray Sources’, eds. W.H.G. Lewin and M. van der Klis, Cambridge University. astro-ph/0303339
- (14) Fiocchi M., Bazzano A., Ubertini P. et al. 2006, ApJ L, 657, 448
- (15) Fiocchi M., et al. 2008, accepted A&A
- (16) Galis, R., et al. 2007, ATel 1227
- Galloway et al. (2004) Galloway et al., 2004, ApJ, 601, 466
- Greiner et al. (1998) Greiner, J., Castro-Tirado, A.J., & Boller, T. 1998, IAU circ. 6985
- Greiner et al. (1999) Greiner, J., et al. 1999, MNRAS, 308, L17
- (20) Glasser, Odell, and Seufert , 1994, IEEE-Trans Nucl Sci, NS-41(4), 1343
- (21) Haymoz, P., et al. 2007, ATel 1185
- iaria (2001) Iaria, R., Di Salvo, T., Burderi et al. 2001, ApJ, 548, 883
- Iaria et al. (2002) Iaria, R., Di Salvo, T., Robba, N. R., Burderi, L., 2002, ApJ, 567, 503
- Jonker et al. (2004) Jonker, P. G., Galloway, D. K., McClintock, J. E., Buxton, M., Garcia, M., Murray, S., 2004, MNRAS, 354, 666
- Kubota et al. (2001) Kubota A., Makishima K., Ebisawa K., 2001, ApJ, 560, L147
- (26) Kuulkers, E., et al. 1999, MNRAS, 36,919
- Kuulkers et al. (2003) Kuulkers, E., et al. 2003, A&A, 399, 663
- Lewin, van Paradijs & Taam (1993) Lewin, W. H. G. L., van Paradijs, J. & Taam, R. 1993, Space Science Reviews, 62, 223
- le (96) Levine et al., 1996, ApJ, 469, 33
- Lund et al. (2003) Lund, N., et al. 2003, A&A, 411, L231
- Natalucci et al. (2000) Natalucci L., Bazzano A., Cocchi M., Ubertini P., Heise J., Kuulkers E., In’t Zand J.J.M. and Smith M.J.S., 2000, ApJ, 536, 891
- (32) Nelemans G. and Jonker P. G., 2006, astro-ph 5722
- Parson et al. (2007) Parson et al. 2007, GCN Circ. 6706
- (34) Piraino, S., Santangelo, A., Ford et al. 1999, A&A, 349, 77
- Schady and Parson (2007) Schady P. and Parsons A.M., 2007, GCN Circ. 6707
- (36) Tarana A., Bazzano B., Ubertini P. et al. A&A, 2006, 448, 336
- Titarchuck (1994) Titarchuck L., A&A, 434, 313
- Titarchuck (1996) Titarchuck L., Mastichiadis A. and Kylafis N. D., 1996, A&AS, 120, 171
- Ubertini et al. (1998) Ubertini P., et al., 1998, IAU circ. 6838
- Ubertini et al. (2003) Ubertini, R., et al. 2003, A&A, 411, L131
- Winkler et al. (2003) Winkler, C., Gehrels, N., Schönfelder, V., Roques, J.-P., Strong, A. W., Wunderer, C., & Ubertini, P. 2003, A&A, 411, 349