An EVLA search for water megamaser emission in the submm galaxy SMM J16359+6612 at z=2.5
Abstract
Using the Expanded Very Large Array, we have conducted a search for 22.2 GHz H2O megamaser emission in the strongly lensed submm galaxy, SMM J16359+6612 at z=2.517. This object is lensed into three components, and after a correction for magnification is applied to its submm-wavelength flux density, it is typical of the bulk of the high-redshift, submm galaxy population responsible for the 850 m extragalactic background ( 1 mJy). We do not detect any H2O megamaser emission, but the lensing allows us to place an interesting constraint on the luminosity of any megamasers present, 5305 for an assumed linewidth of 80 km s-1. Because the far-infrared luminosity in submm galaxies is mainly powered by star formation, and very luminous H2O megamasers are more commonly associated with quasar activity, it could be that blind searches for H2O megamasers will not be an effective means of determining redshifts for less luminous members of the submm galaxy population.
1 Introduction
Single-dish submm/mm-wavelength surveys have revealed a population of massive, dust-enriched, far-infrared (FIR) luminous star-forming galaxies in the early Universe (Smail, Ivison & Blain 1997; Hughes et al. 1998; Barger et al. 1998; Bertoldi et al. 2000). Since their discovery, redshift determination for individual members of this submm galaxy (SMG) population has been hindered by the lack of sufficiently accurate astrometry needed to identify multi-wavelength counterparts, limited by the coarse angular resolution of single-dish submm/mm telescopes (10-20′′), and the faintness of SMGs at optical wavelengths. For the brightest members of the SMG population, deep radio interferometry imaging has provided a powerful solution to the former problem of identifying counterparts (e.g. Ivison et al. 1998, 2000, 2002, 2007; Smail et al. 2000; Webb et al. 2003; Clements et al. 2004; Borys et al. 2004; Dannerbauer et al. 2004), resulting in the ability to measure spectroscopic redshifts for the proposed optical counterparts to the members of the SMG population. Such surveys find a median spectroscopic redshift for bright SMGs (5 mJy) of (Chapman et al. 2003, 2005). However, between 65–80% of bright SMGs have secure radio counterparts (e.g. Ivison et al. 2005, 2007), so a significant fraction may lie at , given the radio wavelength selection effects. The uncertainty in the redshift distribution of the fainter SMG population (5 mJy at 850m) makes it difficult to complete the luminosity function for SMGs and hence difficult to accurately constrain the obscured star-formation rate of the Universe at the highest redshifts.
Alternative methods of redshift determination for SMGs have been explored, including photometric redshift techniques which rely on the measured continuum flux densities at submm-to-radio wavelengths (Hughes et al. 1998; Carilli & Yun 1999, 2000; Aretxaga et al. 2003, 2005). These techniques have proven to be accurate to (rms) for SMGs at , when three or more FIR-to-radio flux densities are measured (Aretxaga et al. 2005)111It has been argued that this same level of uncertainty can be achieved if one assumes the median redshift of the bright SMG sample for individual objects (Chapman et al. 2005).. For those SMGs with well constrained spectral energy distributions, the predictions of such techniques have helped to guide the choice of tunings for broadband cm-wavelength searches for redshifted CO line emission (Wagg et al. 2007), which should be an effective means of measuring SMG redshifts given the intensity of molecular CO line emission in these objects (e.g. Neri et al. 2003; Greve et al. 2005). The first cm-wavelength search for redshifted low-J CO line emission (J=2-1/1-0) in a SMG with no optical spectroscopic redshift was unsuccessful (Wagg et al. 2007), while a great deal of uncertainty remains in the expected intensity in the low-J CO lines. Given the expected high densities of the molecular gas in the interstellar media of these SMGs (Weiss et al. 2005), it is possible that mm-wavelength searches for high-J CO line emission will yield more positive results. Such observations will soon be possible with the ultra-wide bandwidth “Redshift Receiver” on the Large Millimeter Telescope (LMT; Pérez-Grovas et al. 2006).
Broadband spectral line observations of SMGs at lower frequencies (10 GHz), may yield redshifts through the detection of OH or H2O maser emission (Townsend et al. 2001; Ivison 2006). Such observations have an advantage over higher frequency CO line searches in that the bandwidth needed to cover the same redshift interval decreases with decreasing frequency. This means that the broadband capabilities of the NRAO Green Bank Telescope (GBT222The NRAO is operated by Associated Universities Inc., under a cooperative agreement with the National Science Foundation.), or the Expanded Very Large Array (EVLA), could potentially be exploited to measure redshifts for SMGs via OH or H2O maser emission lines. The luminosity in the 22.2351 GHz H2O maser line has been found to depend weakly on FIR luminosity in nearby galaxies (Castangia et al. 2008), while a stronger dependence of the OH maser line luminosity on FIR luminosity has been demonstrated (Darling & Giovanelli 2002). However, given that the OH maser lines emit at rest frequencies of 1665.4018 and 1667.3590 MHz, for objects at , these lines are redshifted to the MHz band, where the presence of radio frequency interference (RFI) for many existing facilities, may make it difficult to identify the OH lines in objects whose redshifts are unknown. For these same redshifts, the H2O maser line is redshifted to frequencies in the 5–8 GHz range, where RFI is less of a problem. It should then be more effective to conduct blind searches for redshifted H2O maser emission when attempting to measure redshifts for SMGs. Before such a technique can be applied, it must first be demonstrated that H2O masers exist in SMGs with known redshifts. To date, the highest redshift detection of an H2O maser is in a type 2 quasar at (Barvainis & Antonucci 2005). Ivison (2006) conducted a search for both OH and H2O megamaser emission in the strongly lensed, ultraluminous infrared quasar, APM 08279+5255 at z=3.91, however no line emission is detected.
Here, we conduct a search for H2O maser emission in the lensed SMG, SMM J16359+6612 at (Kneib et al. 2004, 2005). Given the large total magnification factor inferred by the gravitational lensing model (), this object has an intrinsic flux density typical of the bulk of the SMG population responsible for the 850 m background radiation (1 mJy). This object is strongly gravitationally lensed, and is the only SMG to have been detected in HCN J=1-0 line emission (Gao et al. 2007), implying the presence of dense gas. SMM J16359+6612 presents a good candidate in which to conduct a search for H2O maser emission, and one of only two strongly lensed SMGs for which such a search is possible. Our overall aim is to determine if searches for this line can be used to obtain blind redshifts for SMGs in future surveys, and for this pilot study we have chose to focus on less luminous SMGs typical of the submm extragalactic background. Throughout this work, we assume H0=71 km s-1, M=0.27, and Λ=0.73 (Spergel et al. 2007).
2 Observations and data reduction
We observed SMM J16359+6612 with the Very Large Array (VLA) on 2008 June 4 in its compact DnC configuration. The details of these observations are given in Table 1. At the source redshift of (determined from multiple CO emission lines; Weiss et al. 2005), the 22.23508 GHz H2O maser line is redshifted to 6.322 GHz, which is now accessible with the new C-band receivers available through the Expanded Very Large Array (EVLA) project. The observations were configured to have a 391 kHz channel width, equivalent to 18.5 km s-1 velocity resolution over a bandwidth of 12.5 MHz (591 km s-1). In total, 9 hours of on-source integration time was obtained with the 15 EVLA antennas available, leading to a synthesized beamsize of 10′′. Due to the current C-band receiver temperatures at non-standard frequencies, and a source of unknown noise associated with using 12.5 MHz of bandwidth with the VLA correlator, our final sensitivities are 5 worse than what will be achievable using the full array of EVLA antennas with the new, WIDAR correlator.
Data reduction was performed using the Astronomical Image Processing System (AIPS) of NRAO. Some “flagging” was required, which resulted in 2 of the 15 EVLA antennas being removed entirely from the analysis. Flux, bandpass, and phase calibrations were derived from observations of 3C286 and 1642+689. After applying the calibration solutions to the target data, uniform weighted dirty stokes I cubes were produced.
3 Results
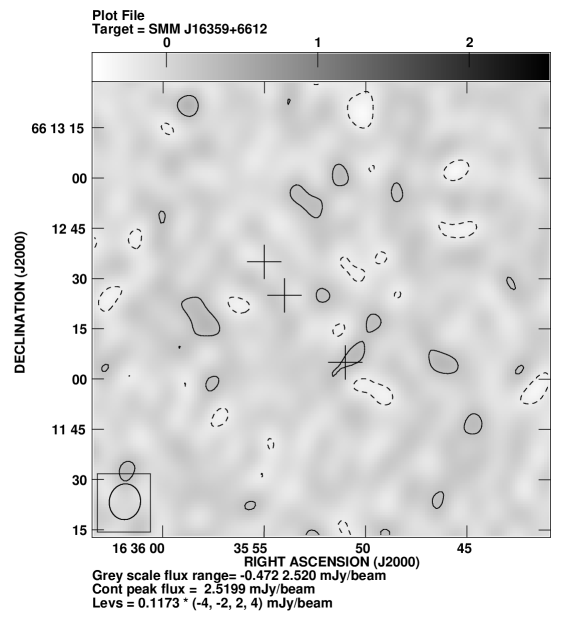
The submm/mm emission from SMM J16359+6612 is lensed into 3 components, where the observed flux densities of components A, B and C have been amplified by factors of 14, 22, and 9, respectively (Kneib et al. 2004). No 6.3 GHz continuum emission is detected from any of the 3 components in the continuum image above an apparent rms of 117 Jy/beam (Fig. 1). These limits on the 6.3 GHz continuum emission are consistent with the value of 175 Jy for the peak 6.3 GHz flux density of the brightest component, predicted from the 1.4 and 8.2 GHz detections of SMM J16359+6612 with the VLA and the Westerbork Synthesis Radio Telescope (WSRT) by Garrett et al. (2005). Spectra were extracted at the positions of each of the lensed components determined from the centroids of the high-J CO line emission. Each spectrum was corrected for lensing amplification. From the three spectra, an average spectrum was created using the “de-magnified” noise of each in the weighting (Fig. 2). Although our channel rms is 520 Jy/beam, by first de-magnifying and then averaging the spectra extracted at the positions of the three components, we are able to reach a sensitivity equivalent to 16 Jy/beam per 391 kHz channel.
Inspection of the individual spectral line data cubes did not reveal any significant detection of H2O megamaser emission in SMM J16359+6612, nor is any emission detected in the average spectra of the 3 components (Fig. 2). Although we do not detect redshifted H2O maser emission in SMM J16359+6612, our sensitivity is sufficient to derive strong constraints on the luminosity of any H2O megamaser emission present. Typical linewidths of H2O maser emission lines in FIR bright galaxies are in the range 1–130 km s-1, with one example of a 260 km s-1 line in Arp299 (Henkel et al. 2005). As such, we assume intermediate linewidths of 20, 40, 60 and 80 km s-1, in order to calculate our H2O line luminosity limits following the definition given in Solomon & Vanden Bout (2005). Before correcting the noise of an individual component for lensing magnification, the 3- line luminosity limits are, (8.7, 12.2, 15.0, and 17.3) , for the assumed linewidths. Much stronger constraints are obtained when we correct for lensing and calculate these luminosity limits for the average spectrum: 2652, 3751, 4594, and 5305 .
4 Discussion
We can estimate whether our limits to the H2O megamaser line luminosity in SMM J16359+6612 are consistent with the value expected from the FIR luminosity and the luminosity correlation suggested by Castangia et al. (2008) for nearby galaxies. We note that this correlation is weak, and a wide range of H2O line luminosities appear to be valid. The unlensed 850 m flux density of each image of SMM J16359+6612 is 0.8 mJy (Kneib et al 2004), which can be converted to a FIR luminosity, 1.51012 for an assumed dust temperature, K. From the luminosity relation for Galactic star-forming regions (Genzel & Downes 1979; Jaffe et al. 1981), we should expect an H2O megamaser line luminosity, 1500 . This prediction is broadly consistent with the limits we obtain here for the narrowest linewidths assumed. For comparison, the luminosity in the H2O megamaser line detected in a type 2 quasar at by Barvainis & Antonucci (2005) is 2.3104 .
We propose possible explanations for our non-detection of H2O megamaser emission in SMM J16359+6612. Although it is unlikely, it could be that the limited velocity covered by our choice of bandwidth (574 km s-1) is too small, as the maser emission may be at a significantly different redshift from that of the CO emission lines (e.g. Wilner et al. 1999). However, the more probable reason for our non-detection is that the molecular medium within SMM J16359+6112 is not conducive to the formation of megamaser emission. Neufeld et al. (1994) argue that luminous water maser emission can be excited by X-ray photons from an active galactic nuclei (AGN). Strong H2O maser emission would arise in gas with temperatures of 400-1000 K and pressures of P/=1011 cm-3 K, irradiated by intense X-ray emission. Such AGN powered circumnulear H2O megamasers can attain much larger line luminosities than the interstellar masers found in starburst galaxies, which are consequently termed “kilomasers”. X-ray studies of SMGs confirm that while 28–50% do harbour an AGN, such AGN activity may only contribute to a small fraction of their enormous FIR luminosities (e.g. Alexander et al. 2005). Given the rarity, and lower luminosities of AGN in SMGs, it is likely that the dense molecular gas in SMM J16359+6612 inferred from the HCN line emission is most likely associated with high-mass star-formation. Extragalactic regions of star-formation may give rise to water maser emission, however this emission is generally weaker than that observed in galaxies with luminous AGN. Such is the case with the nearby galaxy, NGC 520, whose kilomaser line luminosity is lower than expected from its FIR luminosity (Castangia et al. 2008). A third possibility for our non-detection of H2O megamaser emission is that the emission is variable. Argon et al. (2007) found that the H2O maser emission in the nearby galaxy, NGC 4258, varied by a factor of 12 over a 3 year period.
This non-detection of H2O megamaser emission in SMM J16359+6612 has consequences for the use of this line as a redshift indicator in future studies of less luminous SMGs typical of the submm extragalactic background. Given the strong gravitational lensing amplification of this object, making it one of the brightest of the currently detected SMGs, J16359 should be one of the most likely SMGs to exhibit detectable H2O megamaser emission. It has recently been suggested that the H2O maser detection rate is weakly correlated with a galaxy’s FIR luminosity (Castangia et al. 2008). If this is the case, then it may be that similarly bright, unlensed SMGs may be more likely to contain H2O megamasers. However, mounting evidence suggests that the brightest (15 mJy), and subsequently most luminous SMGs may be at the highest redshifts (e.g. Younger et al. 2007; Wang et al. 2007), and so cosmological dimming of the line intensity would necesitate large integration times (more than 100 hours), even with the full EVLA. Such searches would be best carried out with the future Square Kilometer Array (SKA).
5 Summary
We have conducted the first search for 22 GHz water megamaser emission in a high-redshift SMG, by observing the strongly lensed, SMM J16359+6612 at z=2.517, with the currently available EVLA antennas. No emission is detected, resulting in a 3- luminosity limit of 5305 L⊙ for an assumed linewidth of 80 km s-1. With an optimally working, completed EVLA we would have achieved 5 higher sensitivity, reaching down into the kilomaser luminosity range. Our non-detection suggests that luminous H2O megamasers may not be present to provide reliable redshift estimates for the less luminous members of the SMG population, however future surveys of lensed SMGs with secure CO line redshifts are needed to strengthen this conclusion.
6 Acknowledgments
We thank the NRAO staff involved in the EVLA project for making these observations possible. JW and CC are grateful for support from the Max-Planck Society and the Alexander von Humboldt Foundation. We thank the anonymous referee for helpful suggestions on the original manuscript.
References
- (1) Alexander, D.M. et al. 2005, Nature, 434, 738
- (2) Aretxaga, I., Hughes, D. H., Chapin, E. L., Gaztañaga, E., Dunlop, J. S., & Ivison, R. J. 2003, MNRAS, 342, 759
- (3) Aretxaga, I., Hughes, D. H., & Dunlop, J. S. 2005, MNRAS, 358, 1240
- (4) Argon, A. L., et al. 2007, ApJ, 659, 1040
- (5) Barger A.J., Cowie L.L., Sanders D.B., Fulton E., Tanigushi Y., Sato Y., Kawara K., Okuda H., 1998, Nat, 394, 248
- (6) Barvainis R., Antonucci R., 2005, ApJ, 628, L89
- (7) Bertoldi, F., et al. 2000, A&A, 360, 92
- (8) Borys, C., et al. 2004, MNRAS, 355, 485
- (9) Carilli, C.L., Yun, M.S., 1999, ApJ, 513, L13
- (10) Carilli, C.L., Yun, M.S., 2000, ApJ, 530, 618
- Castangia et al. (2008) Castangia, P. et al. 2008, A&A, 479, 111C
- (12) Chapman S.C., et al. , 2003, Nature, 422, 695
- (13) Chapman S.C., et al. , 2005, ApJ, 622, 772
- (14) Clements, D., et al. 2004, MNRAS, 351, 611
- (15) Dannerbauer, H., et al. 2004, ApJ, 606, 664
- (16) Darling, J., & Giovanelli, R. 2002, 124, 100
- (17) Garrett, M. A., Knudsen, K. K., & van der Werf, P. P. 2005, A&A, 431, L21
- (18) Gao, Y., et al. 2007, ApJ, 660, L93
- (19) Genzel, R., & Downes, D. 1979, A&A, 72, 234
- (20) Greve T.R., et al. 2005, MNRAS, 359, 1165
- (21) Henkel, C. et al. 2005, A&A, 436, 75
- (22) Hughes D.H., et al., 1998, Nat, 394, 241
- (23) Ivison, R.J., et al. 1998, MNRAS, 298, 583
- (24) Ivison, R.J., et al. 2000, ApJ, 542, 27
- (25) Ivison, R.J. et al., 2002, MNRAS, 337, 1
- (26) Ivison, R.J. et al. 2005, MNRAS, 364, 1025
- (27) Ivison R. J., 2006, MNRAS, 370, 495
- (28) Ivison, R.J. et al., 2007, MNRAS, 380, 199
- Kneib et al. (2004) Kneib, J.-P., et al. 2004, MNRAS, 349, 1211
- Kneib et al. (2005) Kneib, J.-P., et al. 2005, A&A, 434, 819
- (31) Lo, K. Y. 2005, ARA&A, 43, 625
- (32) Neri, R., et al. 2003, ApJ, 597, L113
- Neufeld et al. (1994) Neufeld, D. A., et al. 1994, ApJ, 436, L127
- Pérez-Grovas et al. (2006) Pérez-Grovas, A. S., Schloerb, F. P., Hughes, D., & Yun, M. 2006, Proc. SPIE, 6267,
- (35) Smail, I., Ivison R.J., Blain A.W., 1997, ApJ, 490, L5
- (36) Smail, I., et al. 2000, ApJ, 528, 612
- Solomon & Vanden Bout (2005) Solomon, P.M., & Vanden Bout, P. A. 2005, ARA&A, 43, 677
- (38) Spergel D. N., et al., 2007, ApJS, 170, 377
- (39) Townsend, R.H.D., et al. 2001, MNRAS, 328, L17
- (40) Wagg, J., et al. 2007, MNRAS, 375, 745
- (41) Wang, W.-H., Cowie, L. L., van Saders, J., Barger, A. J., & Williams, J. P. 2007, ApJ, 670, L89
- (42) Webb T.M. et al., 2003, ApJ, 587, 41
- (43) Weiß, A., Downes, D., Walter, F., & Henkel, C. 2005, A&A, 440, L45
- Wilner et al. (1999) Wilner D. J. et al. 1999, ApJ, 117, 1139
- Younger et al. (2007) Younger, J. D., et al. 2007, ApJ, 671, 1531

| Frequency: | 6.322 GHz |
| Pointing Center (J2000): | 16h35m44s.15, +66o12m24s |
| Synthesized beam: | , P.A. -7.4∘ |
| Channel spacing: | 391 kHz |
| line rms (391 kHz channel): | 520 Jy beam-1 |
| continuum rms: | 117 Jy beam-1 |