Search for the decay with the KLOE detector
Abstract
We present the result of a direct search for the decay , obtained with a sample of events produced at DANE, the Frascati –factory, for an integrated luminosity of . The search has been performed using a pure beam tagged by the simultaneous detection of a interaction in the calorimeter. Background rejection has been optimized by using both kinematic and particle identification cuts. We find at 90% CL, which improves by an order of magnitude on the previous best limit.
keywords:
collisions , DANE , KLOE , rare decays , CP, PTPACS:
13.20.Eb, , , , , , , , , , , , , , , , , , , , , , , , , , , , , , , , , , , , , , , , , , , , , , , , , , , , , , , , , , , , , , , ,
1 Introduction
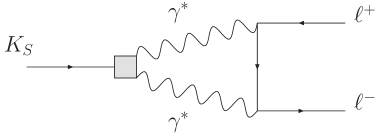
The , decays into leptons pairs (, ) are due to flavour-changing neutral-currents (FCNC) transitions. The decay amplitudes receive contributions both from long distance (LD) effects, dominated by the intermediate state shown in Fig. 1, and from short-distance (SD) effects, due to box and penguin diagrams via , exchange.
The SD contribution can be rather precisely evaluated in the Standard Model (SM) so that a theoretical evaluation of the LD contribution would allow a comparison of experimental results against predictions that may represent a significant test of the SM. For the decay the evaluation of the LD contribution needs a model for the form factor, while for the it can be determined at lowest order in the chiral perturbation theory. In this case one obtains [1]:
| (1) |
Using the present average [2] for BR(), we evaluate . A value significantly higher would point to new physics. The best experimental limit for BR() has been obtained by CPLEAR [3], and it is equal to , at CL. Here we present a new search for this decay, which improves on the previous limit by more than an order of magnitude.
2 Experimental setup
The data were collected with the KLOE detector at DANE, the Frascati –factory. DANE is an collider that operates at a center-of-mass energy of , the mass of the meson. Positron and electron beams of equal energy collide at an angle of , producing mesons with a small momentum in the horizontal plane: . mesons decay of the time into nearly collinear pairs. Because , the kaon pair is in an antisymmetric state, so that the final state is always . The contamination from and final states is negligible. Therefore, the detection of a signals the presence of a of known momentum and direction, independently of its decay mode. This technique is called tagging. The sample analyzed corresponds to an integrated luminosity of , yielding billion pairs.
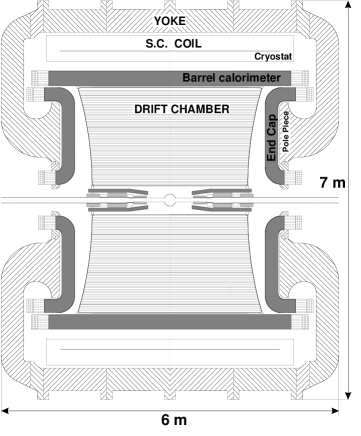
The KLOE detector (Fig. 2) consists of a large cylindrical drift chamber (DC), surrounded by a lead/scintillating-fiber sampling calorimeter (EMC). A superconducting coil surrounding the calorimeter provides a magnetic field. The drift chamber [4] is in diameter and long. The chamber shell is made of carbon-fiber/epoxy composite, and the gas used is a helium, isobutane mixture. These features maximize transparency to photons and reduce regeneration and multiple scattering. The momentum resolution is , and the invariant mass is reconstructed with a resolution of .
The calorimeter [5] is divided into a barrel and two endcaps, covering of the solid angle. The modules are read out at both ends by photomultiplier tubes. The arrival times of particles and the three-dimensional positions of the energy deposits are determined from the signals at the two ends. The read-out granularity is ; fired “cells” close in space and time are grouped into a “calorimeter cluster”. For each cluster, the energy is the sum of the cell energies, and the time and the position are calculated as energy-weighted averages over the fired cells. The energy and time resolutions are and , respectively.
The trigger [6] used for this analysis requires two local energy deposits above a threshold of in the barrel and in the endcaps. The trigger has a large time spread with respect to the beam crossing time. However, it is synchronized with the machine RF divided by 4, , with an accuracy of . An estimate of the event production time () is determined offline.
The response of the detector to the decays of interest and the various backgrounds were studied by using the KLOE Monte Carlo (MC) simulation program [7]. Changes in the machine operation and background conditions are simulated on a run-by-run basis. The beam energies and the crossing angle are obtained from the analysis of Bhabha scattering events with polar angle above 45 degrees. The average value of the center-of-mass energy is evaluated with a precision of for each of integrated luminosity.
To study the background rejection, a MC sample of decays to all possible final states has been used, equivalent to an integrated luminosity of . A MC sample of events has been also produced, corresponding to a BR of . This sample is used to measure the selection efficiency, and includes radiative corrections. Two processes are expected to contribute to photon emission: the inner bremsstrahlung photon emission, ; a two-photon decay with one virtual photon conversion, . The first process is simulated using the PHOTOS [8] generator. The events due to the second process are rejected by the kinematic cuts used in the analysis.
3 Data analysis
The identification of -interaction in the EMC is used to tag the presence of mesons. The mean decay lengths of and are and , respectively. About of ’s therefore reach the calorimeter before decaying. The interaction in the calorimeter barrel () is identified by requiring a cluster of energy above , not associated with any track, and with a time corresponding to the velocity in the rest frame, . Requiring we selected million -tagged events ( events in the following), which are used as a starting sample for the search.
As a first step of the signal search, we select events with tracks of opposite charge having point of closest approach to the origin within a cylinder in radius and in length along the beam line. The two tracks are required to form a vertex with position in the transverse plane . Moreover, the track momenta () and polar angles () must satisfy the cuts: and . The tracks must also reach the EMC without spiralling, and have an associated cluster with energy and position in the transverse plane . These requirements ensure a redundant determination of the event- and allow us to evaluate the time of flight (TOF) for each particle.
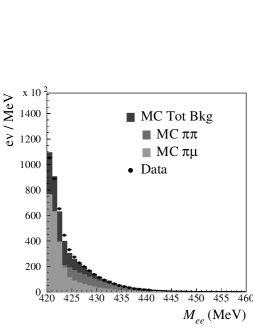
The two-track invariant mass evaluated in the hypothesis of electron mass, , is used to reject the dominant background due to . We require , thus removing most of events which peak at , with a resolution of . In order to reject tracks with a larger uncertainty on the fit parameters, we also require the propagated error on the invariant mass, , to be less than . In Fig. 3, the distribution is shown for both MC signal and background.
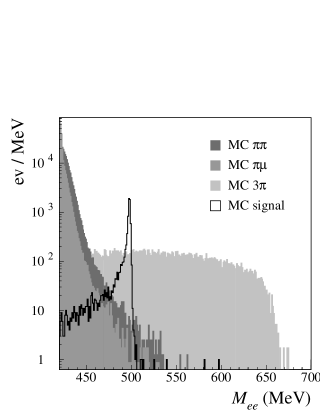
The background is due to the following sources: residual events, populating the low region, and events, spreading over the whole spectrum. A event can have such a high value of either because one track is badly reconstructed ( component in the following) or because one pion decays to a muon before entering the DC and the vertex is reconstructed from a pion and a muon track ( component hereafter). A event ( component in the following) can satisfy the tagging criteria from the presence of a machine background cluster (fake ). At this stage of the analysis, we are left with events. The efficiency for signal selection, given the tagging, is , as evaluated using MC.
The absolute background level is not taken directly from MC , but is obtained by normalization of data in the region of signal sidebands. The reliability of MC prediction is checked comparing with data after each step of the analysis. For this purpose, the interval is divided into a signal region, around the kaon mass peak, and two sidebands:
| (2) |
and background sources largely dominate on component in region 1, the opposite occurring in region 3. A scale factor for the component, , is therefore directly evaluated in region 3 as the ratio of the number of events in the data sample and the number of MC events. We obtain:
| (3) |
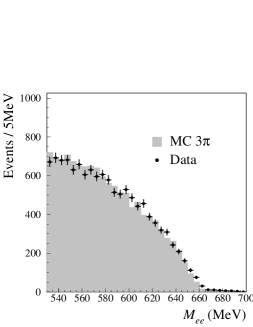
which has to be compared with a data/MC luminosity scale factor of . The observed discrepancy is well understood, being due to the fact that MC underestimates the rate of fake from machine background. After normalization, the shape is well reproduced by MC sample, as shown in the left panel of Fig. 4. To obtain the scale factors and for the and components, we fit the distribution in region 1 to a linear combination of the MC background spectra with the component fixed as in Eq. 3. The MC distribution after fit is compared to data in the right panel of Fig. 4; we obtain:
| (4) |
where is the correlation factor and the errors quoted are statistical only. The scale factors and have to be compared with the expected data/MC ratio of . A sizable deviation is observed for events, which is expected since MC tends to underestimate the rate of events in the very far tails of the tracking resolution. After normalization, the number of background events, , is estimated as:
| (5) |
Kinematics and topology can be further exploited to improve background rejection. For most of and events, at least one pion track is well reconstructed, so that its momentum in the rest frame peaks around 206 MeV, as expected for decays. The signal distribution populates higher values of (see Fig. 5).
Therefore we require for both tracks and , thus rejecting of and events and of signal events lying in the low tail.
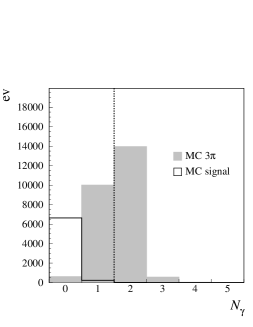
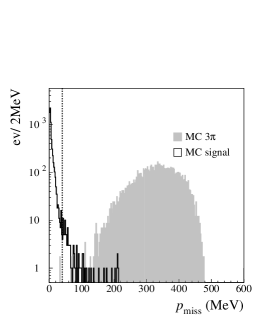
To further reject events we follow a two-step procedure. First, we exploit the fact that in of the cases the two photons originated in decay are observed. Each cluster is identified by TOF through the requirement . The number of detected ’s is shown in the left panel of Fig. 6 for MC signal and events. We reject events with , thus introducing a loss of signal events.111Rejecting events with would improve background rejection, but would also introduce a systematic error in the evaluation of signal efficiency related to photon radiation in the final state. Second, we cut on the total missing momentum of the decay, evaluated as , where are the neutral kaon momenta, and is the momentum. The momentum is evaluated from the charged track momenta, while the momentum is measured from the cluster position and the boost. The distribution is shown in the right panel of Fig. 6 for MC signal and events. We reject events with , thus introducing a loss of signal events while reducing the background to a negligible level.
A comparison between data and the expected background, , in the sidebands after and cuts is shown in Table 1. This proves the reliability of the background simulation and of the normalization procedure.
| Region 1 | Region 3 | |||||
|---|---|---|---|---|---|---|
| Cut | Data | Data | ||||
| 3738 | 3980(100) | -2.09 | 12107 | 12140(230) | -0.11 | |
| 1516 | 1720(60) | -2.83 | 5041 | 5090(120) | -0.36 | |
No event is observed in region 1, while one event remains in region 3 after cut, for both data and MC background. The surviving MC event is a decay.
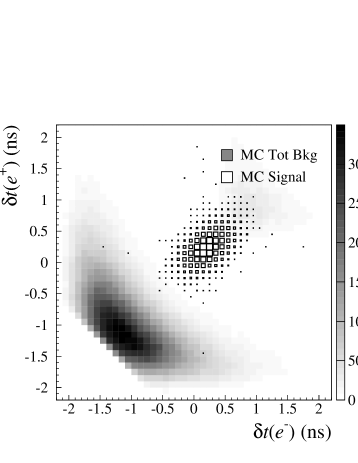
At this stage of the analysis, in region 2 we count three events for data and three events for MC background. To improve background rejection, we exploit the particle identification capability of the calorimeter. For this purpose, we evaluate the difference between the measured cluster time and the expected particle time of flight under mass hypothesis , where . The high rejection capability provided by the TOF is demonstrated in Fig. 7, where the scatter plot for of the two tracks is shown for MC signal and background events, before application of the , and cuts.
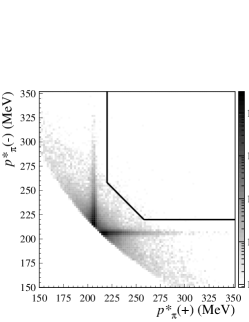
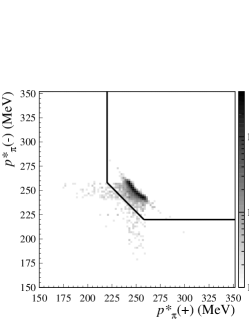
The best rejection is obtained by using the sum . The scatter plot of as a function of is shown in Fig. 8 for all of the events surviving the background rejection cuts.
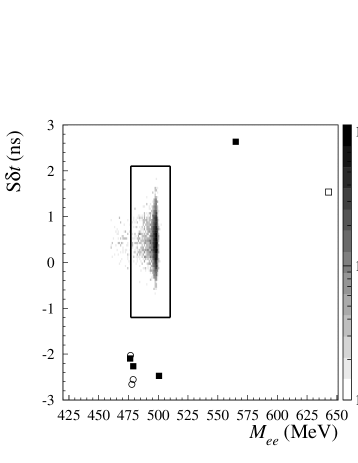
The signal box is then defined as follows:
| (6) |
This corresponds to a cut on . The lower bound of the range has been set to clearly define the fraction of IB spectrum which is accepted in our selection: all events with a radiated photon with energy above are rejected. This cut reduces to a negligible level the other contribution to radiative decay, , which is strongly peaked for . Following Ref. [9], we evaluated , which is far beyond our experimental sensitivity. After the signal box cut we evaluate a signal efficiency given the tag .
Applying the signal box selection, we observe no event on data. Equally, no MC background event falls in the signal box, see Fig. 8. In the conservative assumption of no background, we obtain the upper limit on the expected number of signal events , at CL.
4 Systematic uncertainties
Since no background subtraction has been made, there is no need to asses any systematic error on the scale factors applied to the MC. The selection efficiency for has been corrected to take account of small differences between data and MC tracking efficiency. The latter has been evaluated on a control sample, both for data and MC. A systematic uncertainty of has been evaluated by varying the correction in its allowed range. In order to evaluate the systematic uncertainty related to the cuts on , and , we have used a control sample, selected by a tight cut around the kaon mass for both data and MC events. The systematics on the previous cuts has been then evaluated on the control sample as the difference between data and MC efficiencies for each of the above requirements, as listed in Table 2. Finally, we checked the effect of IB photon emission on the selection efficiency. The presence of radiated photons affects indeed the shape of the momentum distribution, and thus the efficiency of the selection. A systematic uncertainty of has been evaluated by comparing results obtained with or without the inclusion of photon radiation in the final state.
| Source | Fractional error |
|---|---|
| Tracking | 0.9% |
| 1.4% | |
| 0.5% | |
| 1.3% | |
| 0.8% | |
| total | 2.3% |
All of the contributions to the systematic uncertainty are listed in Table 2. The total fractional error is .
5 Upper limit evaluation
The upper limit on BR() is evaluated by normalizing to the number of events, , counted in the same sample of tagged events:
where and are the tagging efficiency and the selection efficiency, given tag, for each channel. events are identified by requiring the presence of two tracks of opposite charge, selected with the same cuts as for , with no additional requirements on invariant mass, kinematical quantities, and particle identification. The selection efficiency for both channels is evaluated from MC, with corrections extracted from data control samples. We obtain and . The ratio of tagging efficiencies slightly differs from unity, . This dependence of the tagging efficiency on the decay mode is due to a small difference in the determination of the event- in presence of electrons or pions in the final state, which affects the measurement of the velocity. This bias is evaluated from data using and events [10]. Using and BR() from Ref. [2], we obtain:
| (7) |
The effect of systematic uncertainty (see Sec. 4) on the BR evaluation is accounted for by a Gaussian smearing of the total efficiency in the UL calculation. Our measurement improves by a factor of on the CPLEAR result [3], for the first time including radiative corrections in the evaluation of the upper limit.
Acknowledgments
We thank the DANE team for their efforts in maintaining low background running conditions and their collaboration during all data-taking. We want to thank our technical staff: G.F. Fortugno and F. Sborzacchi for ensuring the efficient operation of the KLOE computing facilities; M. Anelli for his continuous attention to the gas system and the safety of the detector; A. Balla, M. Gatta, G. Corradi and G. Papalino for maintenance of the electronics; M. Santoni, G. Paoluzzi and R. Rosellini for the general support to the detector; C. Piscitelli for his help during major maintenance periods. This work was supported in part by EURODAPHNE, contract FMRX-CT98-0169; by the German Federal Ministry of Education and Research (BMBF) contract 06-KA-957; by the German Research Foundation (DFG), ’Emmy Noether Programme’, contracts DE839/1-4; by INTAS, contracts 96-624, 99-37; and by the EU Integrated Infrastructure Initiative HadronPhysics Project under contract number RII3-CT-2004-506078.
References
- [1] G. Ecker and A. Pich, Nucl. Phys. B 366 (1991) 189.
- [2] W.-M. Yao et al., J. Phys. J. G 33 (2006) 1.
- [3] CPLEAR Collaboration, A. Angelopoulos et al., Phys. Lett. B 413 (1997) 232.
- [4] KLOE Collaboration, M. Adinolfi et al., Nucl. Istrum. Meth. A 488 (2002) 51.
- [5] KLOE Collaboration, M. Adinolfi et al., Nucl. Istrum. Meth. A 482 (2002) 364.
- [6] KLOE Collaboration, M. Adinolfi et al., Nucl. Istrum. Meth. A 492 (2002) 134.
- [7] KLOE Collaboration, F. Ambrosino et al., Nucl. Istrum. Meth. A 534 (2004) 403.
- [8] E. Barberio and Z. Was, Comput. Phys. Commun. 79 (1994) 291.
- [9] L. Bergstrom, E. Masso and P. Singer, Phys. Lett. B 131 (1983) 229.
- [10] KLOE Collaboration, F. Ambrosino et al., Eur. Phys. J. C 48 (2006) 767