Very High Energy -ray Observations of the Galactic Centre Region
Abstract
Recent progress in pushing the sensitivity of the Imaging Atmospheric Cherenkov Technique into the 10 mCrab regime has enabled first sensitive observations of the innermost few 100 pc of the Milky Way in Very High Energy (VHE; GeV) -rays. These observations are a valuable tool to understand the acceleration and propagation of energetic particles near the Galactic Centre. Remarkably, besides two compact -ray sources, faint diffuse -ray emission has been discovered with high significance. The current VHE -ray view of the Galactic Centre region is reviewed, and possible counterparts of the -ray sources and the origin of the diffuse emission are discussed. The future prospects for VHE Galactic Centre observations are discussed based on order-of-magnitude estimates for a CTA type array of telescopes.
Keywords:
gamma-rays: observations; galaxy: centre:
98.35.Jk, 98.70.Rz, 95.85.Pw1 The inner few 100 pc of the Milky Way
Ever since the discovery of the strong compact radio source Sgr A∗ Balick and Brown (1974), the Galactic Centre (GC) has been subject to intense astrophysics and astronomy research. In the last decade, precise data from this peculiar region, that evades observations at optical wavelengths due to obscuration by dust along the line-of-sight, have been obtained at radio, infrared (IR), X-ray, and hard X-ray/soft -ray energies. Because of its proximity, the GC is a unique, however complex, laboratory for investigating the astrophysics believed to be taking place in galactic nuclei in general.
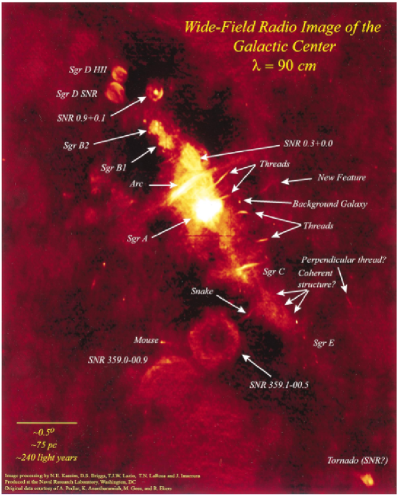
In the first large-scale compilation of 90 cm radio observations provided by La Rosa, Kassim, and Lazio LaRosa et al. (2000), the central few 100 pc region reveals a complicated morphology with various objects, mostly supernova remnants, H II regions, and Giant Molecular Clouds (see Fig. 1). Thread-like filaments, notably the GC radio arc, exhibit highly polarised radiation with no line emission Yusef-Zadeh et al. (1984), and are therefore, amongst others, regions with populations of non-thermal electrons, emitting synchrotron radiation.
The structure of molecular clouds in the region has been mapped already in the 1970s using and lines (e.g. Bania (1977); Liszt et al. (1977)). These measurements, however, suffer from background and foreground contamination from molecular clouds in the Galactic disk. In the velocity range of interest for mapping the GC region, km/s, the CS (J=1-0) line is expected to be essentially free of such contaminations. Albeit being less sensitive because of its higher critical density, CS emission provides an efficient tracer of the dense molecular clouds close to the GC. The most complete CS map of the region is provided by measurements of the NRO radio telescope Tsuboi et al. (1999) and yields a total mass in molecular clouds of in the inner 150 pc region. These clouds are a potential target for cosmic rays accelerated within the region.
The radio view of the inner 50 pc region is dominated by the Sgr A complex, with Sgr A∗ at its centre. Along the line-of-sight of Sgr A∗ lies Sgr A East, at a projected distance of 2.5 pc from the GC, enclosing in projection Sgr A West, a three-armed structure which spirals around Sgr A∗ and exhibits a thermal spectrum.
Sgr A East resembles a compact morphology because of the high density of interstellar material ( cm-3) which prevents a fast evolution of the forward shock. Furthermore, it interacts with a dense molecular cloud (density cm-3) on its eastern side. Based on recent X-ray observations Maeada et al. (2002) and older radio measurements Jones (1974), Sgr A East is very likely the remnant of a massive star which exploded about 10.000 years ago (SNR 000.0+00.0). An overabundance of heavy elements is found, favouring a SN type II explosion of a 13-20 star. The X-ray emitting region of the remnant appears more compact (2 pc radius) then at radio wavelengths (6-9 pc), and is caused by the reverse shock that heats plasma in the inner parts of the remnant.
Observations in the near-infrared (NIR, e.g. Eisenhauer et al. (2005)) have been taken to precisely measure the orbits of young stars in the direct (as close as 0.1”) vicinity of Sgr A∗. From these, the distance of the solar system to the Galactic Centre, kpc, and the mass of the central compact object, , can be inferred Eisenhauer et al. (2005). The orbits are consistent with Keplarian motion around a point mass centred on Sgr A∗. Furthermore, VLBA measurements put constraining limits on the proper motion of Sgr A∗, requiring an enclosed mass of at least Reid and Brunthaler (2004). At a wavelength of 7 mm, VLBI observations have resolved the size of the radio emission region to Schwarzschild radii Bower et al. (2004). Combining these findings, there is not much doubt that Sgr A∗ can only be a supermassive black hole (SMBH, see, e.g., Genzel and Karas (2007); Melia (2007) for recent reviews). Its energy spectrum in the millimeter to IR domain is characterised by a hard power-law with spectral index , a turn-over at about 1 GHz, followed by a cutoff at about GHz Zylka et al. (1995), explained as synchrotron radiation of relativistic electrons (see e.g. Duschl and Lesch (1994); Melia et al. (2000)).
While being relatively bright at radio frequencies, Sgr A∗ is only a faint X-ray source Skinner et al. (1987), but shows bright outbursts on time scales of a few minutes to several hours (see e.g. Baganoff et al. (2001); Porquet et al. (2003a)). These short flare durations limit the emission region to less than 10 Schwarzschild radii of the black hole, where non-thermal processes near the event horizon might produce relativistic electrons (e.g. Markoff et al. (2001); Aharonian and Neronov (2005); Liu et al. (2006a)). Such models to a certain extend predict flares in the NIR band. Such flares have been observed Genzel et al. (2003), but occur much more frequently than at X-ray energies. In contrast to this, INTEGRAL observations in the hard X-ray/soft -ray band show a faint, but steady emission from the direction of the GC Bélanger et al. (2006).
In 1998, observations with the EGRET instrument onboard the Compton Gamma-Ray Observatory provided a strong excess (3EG J1746-2851) of MeV -rays on top of the expected Galactic diffuse emission. Within an error circle of , the position of this excess is compatible with the position of Sgr A∗. However, although not completely ruled out, the extension of the excess fits better a picture where the emission is produced by several distributed objects or diffuse interactions rather than by a single compact object like Sgr A∗. Moreover, the energy output of 3EG J1746 in the MeV-GeV range ( erg s-1) exceeds by at least an order of magnitude the energy released close to Sgr A∗ at any other wavelength. In any case, due to the relatively poor angular resolution of EGRET, source confusion hampers the interpretation of the signal especially at low energies, where the EGRET point spread function is worst. A follow-up analysis of the position of 3EG J1746, using only events with energies GeV, disfavours its association with Sgr A∗ at the 99.9% CL Hooper and Dingus (2002).
It has been argued that 3EG J1746 may be associated to the SNR Sgr A East, since its -ray spectrum is similar to other SNRs detected by EGRET. One caveat is, however, that the -ray luminosity of 3EG J1746 is two orders of magnitude larger than what is found for other EGRET SNRs. Fatuzzo et al. Fatuzzo and Melia (2003), however, convincingly explain the high energy ( MeV) -ray emission from the source as being produced in inelastic collisions of shock-accelerated protons with the ambient medium, self-constitently accounting for the MeV and radio emission by bremsstrahlung processes and synchrotron emission, respectively, of electrons produced as secondaries in the decay of charged pions (via muon decay).
2 Discovery of the GC in VHE -rays
The recent detection of VHE -rays from the direction of the Galactic Centre by several Imaging Atmospheric Cherenkov Telescopes (IACTs) Tsuchiya et al. (2004); Kosack et al. (2004); Aharonian et al. (2004); Albert et al. (2006) has firmly established the existence of particle acceleration to multi-TeV energies within the central few pc of our galaxy. Prior attempts to detect VHE -rays from this region with the HEGRA stereoscopic system were not successful, and a weak flux upper limit of 8.7 times the flux of the Crab nebula above 4.5 TeV was reported F. A. Aharonian et al. (2002).
In 2004, the discovery of a VHE -ray signal from the direction of the GC was almost simultaneously reported by the CANGAROO-II Tsuchiya et al. (2004) and Whipple Kosack et al. (2004) collaborations, with energy thresholds of 250 GeV and 2.8 TeV, respectively. For both analyses the emission regions include the position of Sgr A∗ within the statistical errors, and are compatible with a point-like origin. No hint for flux variability on timescales of months or years is found.
The CANGAROO-II telescope detects the source with a significance of 10 above the background in 67 hours of observations. The differential energy spectrum reported is very steep, Tsuchiya et al. (2004), with a flux normalisation at 1 TeV of about cm-2 s-1 TeV-1.
In 26 hours of large zenith angle observations, Whipple detects the GC with a marginal significance of 3.7 above the background. The integral -ray flux reported is cm-2 s-1 above 2.8 TeV, roughly two orders of magnitude larger than the flux measured by CANGAROO-II at these energies.
The H.E.S.S. telescope array observed the GC region first during the commissioning of the partially incomplete array in June-August 2003. Only two of the four telescopes were operational. During the first phase of measurements (June/July 2003, 4.7 hours observing time) the telescopes were triggered independently, and events were combined using GPS timestamps. For the second observation campaign (July/August 2003, 11.8 hours observing time) a hardware stereo trigger was used, reducing the energy threshold to 165 GeV for this data set. Also H.E.S.S. reports the detection of a point-like VHE -ray source (henceforth called HESS J1745-290) coincident with Sgr A∗. Differential energy spectra have been produced separately for the two data sets, best described by hard power-laws up to the highest energies measured. 49 hours of observations with the completed H.E.S.S. array were carried out in 2004, yielding consistent results. From a power-law fit of the 2004 data, a photon index of and an integral flux above 1 TeV of cm-2 s-1 is obtained Aharonian et al. (2006a). Recent MAGIC observations of HESS J1745-290 at large zenith angles in 2004 and 2005 verify the hard spectrum found by H.E.S.S., with consistent flux levels, and confirm the point-like and non-variable characteristics of the source Albert et al. (2006).
The -ray flux measured by H.E.S.S. and MAGIC is a factor of three lower than that provided by Whipple, and the hard spectral index is in clear contradiction with the CANGAROO-II results. This either makes HESS J1745-290 a rapidly varying -ray source (with the caveat being that none of the experiments detected significant variability in its own data set), or points to some hidden systematics in the analysis. Indeed, in a careful reanalysis of the Whipple data Kosack (2005) the flux level has been corrected, and a differential energy spectrum which matches the H.E.S.S. and MAGIC spectra is obtained. Moreover, observations with the CANGAROO-III array recently yielded a differential energy spectrum consistent with the H.E.S.S. and MAGIC results Mizukami et al. (2008).
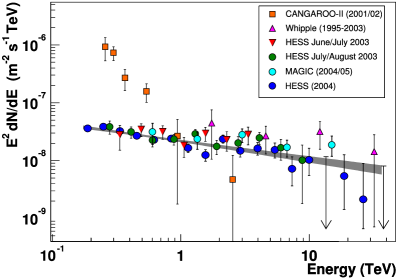
Fig. 2 shows a compilation of the at date available VHE -ray flux measurements from the direction of HESS J1745-290, indicating the recently achieved agreement between the experiments.
3 Today’s VHE -ray view of the Galactic Centre Region
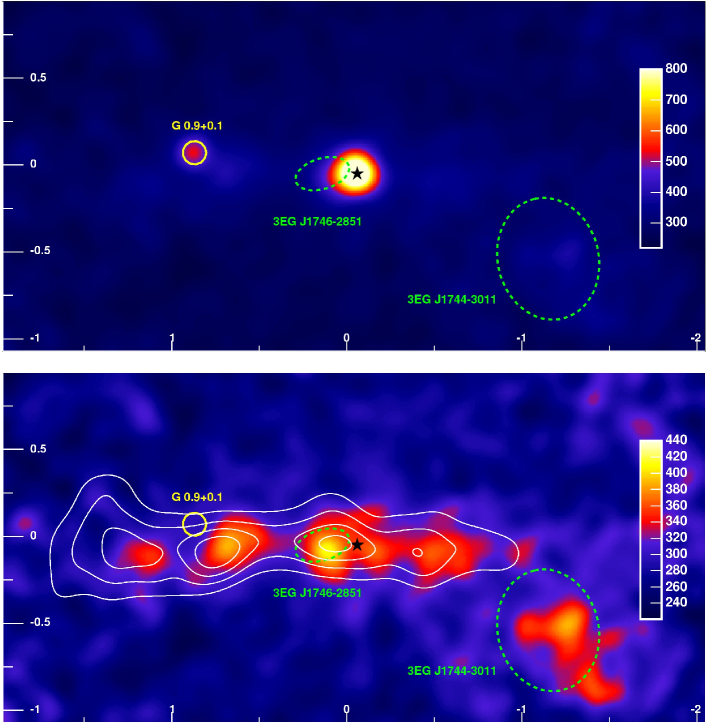
Whilst the first detections of the GC were based on data sets of limited statistics and/or high energy threshold, follow-up observations with the completed H.E.S.S. instrument provide much better sensitivity and deliver the at date most sensitive VHE -ray images of the GC region Aharonian et al. (2006b). Thanks to its large field-of-view H.E.S.S. is able to observe a region of 400 pc diameter (at an assumed distance to the GC of 8 kpc) with a single pointing of the instrument. The so-far published results are based on a deep exposure of GC region with the full H.E.S.S. array in 2004. In 49 hours of quality-selected data, the detection of HESS J1745-290 is confirmed with a high significance of about above the background. In the -ray count map shown in Fig. 3 (top) a second discrete source is visible away from HESS J1745-290, associated with the SNR G 0.9+0.1.
While for previous VHE instruments sources like G 0.9+0.1 were close to the detection limit, the H.E.S.S. data set enables the search for fainter emission. Subtracting the best-fit model for point-like emission from the positions of HESS J1745-290 and G0.9+0.1 yields the sky map shown in the bottom part of Fig. 3. It reveals the presence of diffuse emission along the Galactic Plane Aharonian et al. (2006b), as well as the extended -ray source HESS J1745-303 Aharonian et al. (2006), located about south-west of Sgr A∗. HESS J1745-303 belongs to a rather long list of unidentified Galactic VHE -ray sources, for which the lack of solid couterparts at other wavelengths renders a firm identification difficult so far. A multi-wavelength analysis including VLA, XMM and recent H.E.S.S. data suggests that at least parts of the emission of HESS J1745-303 can be explained by the shock wave of the SNR 359.1-00.5 (Fig. 1) running into a dense molecular cloud and by a pulsar wind nebula driven by the pulsar PSR B1742-30 Aharonian et al. (2008). An association of HESS 1745-303 and 3EG J1744-3011 is difficult both in terms of the energetics and possibly detected variability of the EGRET source.
3.1 G 0.9+0.1: a Pulsar Wind Nebula in VHE -rays
G 0.9+0.1 is a well-known composite SNR with a clear shell-like radio morphology (see Fig. 1). It consists of a radio shell of 8’ diameter and a bright compact core. Given the extension of the shell and assuming a distance of 8 kpc, the supernova took place a few thousand years ago. Although no pulsed emission has been detected from the central core region, X-ray observations Gaensler et al. (2001); Porquet et al. (2003b) have identified it as a pulsar wind nebula (PWN) and also found spectral softening away from the core of the nebula, suggesting an electron population which cools due to synchrotron radiation on its way outwards. No non-thermal X-ray emission has been detected from the SNR shell.
The H.E.S.S. instrument has discovered -ray emission from the direction of G 0.9+0.1 with a significance of 13 after 50 hours of observations Aharonian et al. (2005). The fact that G 0.9+0.1 is not detected by the MAGIC instrument is not in conflict with the H.E.S.S. result, given the lower sensitivity of the MAGIC data set. The morphology of the VHE source is compatible with a point-like excess, and an upper limit on the source size of 1.3’ at 95% CL is derived, excluding particle acceleration in the SNR shell as the main source of the VHE -rays. Instead the centroid of the -ray excess coincides within statistical errors with the Chandra position of the PWN, making a PWN association compelling. The VHE -ray spectrum of G 0.9+0.1 extends from 230 GeV to 6 TeV and is best described by a straight power-law with a photon index of 2.40. The total power radiated in VHE -rays is erg s-1, which can be easily accounted for in a one-zone inverse Compton (IC) model yielding a reasonable magnetic field strength (G) and a photon density of 5.7 eV cm-3 Aharonian et al. (2005), somewhat smaller than the conventional value used in GALPROP.
3.2 HESS J1745-290: a Prime Example of an Unidentified -ray Source
While the nature of the emission from G 0.9+0.1 seems to be fairly settled, this is certainly not true for the VHE emission from HESS J1745-290. Although all IACTs which have observed the source have found it being positionally coincident with the SMBH Sgr A∗, the actual mechanism that produces the emission is still not identified. Besides a couple of different Sgr A∗-related emission mechanisms proposed, there are at least two other objects in direct vicinity of the SMBH which are convincing candidates for producing to observed VHE -ray flux in parts or in combination:
- •
-
•
Annihilation of Dark Matter (DM) particles clustering in a cusp around the SMBH could potentially produce VHE emission Bergström (2000).
-
•
The PWN G359.95-0.04, recently discovered in a deep Chandra exposure Wang et al. (2006), and only 8.7” away from Sgr A∗ in projection, may accelerate electrons to TeV energies.
-
•
Finally, the SNR Sgr A East is a prime candidate counterpart, given its non-thermal radio shell and the fact that SNRs are proven sites of efficient particle acceleration to highest energies.
From the observer’s standpoint, an identification is particularly hampered by the relatively poor angular resolution of current IACT installations which gives rise to source confusion in this region. The point spread function (PSF) of the H.E.S.S. instrument is O(0.1∘), resulting in a relatively large emission region (see Fig. 3). Nevertheless can VHE -ray observations of HESS J1745-290 put constraints on counterparts and emission models in various ways. The most sensitive data set is currently provided by the H.E.S.S. collaboration. Without being in conflict with measurements at longer wavelengths, models must explain the following properties of HESS J1745-290 Aharonian et al. (2006a):
-
•
The centroid of HESS J1745-290 is coincident within with the position of Sgr A∗, and the intrinsic size of the source amounts to less than 1.2’ (95% CL).
-
•
The spectrum measured between 160 GeV and 30 TeV can be characterised by a power-law with photon index . The integral flux above 1 TeV is cm-2 s-1. This implies a -ray luminosity of erg s-1 in the 1-10 TeV range. No hint for curvature is found. Assuming an exponential cutoff, a lower limit of 9 TeV (95% CL) on the cutoff energy is derived.
-
•
There is no hint for significant flux variability on any timescale from minutes to years.
3.2.1 The Case of Sgr A East
The existence of synchrotron radiation, i.e. the presence of relativistic electrons, and a large magnetic field ( mG, determined from Zeeman splitting of OH masers Yusef-Zadeh et al. (1996)) make Sgr A East a compelling candidate for -ray emission at VHE energies. In particular do the observated flux spectra at radio, X-ray, and -ray energies match a scenario in which protons have been shock-accelerated to at least 100 GeV of energy Fatuzzo and Melia (2003) (see above). Adopting a 4 mG magnetic field, Crocker et al. Crocker et al. (2005) estimate the maximum proton energy achievable in the Sgr A East blast wave to be eV. The fact that none of the IACTs reports flux variability from HESS J1745-290 certainly fits into this scenario.
The shell of Sgr A East partially surrounds Sgr A∗ in projection; its emission maximum in 90 cm radio is 1.5’ (or about 3.5 pc) away from Sgr A∗. Due to the systematic error of 28” on the position of the HESS J1745-290 centroid from uncertainties in the absolute pointing of the H.E.S.S. telescopes, the position of the VHE emission is marginally consistent with the Sgr A East radio maximum.
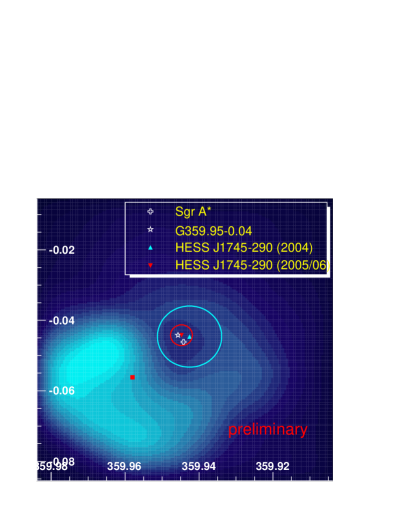
Recent progress (although subject to final checks, van Eldik et al. (2007)) in understanding and compensating the pointing systematics of the H.E.S.S. array has led to a reduced systematic error of 8.5” van Eldik et al. (2007). Fig. 4 shows the improved H.E.S.S. position measurement, based on 73 hours of observations, on top of a 90 cm VLA radio image of Sgr A East. The best fit position is coincident within with Sgr A∗ and effectively rules out Sgr A East as the dominant source of the VHE emission.
3.2.2 HESS J1745-290: a Pulsar Wind Nebula?
The recent detection of the PWN G359.95-0.04 in a deep Chandra exposure of the GC region Wang et al. (2006) very much complicates the counterpart search for HESS J1745-290. G359.95-0.04 is located only in projection (or 0.3 pc) away from Sgr A∗, rendering a discrimination of the two by position measurements impossible (cf. Fig. 4). G359.95-0.04 is rather faint at X-ray energies, with an implied luminosity of erg s-1 in the 2-10 keV band Wang et al. (2006), yet about four times brighter than Sgr A∗. It shows a cometary shape and exhibits a hard and non-thermal spectrum which gradually softens when going away from the “head” of the PWN, where the yet undiscovered pulsar is believed to be located. No radio counterpart of the PWN is found.
Numerical calculations show that, despite its faint X-ray flux, a population of non-thermal electrons can naturally explain both the X-ray emission of G359.95-0.04 and the VHE -ray emission of HESS J1745-290 Hinton and Aharonian (2007). Compared to other locations in the galactic disk, where many VHE -ray sources have been found associated to PWNe, the Galactic Centre region is, however, special because of its dense radiation fields. The fact that the X-ray spectra steepen rather than harden the further one gets away from the pulsar position is an indication that the TeV electrons are cooled by synchrotron radiation rather than by IC processes in the Klein-Nishina regime, putting a lower limit of on the value of the magnetic field for typical Galactic Centre radiation fields Hinton and Aharonian (2007). It is predominantly the far-IR component of the radiation field that TeV electrons upscatter to TeV energies, providing roughly an order of magnitude larger luminosity in the 1-10 TeV -ray band than in the 2-10 keV X-ray domain.
3.2.3 Emission models involving Sgr A∗
The low bolometric luminosity ( in the range from millimeter to optical wavelenghts) renders Sgr A∗ an unusually quiet representative of galactic nuclei. At the same time, this property makes the immediate vicinity of the SMBH transparent for VHE -rays. Aharonian & Neronov Aharonian and Neronov (2005) show that the absence of dense IR radiation fields enables photons with an energy of up to several TeV to escape almost unabsorbed from regions as close as several Schwarzschild radii from the centre of the SMBH. Therefore, VHE -ray emission produced close to the event horizon of Sgr A∗ provides a unique opportunity to study particle acceleration and radiation in the vicinity of a black hole.
There are several possibilities to produce the observed VHE -ray flux, depending on the type of particles accelerated, the model of acceleration, and finally the interaction of the accelerated particles with the ambient magnetic field or matter. Common scenarios, which do not contradict the emission at longer wavelenghts, include Aharonian and Neronov (2005):
-
•
Synchrotron radiation of ultra-relativistic protons. In the strongly magnetised environment of a SMBH with magnetic field strengths as large as G, protons can be accelerated to energies of up to eV. However, the synchrotron spectrum extends only to roughly 300 GeV, and thus cannot account for the multi-TeV radiation seen by H.E.S.S.. Curvature radiation of protons can in principle extend the -ray spectrum 10 TeV, but only at the expense of very large magnetic fields ( G), for which the source is opaque for -rays due to pair production.
-
•
Photo-Meson interactions. Despite its low bolometric luminosity, the IR radiation fields in the vicinity of Sgr A∗ appear dense enough to produce a sizable number of VHE -rays in the interactions of the accelerated protons with IR photons. The required power to meet the luminosity in VHE -rays is erg s-1, well below the Eddington luminosity of a BH.
-
•
Proton-Proton interactions. VHE -ray production by interactions of accelerated protons with the ambient plasma requires an acceleration power of erg s-1, but at the same time only eV protons are required to produce TeV radiation. In this case, possible acceleration sites include a strong electric field close to the event horizon or strong shocks in the accretion disk. This scenario in particular predicts correlated flux variability at VHE, X-ray, and IR wavelengths.
-
•
Inverse Compton radiation of electrons. Compared to the aforementioned proton scenarios, electrons provide a much more efficient way to convert energy into radiation. To accelerate electrons to multi-TeV energies, however, a well-ordered magnetic or electric field is necessary to prevent radiation losses during acceleration. Such properties are e.g. provided by the rotation-induced electric fields near the black hole. -rays at the highest energies ( TeV), however, cannot escape the source because of efficient interaction with the IR radiation field, but contribute to the spectrum with sub-100 TeV photons.
While some of the above mentioned scenarios suggest correlated multi-wavelength variability, non-observation of variability does not striktly rule out acceleration close to the black hole. Moreover, there are models which explain the absence of VHE variability by diffusion of protons away from the acceleration region into the neighbourhood of Sgr A∗ and subsequent interaction with the ambient medium Liu et al. (2006b, a). On the other hand, the detection of variability in the VHE data would immediately point to particle acceleration near the SMBH. The most convincing signature would be the detection of correlated flaring in X-rays (or NIR) and VHE -rays. Such searches have been carried out Vivier et al. (2007); Hinton et al. (2007). No evidence of flaring or quasi-periodic oscillations has been found. In particular, in a coordinated multi-wavelength campaign both Chandra and H.E.S.S. observed the GC region, when a major (factor 9 increase) X-ray outburst was detected. During this 13-minutes flare the VHE -ray flux stayed constant within errors, and a 99% CL upper limit on a doubling of the VHE flux is derived Hinton et al. (2007).
3.2.4 Dark Matter Annihilation near the GC?
Besides being of astrophysical origin, the observed TeV flux could potentially stem from annihilation of dark-matter particles, which are believed to cluster in a compact cusp around Sgr A* Bergström (2000). Halo density profiles are believed to scale with the radius like , with between 1 Navarro et al. (1997) and 1.5 Moore et al. (1999) in the most common models. The fact that HESS J1745-290 is point-like (after having accounted for the underlying diffuse emission) translates into , i.e. a cuspy halo is favoured by the observations.
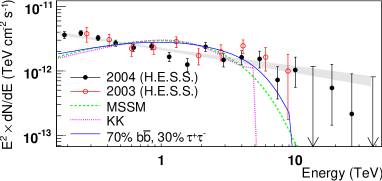
Predicted energy spectra for -rays produced in cascade decays of DM particles such as MSSM neutralinos or Kaluza-Klein particles can be compared to the VHE observations. These spectra are usually curved both at high energies – for reasons of energy conservation –, and low energies, in clear disagreement with the observations (Fig. 5, see also Aharonian et al. (2006a)). Furthermore, unusually large DM particle masses have to be assumed to account for the fact that the -ray spectrum extends up to 10 TeV.
The observed -ray emission is therefore not compatible with being dominantly produced in the framework of the most common DM scenarios. As a consequence, the bulk of the observed -ray excess is probably of astro- rather than of particle physics origin. However, an O(10%) admixture of -rays from DM annihilations in the signal from the GC cannot be ruled out. Assuming a NFW-type Navarro et al. (1997) halo profile, 99% CL upper limits on the velocity-weighted annihilation cross section are at least two orders of magnitude above theoretical expectations Aharonian et al. (2006a), and thus are not able to put constraints on current model predictions.
3.3 Diffuse -ray Emission
The diffuse emission (Fig. 3 bottom) spans in a region of roughly in galactic longitude () with an rms width of about in galactic latitude (). The reconstructed -ray spectrum integrated within and is well-described by a power law with photon index Aharonian et al. (2006b), in agreement with the index observed for HESS J1745-290. Assuming that the emission is produced in the Galactic Centre region at 8 kpc distance from the observer, the latitude extension translates into a scale of about 30 pc. This is very similar to the extent of giant molecular clouds in this region Tsuboi et al. (1999). Indeed, at least for , there is a strong correlation between the morphology of the observed -rays and the density of molecular clouds as traced by the CS emission observed with NRO (Tsuboi et al. (1999), Fig. 3 bottom). This is the first time such correlation is seen, and is a strong indication for the presence of an accelerator of (hadronic) cosmic rays in the Galactic Centre region, since the energetic hadrons would interact with the material in the clouds, giving rise to the observed -ray flux via decays. The idea of acceleration in the GC region is further supported by the fact that the measured -ray flux is both larger and harder than expected in a scenario where the molecular material is bathened in a sea of galactic cosmic rays, with similar properties as measured in our solar neighbourhood, only. The energy necessary to fill the entire region with cosmic rays can be estimated from the measured -ray flux (extrapolated to 1 GeV) and amounts to erg. This number is close to the energy believed to be transferred into cosmic rays in a typical galactic supernova. A distribution of electron accelerators, such as PWNe, that cluster similarly to the gas distribution, has also been discussed (e.g. Aharonian et al. (2006b)). Given the O(100G) magnetic fields in the region, electrons of several TeV energy would, however, rapidly cool via synchrotron radiation, such that their VHE -ray emission would appear point-like in the H.E.S.S. data.
In the context of identifying the accelerator, the fact that no emission is seen farther than might be particularly important. In their discovery paper Aharonian et al. (2006b), the H.E.S.S. collaboration came up with the rather simple, yet convincing explanation that the cosmic rays may have been accelerated in a rather young source near the very centre of the galaxy, having subsequently undergone diffusion away from the accelerator into the surrounding medium. Assuming a typical diffusion coefficient of cm2 s-1, or 3 kpc2 Myr-1, for TeV protons in the Galactic disk, a source age of about years can reproduce the observed -ray flux distribution Aharonian et al. (2006b), and in particular the lack of emission beyond distance from the centre.
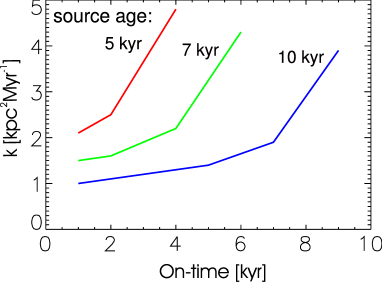
Büsching et al. Büsching et al. (2007) follow a similar idea. Starting from a source of non-thermal protons at the GC and the known distribution of molecular material, the authors model the -ray flux from the region in a time dependent diffusion picture. Neglecting a possible energy dependence of the diffusion process (suggested by the fact that the H.E.S.S. data are not sensitive enough yet to measure such an effect), they use minimisation to find the diffusion coefficient for which the H.E.S.S. results are matched best, for a variety of source ages and source on-times (Fig. 6), resulting in diffusion coefficients in the range of the one assumed in Aharonian et al. (2006b). In a similar approach, Dimitrakoudis et al. Dimitrakoudis et al. (2008) obtain a best-fit diffusion coefficient of 3 kpc Myr-1, also close to Aharonian et al. (2006b). Scaling the diffusion coefficient with the cosmic ray rigidity , , GV, Büsching et al. find a value of which is significantly smaller than the local value, suggesting enhanced turbulence and larger magnetic fields than in the solar neighbourhood. Uncertainties in the derived diffusion coefficients of up to 50% arise from uncertainties in the molecular gas distribution and from the contribution of galactic cosmic rays to the overall -ray flux.
In a separate paper Büsching and de Jager (2008), Büsching et al. explain both the diffuse emission and the point-source HESS J1745-290 within a single model in which the cosmic rays responsible for the diffuse emission were accelerated in the shock wave of the SNR Sgr A East 5-10 kyr ago, but acceleration stopped well before the present time. When, however, the shock wave of Sgr A East collided with Sgr A∗, particle acceleration near the SMBH was initiated, leading to the observed VHE -ray emission from HESS J1745-290. Assuming that the diffusion coefficient found for the diffuse emission is also valid close to the SMBH, this last round of particle acceleration can only have happened in the recent past (O(100) yr) to be consistent with the point-like morphology of HESS J1745-290.
It should, however, be noted that there are other processes which can explain the emission from HESS J1745-290 (see above). Furthermore, recent simulations seem to indicate that the diffuse emission might be better explained by inter-cloud acceleration of cosmic rays via the Fermi-II process Wommer et al. (2008). More sensitive observations are needed to ultimately prove which of the discussed scenarios of the VHE -ray view of the GC is correct.
4 The Role of CTA
Despite the exciting progress in recent years, a robust understanding of the GC VHE -ray sky needs a more refined data set than currently available. Significant progress in the identification of the VHE sources and the physics processes involved requires an instrument with better sensitivity, wider energy coverage, and, possibly, improved angular resolution. Probing the GC region with instruments like CTA Hermann et al. (2007) or AGIS will answer many of the open questions within a reasonable amount of observing time.
For the following order-of-magnitude estimations we assume a CTA-like array of IACTs with a core sensitivity of O(1 mCrab), 4 orders of magnitude energy coverage (10 GeV – 100 TeV), and an angular resolution of 0.02∘ per event.
4.1 Angular resolution
As discussed above, one way of identifying HESS J1745-290 is to search for plausible candidate counterparts within the error circle of the emission centroid. Since the GC is a densely packed region, naively, a good angular resolution is important. Since the statistical error of the centroid position scales like , and therefore linearly with sensitivity, a factor of 50 improvement in the statistical error of the centroid position over H.E.S.S. (about 6” per axis for 73 hours of exposure, van Eldik et al. (2007)) is expected. On the other hand, the systematic pointing error of the H.E.S.S. telescopes is about 6” per axis van Eldik et al. (2007), probably close to the limit of what can be achieved with future instruments. In the special case of HESS J1745-290, subtracting the underlying (asymmetric) diffuse emission imposes additional systematic uncertainties, which for H.E.S.S. are of the order of 1”. As a consequence, improved angular resolution is not of much help what regards a measurement of HESS J1745-290’s position.
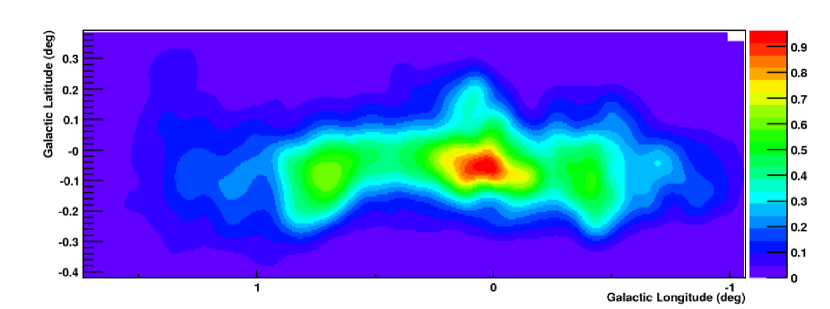
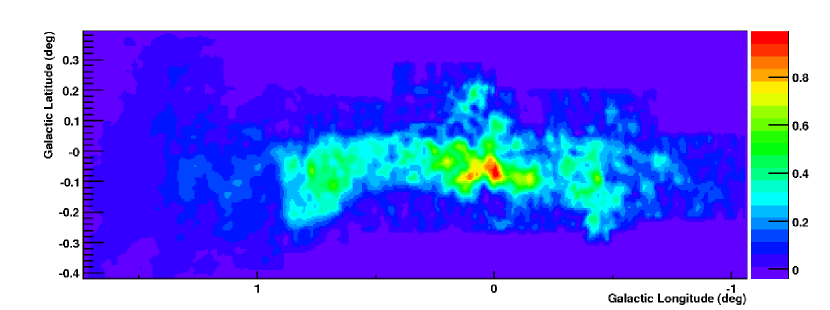
On the other hand, superior angular resolution would help in understanding the properties of the diffuse emission. It would allow to probe the region with a few pc binning and test the -ray-cloud correlation in much more detail than currently possible. Fig. 7 sketches the improvement in angular resolution over H.E.S.S. for a CTA-like instrument with an angular resolution of per reconstructed -ray. Shown are -ray maps expected from cosmic rays interacing with the molecular material in the GC region. The cosmic rays diffuse away from the Galactic Centre, their assumed origin of production. The improvement in the quality of the data is clearly visible. With such an improvement one might in the not too distant future also get a handle on the possible existence of electron accelerators along the Galactic Plane, which might or might not be responsible for the observed -ray emission in parts or in total.
4.2 Sensitivity
An unambiguous proof that the VHE -ray emission from HESS J1745-290 is associated with Sgr A∗ would be the observation of correlated -ray/X-ray (or IR) variability. With the assumed CTA sensitivity similar X-ray flare events like the one discussed above (factor 9 increase over the quiescent level) would test a level as low as 10% of the quiescent state -ray flux.
To test models of cosmic ray/electron propagation through the central region of the galaxy and to study the penetration of molecular clouds by cosmic rays, energy spectra have to be provided of the diffuse -ray emission in small regions of a few pc a few pc only. With these at hand, energy-dependent diffusion processes could be studied in great detail. For a simple power-law fit, the statistical error on the spectral index scales linearly with sensitivity. Therefore, because of its enhanced sensitivity, a spectrum measured by CTA in a portion of the sky (in the H.E.S.S. energy range) will reach comparable statistical accuracy in the spectral index as H.E.S.S. does in a sky area (e.g. for 50 hours of observations of the GC diffuse emission Aharonian et al. (2006b)).
4.3 Energy coverage
The energy spectrum of HESS J1745-290 covers an energy range of 160 GeV – 30 TeV and is well fitted by a straight powerlaw (see above). For the most likely counterparts of the VHE emission, Sgr A∗ and G359.95-0.04, emission models fitting the combined spectral energy distributions have been presented by various authors (e.g. Hinton and Aharonian (2007), Aharonian and Neronov (2005), among others). While most models can satisfactorily fit the H.E.S.S. data points, they do substantially differ at energies GeV. CTA energy coverage down to 10 GeV would constrain some of the models, and therefore help to identify the source of the -rays and the underlying physical acceleration and radiation processes.
5 Conclusions
Less than five years after the discovery of VHE -ray emission from the direction of the GC, observations with Imaging Atmospheric Cherenkov Telescopes provide a very sensitive view of this interesting region. With the recent data from the H.E.S.S. instrument, a rich VHE -ray morphology becomes evident, giving strong evidence for the existence of a cosmic ray accelerator within the central 10 pc of the Milky Way.
An intense -ray point source is found coincident within errors with the position of Sgr A∗. Source confusion near the GC make a solid identification difficult, given the – compared to X-ray satellites or IR observatories – moderate angular resolution of current IACTs. Recent progress in improving on the systematic and statical errors of the centroid of HESS J1745-290 effectively excludes the SNR Sgr A East as the dominant source of the -ray emission. A major contribution from the annihilation of DM particles can also be excluded.
Future observations with even more sensitive instruments such as CTA will significantly advance our knowledge about the GC region at VHE energies. The recently launched Fermi satellite will extend the energy range down to about 100 MeV, such that unbroken sensitivity coverage will be provided over 6 orders of magnitude in energy.
References
- Balick and Brown (1974) B. Balick, and R. Brown, Astrophys. J.. 194, 265 (1974).
- LaRosa et al. (2000) T. LaRosa, et al., Astron. J. 119, 207–240 (2000).
- Yusef-Zadeh et al. (1984) F. Yusef-Zadeh, M. Morris, and D. Chance, Nature 310, 557 (1984).
- Bania (1977) T. M. Bania, Astrophys. J. 216, 381–403 (1977).
- Liszt et al. (1977) H. S. Liszt, et al., Astrophys. J. 213, 38–42 (1977).
- Tsuboi et al. (1999) M. Tsuboi, et al., Astrophys. J. Suppl. 120, 1–39 (1999).
- Maeada et al. (2002) Y. Maeada, et al., Astrophys. J. 570, 671–687 (2002).
- Jones (1974) T. W. Jones, Astron. Astrophys. 30, 37 (1974).
- Eisenhauer et al. (2005) F. Eisenhauer, et al., Astrophys. J. 628, 246–259 (2005).
- Reid and Brunthaler (2004) M. J. Reid, and A. Brunthaler, Astrophys. J. 616, 872–884 (2004).
- Bower et al. (2004) G. C. Bower, et al., Science 304, 704–708 (2004).
- Genzel and Karas (2007) R. Genzel, and V. Karas, To appear in Proc. Black Holes: from Stars to Galaxies (2007), arXiv:0704.1281.
- Melia (2007) F. Melia, Princeton University Press (2007).
- Zylka et al. (1995) R. Zylka, et al., Astron. Astrophys. 297, 83–97 (1995).
- Duschl and Lesch (1994) W. J. Duschl, and H. Lesch, Astron. Astrophys. 286, 431–436 (1994).
- Melia et al. (2000) F. Melia, S. Liu, and R. Coker, Astrophys. J. 545, L117–L120 (2000).
- Skinner et al. (1987) G. K. Skinner, et al., Nature 330, 544–547 (1987).
- Baganoff et al. (2001) F. K. Baganoff, et al., Nature 413, 45–48 (2001).
- Porquet et al. (2003a) D. Porquet, et al., Astron. Astrophys. 407, L17–L20 (2003a).
- Markoff et al. (2001) S. Markoff, et al., Astron. Astrophys. 379, L13–L16 (2001).
- Aharonian and Neronov (2005) F. Aharonian, and A. Neronov, Astrophys. J. 619, 306–313 (2005).
- Liu et al. (2006a) S. Liu, F. Melia, and V. Petrosian, Astrophys. J. 636, 798–803 (2006a).
- Genzel et al. (2003) R. Genzel, et al., Nature 425, 934–937 (2003).
- Bélanger et al. (2006) G. Bélanger, et al., Astrophys. J. 636, 275–289 (2006).
- Hooper and Dingus (2002) D. Hooper, and B. Dingus, ArXiv Astrophysics e-prints (2002), arXiv:astro-ph/0212509.
- Fatuzzo and Melia (2003) M. Fatuzzo, and F. Melia, Astrophys. J. 596, 1035–1043 (2003).
- Tsuchiya et al. (2004) K. Tsuchiya, et al., Astrophys. J. 606, L115–L118 (2004).
- Kosack et al. (2004) K. Kosack, et al., Astrophys. J. 608, L97–L100 (2004).
- Aharonian et al. (2004) F. Aharonian, et al., Astron. Astrophys. 425, L13–L17 (2004).
- Albert et al. (2006) J. Albert, et al., Astrophys. J. 638, L101–L104 (2006).
- F. A. Aharonian et al. (2002) F. A. Aharonian, et al., Astron. Astrophys. 395, 803–811 (2002).
- Aharonian et al. (2006a) F. Aharonian, et al., Phys. Rev. Lett. 97, 221102 (2006a).
- Kosack (2005) K. P. Kosack, Very high energy gamma rays from the Galactic Center, Ph.D. thesis, Washington University, United States – Missouri (2005).
- Mizukami et al. (2008) T. Mizukami, et al., this conference (2008).
- Aharonian et al. (2006b) F. Aharonian, et al., Nature 439, 695–698 (2006b).
- Aharonian et al. (2006) F. Aharonian, et al., Astrophys. J. 636, 777–797 (2006).
- Aharonian et al. (2008) F. Aharonian, et al., Astron. Astrophys. 483, 509–517 (2008).
- Gaensler et al. (2001) B. M. Gaensler, M. J. Pivovaroff, and G. P. Garmire, Astrophys. J. 556, L107–L111 (2001).
- Porquet et al. (2003b) D. Porquet, A. Decourchelle, and R. S. Warwick, Astron. Astrophys. 401, 197–203 (2003b).
- Aharonian et al. (2005) F. Aharonian, et al., Astron. Astrophys. 432, L25–L29 (2005).
- Atoyan and Dermer (2004) A. Atoyan, and C. D. Dermer, Astrophys. J. 617, L123–L126 (2004).
- Bergström (2000) L. Bergström, Rep. Progr. Phys. 63, 793–841 (2000).
- Wang et al. (2006) Q. D. Wang, F. J. Lu, and E. V. Gotthelf, Mon. Not. Roy. Astron. Soc. 367, 937–944 (2006).
- Yusef-Zadeh et al. (1996) F. Yusef-Zadeh, et al., Astrophys. J. 466, L25+ (1996).
- Crocker et al. (2005) R. M. Crocker, et al., Astrophys. J. 622, 892–909 (2005).
- van Eldik et al. (2007) C. van Eldik, et al., Proc. 30th ICRC (Merida) (2007), arXiv:0709.3729.
- Hinton and Aharonian (2007) J. A. Hinton, and F. A. Aharonian, Astrophys. J. 657, 302–307 (2007).
- Liu et al. (2006b) S. Liu, et al., Astrophys. J. 647, 1099–1105 (2006b).
- Vivier et al. (2007) M. Vivier, et al., Proc. 30th ICRC (Merida) (2007).
- Hinton et al. (2007) J. Hinton, et al., Proc. 30th ICRC (Merida) (2007).
- Navarro et al. (1997) J. F. Navarro, C. S. Frenk, and S. D. M. White, Astrophys. J. 490, 493 (1997).
- Moore et al. (1999) B. Moore, et al., Mon. Not. R. Astron. Soc. 310, 1147–1152 (1999).
- Büsching et al. (2007) I. Büsching, O. C. de Jager, and J. Snyman, Astrophys. J. 656, 841–846 (2007).
- Dimitrakoudis et al. (2008) S. Dimitrakoudis, A. Mastichiadis, and A. Geranios, Proc. 30th ICRC (Merida) (2008).
- Büsching and de Jager (2008) I. Büsching, and O. C. de Jager, Adv. Space Res. 42, 491–496 (2008).
- Wommer et al. (2008) E. Wommer, F. Melia, and M. Fatuzzo, Mon. Not. R. Astron. Soc. 387, 987–997 (2008).
- Hermann et al. (2007) G. Hermann, et al., ArXiv e-prints (2007), 0709.2048.