A parameter study of self-consistent disk models around Herbig AeBe stars
We present a parameter study of self-consistent models of protoplanetary disks around Herbig AeBe stars. We use the code developed by Dullemond and Dominik, which solves the 2D radiative transfer problem including an iteration for the vertical hydrostatic structure of the disk. This grid of models will be used for several studies on disk emission and mineralogy in followup papers. In this paper we take a first look on the new models, compare them with previous modeling attempts and focus on the effects of various parameters on the overall structure of the SED that leads to the classification of Herbig AeBe stars into two groups , with a flaring (group I) or self-shadowed (group II) SED. We find that the parameter of overriding importance to the SED is the total mass in grains smaller than 25, confirming the earlier results by Dullemond and Dominik. All other parameters studied have only minor influences, and will alter the SED type only in borderline cases. We find that there is no natural dichotomy between group I and II. From a modeling point of view, the transition is a continuous function of the small dust mass. We also show that moderate grain growth produces spectra with weak or no 10 feature, both for flaring (Group I) and non-flaring (Group II) sources. The fact that sources with weak features have been found mostly in Group I sources is therefore surprising and must be due to observational biases or evolutionary effects.
Key Words.:
Dust – Circumstellar Disks – circumstellar matter – infrared: stars
1 Introduction
Herbig Ae/Be stars are young, intermediate-mass stars surrounded by circumstellar disks (see e.g. Waters & Waelkens (1998) or Natta et al. (2000) for a review). Solid-state material makes up about a percent of the disk mass, and can be studied in the thermal infrared. These studies indicate that the grains must have experienced both growth and thermal processing, since their spectra differ substantially from that of interstellar dust (Bouwman et al. 2001; van Boekel et al. 2003, 2005). It is expected that this growth may lead ultimately to the formation of planets. The infrared spectra of Herbig stars can be divided into two groups (Meeus et al. 2001). Though approximately similar in the near-IR, the far-IR flux of some is relatively strong (those of Group I) compared with that of others (Group II). This spectral difference is believed to reflect the overall shape of the disk. Group I sources have a geometrically flaring outer disk, which absorbs direct stellar light that is thenre-radiated at far-IR wavelengths. Group II sources have a flat geometry, which reprocesses far less stellar radiation in the outer disk. Many sources exhibit 10 micron silicate emission (these are labeled , so either Ia or IIa). Some sources lack this emission (these are denoted Ib or IIb), possibly reflecting that the bulk of the observable warm silicate grains in these sources have sizes larger than several microns.
The general shape of the SED of Herbig stars has been a subject of study for a considerable time and is now believed to be quite well understood. The latest addition to this understanding was the realization that the prominent emission close to 3, interpreted in earlier models interpreted as originating in accretion luminosity (e.g. Hillenbrand et al. 1992), is due to a puffed-up inner rim of the disk. This rim is formed at a location given by the dust-evaporation temperature. Inside the rim, the disk does not contain any dust and is mostly transparent (optically thin) to the incident stellar light. The rim itself can absorb up to 25% of the stellar radiation (Natta et al. 2001). This idea was incorporated into a more detailed physical model by Dullemond et al. (2001), who showed that this inner rim can indeed resolve the discrepancy between observations and previous models in the wavelength region around 3, with a self-consistent disk model. An important question is if this conclusion still holds in more complex models.
Dullemond (2002) and Dullemond & Dominik (2004, hereafter DD04) developed far more sophisticated models including full 2D radiative transfer, coupled with self-consistent vertical structure calculations. These models confirmed that a self-consistent approach can explain many of the observed features of Herbig Ae SEDs. They demonstrated that the disk structure is closely linked to the properties and spatial distribution of the dust grains. Although the vertical extent of the disk is supported by gas pressure, the energy that heats the gas is obtained from the grains by dust-gas interactions (see Kamp & Dullemond (2004) for details). The spatial distribution of dust opacity that absorbs stellar light must therefore control, to a large extent, the geometrical shape of proto-planetary disks. Since this opacity is provided mostly by grains smaller than about 25 – that have large mass-extinction coefficients – this grain population is the mainly relevant one. Using this principle, DD04 performed a pilot study in which they showed that by increasing the total mass of the small grain component, one can alter the overall appearance of the spectral energy distribution from one qualitatively characteristic of Group II into Group I, and that this corresponds to either a non-flaring vs. a flaring geometry. A change in the geometry could also be achieved by a very steep power law in the surface density, which in effect concentrates most of the disk mass in the inner rim, leaving the outer disk with very low mass and, consequently, opacity.
This paper is the first in a series where we explore these new models in greater detail, building on the work of DD04. In this first paper, we focus on the general appearance of the disk spectra, and how it depends upon the various parameters entering the calculation. We present an extended parameter study of dust and disk properties of HAeBe star with the aim of better quantifying and understanding the cause of the Group I/II dichotomy more robustly as well as the presence or absence of the 10 feature. We do not consider the detailed shape of the 10 feature - mineralogical studies will be presented in further papers in this series.
The model parameters that we address are – in addition to total disk mass and radial surface density gradient – disk size and inclination, some basic aspects of grain composition, and the grain-size distribution. To allow for a quantitative comparison between observations and models, we present the results in terms of a color-flux ratio comparison, first introduced by van Boekel et al. (2003, hereafter BWD03) to distinguish between Group I and Group II sources. We then first study the SED of selected models directly, and later turn to a special color-color diagram in which we are able to display the results of the full parameter study.
In Sect. 2, we describe the model assumptions, take a first look at the resulting SEDs, and present the basic model grid. In Sect. 3, we show the SEDs for a selected subset of our parameter study. In Sect. 4, we describe the system to quantify the SED structure using a color-color diagram, and discuss in detail the parameter dependences of the model. We discuss some of the results in Sect. 5 and present our conclusions in Sect. 6.
2 Model setup
2.1 The DD04 code
To model the proto-planetary disks of Herbig systems, we used the code developed by Dullemond (2002) and Dullemond & Dominik (2004) in which 2-D radiative transfer is solved subject to the constraint of radiative equilibrium and vertical hydrostatic equilibrium for a passive disk (i.e. one in which the only source of energy is irradiation by the central star) for which the surface density structure is described by a power law.
The code uses a spherical coordinate system with the assumption of cylindrical symmetry (i.e. all derivatives with respect to the azimuthal angel vanish). The model consists of two parts: a 2D radiative transfer code (RADICAL/RADMC) and a 1D vertical hydrostatic equilibrium code. The radiative transfer code calculates the dust temperature from the spatial distribution of the dust, and the dust opacity. The vertical hydrostatic equilibrium code calculates the dust density from the dust temperature and vertical hydrostatic equilibrium. These two codes are applied alternately to an initial guess for the dust density distribution until convergence is reached. For details of the method we refer to the references given above.
No scattering is currently considered by the models. Since at optical wavelengths the scattering opacity for silicate grains (thought to be a dominant dust species in proto-planetary disks) is approximately a factor of a few larger than the absorption opacity (and is about equal to it at near-IR wavelengths) one may expect that this may affect the disk geometry and emerging spectral energy distribution. Dullemond & Natta (2003) investigated this effect and concluded that because scattering reflects part of the stellar light away from the disk before it becomes thermalized, the disk becomes cooler at all vertical heights. However, the vertical surface height – defined to be the surface at which the stellar light is intercepted – will increase, simply because of the added (scattering) opacity component. The effect on the SED is that in the near- and mid-IR the flux may reduce by tens of percents, while at millimeter wavelength the reduction is a few percent at most. We conclude that neglecting the effects of scattering may cause a modest (systematic) effect on the disk structure and spectral appearance inferred, and therefore on the exact location of the Group I/II boundary. However, it does not affect selectively either Group I or II, and will therefore not affect any conclusions regarding the cause of the Group I/II dichotomy itself.
2.2 Modifications for the present study
The following modifications to the original code have been implemented for the computations presented in this paper:
2.2.1 Grain properties
In the pilot study by DD04, the grain population was assumed to consist only of silicate particles with a radius . Here, we account for both silicate (Laor & Draine 1993) and carbon (Preibisch et al. 1993) grains that may range in size from a minimum value to a maximum value according to
| (1) |
We adopt , which is representative of interstellar grains (Mathis et al. 1977). This power-law shape size distribution is expected on theoretical grounds whenever grain-grain collisions may lead to shattering (Dohnanyi 1969), but differs from that expected on the basis of grain growth (e.g. Dullemond & Dominik 2005; Tanaka et al. 2005) in which case the dust size distribution has one or two peaks that shift with time. If the distribution results from an equilibrium between growth and fragmentation, it may also be flat (Dullemond & Dominik 2005). It is therefore not at all obvious that a power law size distribution is indeed the appropriate choice. We used it nevertheless, because it is the standard assumption in most disk models. The relative abundance of carbon and silicate grains is explored as a model parameter.
Grains of different sizes are all assumed to have the same temperature. Technically this is achieved by averaging the mass absorption coefficients of the different grain sizes and materials, weighted by the relative mass contained in each grain size and material. This averaged mass absorption coefficient is then used to solve the radiative transfer problem.
2.2.2 Small and large grains, and the small grain disk mass
Many studies of dust evolution in disks discuss the presence of “large” grains. Depending on the type of study, this term may mean grains of a few , as they may be detected by studying the 10 emission feature, or mm-sized grains as submm and mm studies report. It is therefore important to define clearly what is meant by “large” and “small” in the context of a study.
In the present paper, we are interested mainly in the overall structure of the disk model, and this structure will be dominated by the grains that carry the opacity in the disk, i.e. the relatively small grains. Instead of using the total disk mass as an input parameter, we therefore use the term small grain mass of the disk as the one main parameter of our disk models. This covers all grains smaller than 25. In most models we only consider these grains and vary the small grain mass of the disk over a large range. This does not necessarily imply that the true dust mass in the disk equals to this value. In fact, one way to justify a large range in the small grain mass is by assuming that much of the original dust mass in the disk has been converted to larger grains, that no longer influence the structure of the disk. In Sect. 3.2, we demonstrate a computation of a few models in which we add significant amounts of dust mass in the form of a midplane layer of large grains, and prove that the general shape of the SED at near and mid-IR wavelength is largely unaffected by this mass.
However, we study in detail the effects of changing the relative abundance of grains below 25: these changes are expected to affect both the strength of emission features close to 10, and the overall disk structure.

2.3 First look: an example model and comparison to the DDN model
To obtain an impression of the new self-consistent models and how they compare with the DDN models, we use the model fit completed by Dominik et al. (2003, hereafter D03) for the case of AB Aurigae. We have not made a specific fit with the new model to the observed data. For the sake of comparison, we have taken the disk parameters exactly as they were derived by D03, and solved the radiative transfer problem and the vertical structure for this case. In Fig. 1, we show the observed SED of AB Aurigae and its D03 fit, the new model seen face-on, and the new model seen at an angle of 65 degrees (the value derived by D03).
As can be seen, there are significant differences between the models, most important of which may be the difference in the 3 bump, which represents the radiation that is caused mostly by the inner rim. While by the D03 fit, this region of the SED is well fitted, the new models underestimate the flux. This is a systematic effect: the self-consistent models under-predict this flux systematically, a fact also noted by Vinković et al. (2006). This is partly because the temperature drops rapidly into the rim, and part of the absorbed energy is emitted at wavelengths far longer than 3 . It may be in part because the geometric shape of the inner rim is in reality more rounded than assumed here (Isella & Natta 2005). This would also remove the extreme dependence of the strength of the inner rim emission on the inclination of the disk, as can be seen by comparing the model spectra for a face on disk with one that is inclined by 65∘. The unrealistically strong dependence on inclination is also the reason why direct model fits infer high inclinations in out model - the inner rim emission is highest at these angles. Isella & Natta (2005) demonstrated that a more rounded rim has its maximum flux in the face-on orientation. Unfortunately, we still need to devellop completely self-consistent models for the inner rim. We only need to notice that there is a problem, and that inclination fits should not be trusted. In Sect. 5.1 we will consider the systematic effects caused by the weak inner rim.
Another side-effect of the model at 65∘inclination is that the stellar flux is clearly reddened by the absorption of the outermost disk parts. At this inclination, the flaring outer part of the disk extends to angles of up to 50∘, so that the line-of-sight from the observer to the star passes through these outer parts. Dust grains present there absorb the stellar light and redden the star (see, for example Whitney et al. 2003).
The far-infrared wavelength range of the SEDs emits more flux when compared to the D03 model. This is a direct consequence of the different height of the inner rim. In the D03 models, the higher rim shadows the outer regions of the disk more, and consequently less reprocessed radiation emerges from these regions. Clearly, it would be possible to construct a model that provides a better fit to the outer regions, by reducing the small grain mass in the outer disk regions. We have not attempted this here.
| disk parameter | adopted values | |||||
|---|---|---|---|---|---|---|
| dust mass [] | -6.0 | -5.5 | -5.0 | -4.5 | -4.0 | |
| outer radius [AU] | ∗200 | 400 | 600 | |||
| mass distribution | -1.0 | ∗-1.5 | -2.0 | |||
| dust parameter | adopted values | |||||
| size range [] | ∗0.01 | 0.1 | 1 | |||
| ∗1 | 5 | 10 | 25 | |||
| mass fraction | ∗1 | 0.95 | 0.91 | 0.83 | ||
| ∗0 | 0.05 | 0.09 | 0.17 | |||

2.4 The model grid
Our model grid was computed for a central star of mass , radius and effective temperature K, and therefore a luminosity . Its spectral energy distribution was represented by a Planck function. An overview of the disk parameters is given in Table 1. The free parameters describing the global disk structure were: the total mass in small dust grains , the mass distribution, and the outer disk radius . A fixed gas-to-dust ratio relates to the total disk mass, although the amount of gas in the disk enters the calculation in no way. The radial distribution of the surface density was given by , i.e. it is described by the power-law index and the total disk mass. We note that although the outer disk radius is a free parameter, the inner disk radius is computed self-consistently using the dust sublimation temperature . The dust is assumed to consist of silicate and carbon grains. In the current study, we were not interested in the effects of different sublimation temperatures of different species. We therefore assume that both species sublimate together at = 1 500 K, typical of silicates. We also investigated the effects of grain size and computed a set of models with different grain size ranges (see Table 1). The full model grid therefore comprises 50 models. The relative abundance of the two dust species considered was also varied, but the effect was negligible.
3 Spectral energy distributions
Figure 2 shows the SEDs of the different models relative to our standard model,which is given by the solid curve in each panel. This model uses a total mass in small dust grains of 10, a surface density power law with , a dust size distribution between 0.01 and 1.0, a carbon/silicate mass ratio of 0 and a luminosity of 40L⊙. The SED of the standard model is computed at an inclination of 50∘. In each panel, we then vary one parameter, as specified by the labels in the diagram.
3.1 Overview over SED parameter dependence
Figure 2 shows the spectral energy distributions for a subset of our parameter study. In each panel, we start from our standard base model and then vary a single parameter. The resulting SEDs are shown, and the different values of the varied parameter is shown in the panel legend. We present a far more detailed discussion of the parameter dependencies in Sect. 4.3; here, we only highlight the obvious properties of these calculations. It is clear that the dependence of the SED on the mass of small dust grains (panel a), the inclination (panel b) and the maximum grain size (panel f) is far stronger than the influence of all other parameters. In panels d, e, and h, hardly any variations are seen, whereas the data in panels c and g show moderate changes.
One result is particularly significant: The shape and strength of the 3 bump is extremely robust and similar in all models, with only two exceptions. One exception is high inclination models (∘). In these models, the inner rim is seen through the outer disk, and the 3 flux is strongly absorbed. The other exception is the model with a luminosity of only 10L⊙ for which the inner rim emission is less significant. The reason for this latter case is that at low luminosities, the dust evaporation radius is far closer to the star, and therefore deeper inside the gravitational potential of the star. The gravity of the star reduces the ratio of surface height to distance, so that a smaller fraction of the total luminosity is absorbed by the inner rim. Apart from those exceptions, this part of the spectrum shows an amazing lack of variation. This is a reflection of two important facts: (i) the distance of the rim is set by evaporation physics and therefore independent of the disk properties. (ii) its height is only weakly dependent on disk properties because the rim is strongly optically thick and remains so regardless of parameter changes.
The SED variations in panel b (inclination) only occur because of the location of the observer relative to the object. If we focus on the remaining parameters that alter the intrinsic properties of the star-disk system, the strongest influence is exerted by the mass in small grains, which can switch the outer disk from optically thick to optically thin.
Some of the variations in panel f are due to a significant reduction in the optical depth of the outer disk, which is caused by an increase in the upper limit of the dust grain size distribution to 25. In addition, the 10 feature is also weakened because this feature is mostly due to grains with sizes below 3.
| large grain | |||
|---|---|---|---|
| model | [] | [] | mass fraction |
| ML0 | |||
| ML1 | |||
| ML2 | |||
| ML3 | |||
| ML4 | |||
| ML5 |

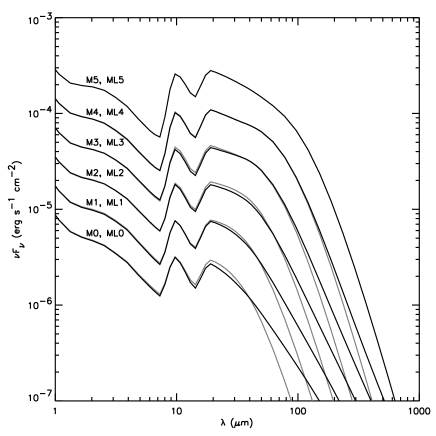
3.2 Large grains in the mid plane
We considered a wide range of total small dust grain mass in the disk in order to produce models of significantly different properties. In reality, the amount of solids in a disk might span a far smaller range ov values (Acke & van den Ancker 2004), and the small dust mass required to reproduce group II models may be compensated for by larger grains or even pebbles and boulders in the disk midplane. DD04 already demonstrated that converting a large fraction of small grains into large midplane particles produces models that are similar to those of small dust mass, apart from the fact that the submm luminosity is increased. Therefore, throughout this paper, low dust mass can be assumed to correspond to models with an efficient conversion of micron-sized dust to far larger particles.
To assess the effect of sedimentation on the spectral energy distribution, we calculated an additional five models, in which we introduced a mid-plane layer of large grains. This was achieved by taking a model from the standard grid with a dust mass less than and adding a mid-plane layer of grains of a mass such that the total disk mass equaled . The resulting values of the mass in the midplane layer can be seen in Table 2. The large grain mass fraction varies between for model ML0 and for model ML5, which is equivalent to its parent model M5 (see Table 4).
The SEDs are shown in Fig. 3. In the upper panel, we compare all models that include a mid-plane layer. While there are strong differences in the near, mid, and far infrared, the models converge in the submm region, indicating equal total mass. In the lower panel, we compare two models with the same mass in small grains, one without the added midplane layer, one with the added layer. It is clear from these plots that the shape of the SED blueward of about 60 is determinated by the mass in small grains, while at wavelengths longer than 100 clear differences can be seen. In a classification of SEDs based on the SED up to 60, we can therefore ignore the presence or absence of a mass-compensating midplane layer of large grains. We also demonstrate this in Sect. 4.2.
This implies that sources with the same small grain mass have the same group classification, but not necessarily the same total dust mass because mass may be ’hidden’ in large grains. Since large grains affect the shape only at sub-mm wavelengths and are therefore not evident in the van Boekel et al. (2003) diagram, adding large grains in the mid plane of the disk does not influence the Meeus classification significantly. We can therefore conclude that differences between the properties fo group I and a group II sources are due to the small () grain mass. While the models infer a factor of 100 difference in sub-mm flux between group I and II, observations only show a factor of 10. This implies that large grains must exist in the group II sources to increase the sub-mm flux to the observed levels. As demonstrated by Acke et al. (2004), the sub-mm slope of group II sources also indicates that there must be more large grains present than in group I sources.
4 Color-color diagram
4.1 Quantifying SED classification
To quantify the amount of flaring in all calculated models, we needed to employ a method that is both fast and accurate. Previously, the classification of group I/II was achieved by fitting power-law and/or black-body functions to the SED (Meeus et al. 2001), splitting the SEDs into two groups based on the presence (group I) or absence (group II) of a black-body component in addition to the power-law component. Since this proved to be an inefficient method when analyzing hundreds of SEDs, we chose a simple quantitative way of classifying SEDs. BWD03 provided us with such a method.
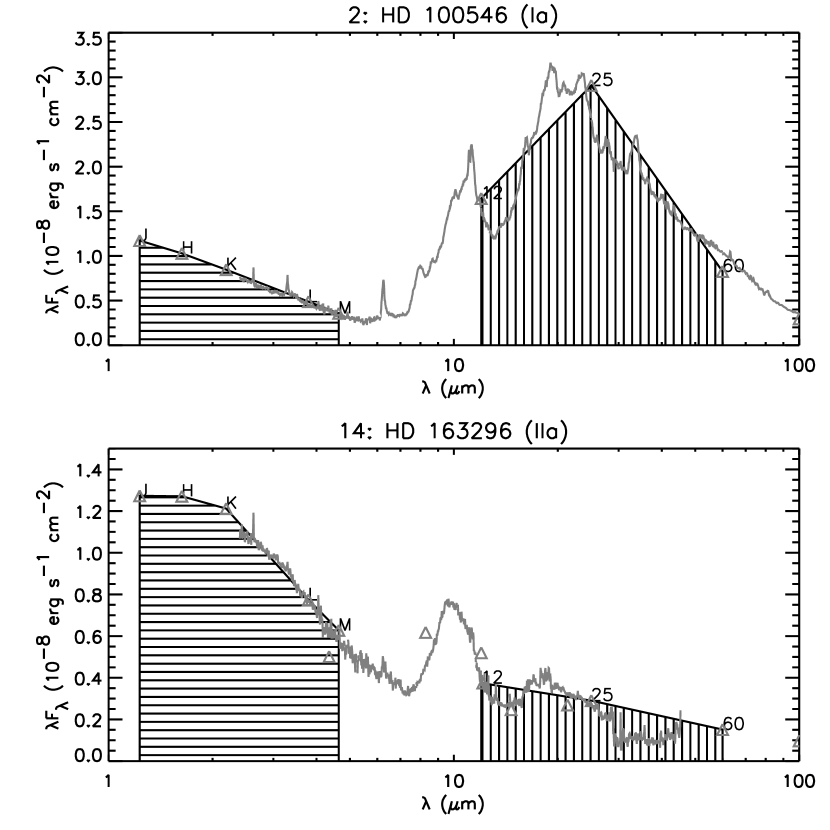
In BWD03, an IRAS color versus diagram was presented. was the integrated luminosity from JHKLM photometry and the same quantity derived from the IRAS 12, 25, and 60 data points. Figure 4 shows these two luminosities for two sources typical of group I and group II. The IRAS color is sensitive to the slope of the SED between 12 and 60 m, which is steeper in group II sources resulting in a lower IRAS color for group II sources than group I sources. The near to far infrared luminosity ratio is sensitive to the disk surface-temperature distribution. Since group I sources have warmer outer disk surface temperatures than group II sources their FIR emission will be higher relative to the NIR emission and the NIR over FIR ratio will be lower. Data for group II sources occupy mainly the upper left corner whereas group I sources will occupy primarily the lower right corner. An example of the diagram is shown in Fig. 5. The sources used in Fig. 5 are listed in Table 3.
The line was determined to be the most reliable means of separating group I from group II sources. Sources above the line belong to group II, sources below the line to group I. HD 142527 (#11 in table 3) does not comply with this rule because of its different geometry (Fukagawa et al. 2006; Fujiwara et al. 2006). However, the porperties of inner part of its disk indicates that it is group II (Leinert et al. 2004).

| (1) | (2) | (3) | (4) | (5) | (6) | (7) | (8) | (9) | (10) | (11) | (12) |
| # | star | group | |||||||||
| 1 | AB Aur | Ia | |||||||||
| 2 | HD 100546 | Ia | |||||||||
| 3 | HD 179218 | Ia | |||||||||
| 4 | HD 97048 | Ib | |||||||||
| 5 | HD 100453 | Ib | |||||||||
| 6 | HD 135344 | Ib | |||||||||
| 7 | HD 139614 | Ib | |||||||||
| 8 | HD 169142 | Ib | |||||||||
| 9 | HD 104237 | IIa | |||||||||
| 10 | HD 142527 | IIa | |||||||||
| 11 | HD 142666 | IIa | |||||||||
| 12 | HD 144432 | IIa | |||||||||
| 13 | HD 150193 | IIa | |||||||||
| 14 | HD 163296 | IIa | |||||||||
| 15 | 51 Oph | IIa | |||||||||
| 16 | HD 95881 | IIb |
| model | [12]-[60] | |||||
|---|---|---|---|---|---|---|
| CGplus | 65 | 2.158 | 1.680 | 0.273 | 0.162 | |
| RADICAL | 6 | 1.793 | 0.401 | 0.142 | 0.355 | |
| RADICAL | 65 | 1.671 | 0.802 | 0.206 | 0.256 | |
| M0 | 50 | 0.08 | 1.60 | 0.156 | 0.097 | |
| M1 | 50 | 0.61 | 1.26 | 0.164 | 0.130 | |
| M2 | 50 | 1.01 | 1.00 | 0.167 | 0.167 | |
| M3 | 50 | 1.24 | 0.86 | 0.173 | 0.202 | |
| M4 | 50 | 1.41 | 0.74 | 0.177 | 0.239 | |
| M5 | 50 | 1.34 | 0.63 | 0.190 | 0.303 | |
| ML0 | 50 | 0.42 | 1.69 | 0.154 | 0.091 | |
| ML1 | 50 | 0.72 | 1.27 | 0.161 | 0.127 | |
| ML2 | 50 | 1.01 | 0.99 | 0.165 | 0.166 | |
| ML3 | 50 | 1.31 | 0.89 | 0.173 | 0.194 | |
| ML4 | 50 | 1.42 | 0.74 | 0.177 | 0.238 |
Other aspects of the disk and the dust also play a role in determining the position of a model in this diagram. A model without a puffed-up inner rim emits less NIR and more FIR flux than a model with a puffed-up inner rim. This is because the puffed up inner rim re-emits more radiation in the NIR and casts a shadow on the disk thereby decreasing the FIR flux. The FIR flux will decrease more on the blue side and increase in slope because the shadow does not affect the outer parts of the disk in which the flux redward of 20 originates. Therefore, a model without a puffed-up inner rim has a lower NIR/FIR ratio and a redder IRAS color and will be shifted down and to the right in the diagram with respect to the models with a puffed-up inner rim.
Adding a mid-plane layer of large grains to a model will increase the FIR flux longward of approximately 50 . The large grains in the mid plane are only visible in the outer parts of the disk, where they are cold and emit at longer wavelengths. This means that adding a mid-plane layer will increase both the FIR flux and the IRAS color, shifting the predicted data points for a model with an added mid-plane layer of large grains to the right of and slightly lower than the original model.
The NIR and FIR windows were chosen so that there is only a limited contribution from the silicate emission around 10 and it is primarily the geometry of the disk determine the position in the diagram. However, (cold) crystalline silicates also emit a broader and less conspicuous feature that peaks around 20 . If there is a large amount of crystalline silicates in the outer part of the disk (beyond 2 AU), such as that in HD 142527 (see van Boekel et al. 2004), this will contribute significantly to the FIR flux. This means that sources with highly crystalline (outer) disks will appear lower in the diagram.
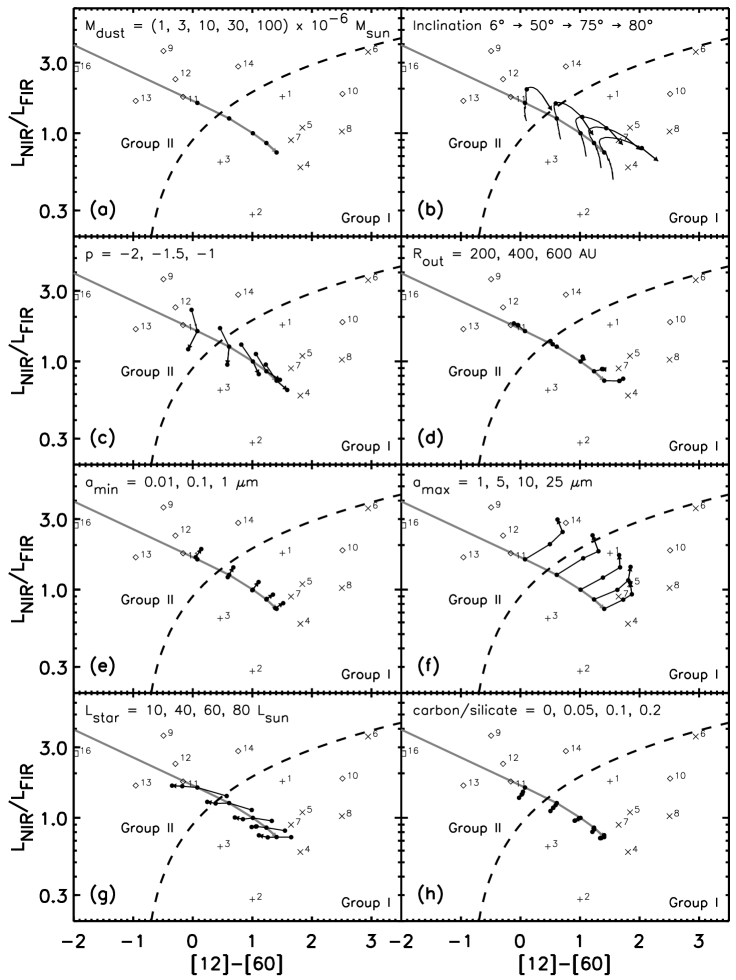
Figure 6 shows the position of all models in our parameter study in the diagnostic color-color diagram. We varied each parameter for 6 different small-grain dust masses, using the models M0–M5 as the basis for each variation track.
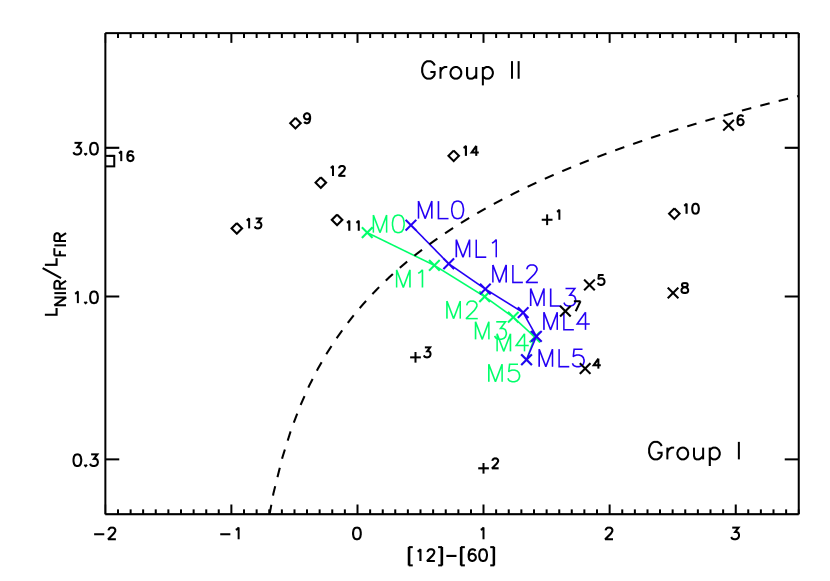
4.2 Influence of large midplane layer grains
In Fig. 7 we show the positions in the diagnostic diagram of the models M0–M5, and compare them with the positions of the corresponding models in which a low value of the small grain mass is compensated by a layer of large grains in the mid-plane. This figure clearly confirms our expectation from Sect 3.2. The positions of the models with the same small-grain mass are very close to each other. Models ML2–ML5 occupy exactly the same position as the corresponding models M2–M5. A visible shift occurs only for models with the lowest small grain masses, ML0/M0 and ML1/M1. However, the shift is small compared with the overall range for both observations and modelling results in this diagram. We may therefore restrict our discussion to the small grain masses.
4.3 General parameter trends
We will discuss the trends observable in each panel of Fig 6 and the physics in the models responsible for these trends.
- Dust mass
-
In Figs. 2(a) and 6(a), the effect on the spectrum of increasing the dust mass can be seen. As concluded before in DD04, dust mass is an important factor in determining the disk geometry. Higher mass provides hgher opacity, which causes more flaring. An increasing dust mass therefore shifts a model from group II to group I. It should be noted, however, that primarily small grains (10 ) contribute to the opacity in the disk, so the dust mass mentioned is the mass in small dust grains. This is more evident when we add a mid-plane layer of large (2 mm) grains in Fig. 7.
- Inclination
-
In Figs. 2(b) and 6(b), the effect of changing the inclination on the spectrum of models with different dust mass is shown. Increasing the inclination from face-on to the angle at which AV equals 0.1 (indicated by a triangle) enables more of the vertical inner rim to become visible. This causes the NIR flux to increase. Furthermore, increasing the inclination caused the outer part of the disk to absorb an increasing amount of the inner rim radiation. This decreases the NIR flux, and reddens the entire spectrum making the IRAS color increase. At extreme inclination angles (, not shown here), the reddening becomes so severe that the SED would no longer be classified as a (Lada-)class (Lada 1987) II source, but rather as a class I source.
- Power-law of Mass Distribution
-
In Figs. 2(c) and 6(c), we can observe the effect of changing the surface density power law. Steepening the power law while keeping the disk mass the same, causes relatively more of the mass to be on the inside of the disk. Between the shallowest () and the steepest () power law slope, the mass in the inner 1 AU increases by a factor of 46 and the height of the inner rim by a factor of two. Having relatively more mass on the inside implies that there is less mass on the outside where the FIR flux originates. Thus the FIR flux decreases while the NIR flux increases and the NIR/FIR ratio increases as the power-law slope steepens. In the higher mass models the mass in the outer disk region is colder and emits mainly redward of 20 . The decrease in FIR flux blue-shifts the IRAS color value.
- Outer Radius
-
In Figs. 2(d) and 6(d), the effect of an increasing outer disk radius is shown. Increasing the disk size while keeping the dust mass the same causes more of the mass to be on the outside and less on the inside. However, the mass is redistributed far less significantly than when the power-law slow is altered. The mass in the inner AU reduces by only a factor of two and the mass on the outside shows no significant increase. To achieve a similar redistribution of mass as in the power-law models, we would have to increase the disk size to AU. The position of the models in the diagram would then hardly change.
- Minimum grain size
-
In Figs. 2(e) and 6(e), the effect of increasing the lower limit on of the grain-size distribution is shown. Because of the power-law slope in the size distribution we use, most mass is in the largest grains. Increasing the minimum grain size therefore has little effect on the SED. The small grains emit mostly in the 10-20 wavelength range. This affects the FIR flux and the 12 IRAS color, and the NIR/FIR and the IRAS color therefore increase.
- Maximum grain size
-
In Figs. 2(f) and 6(f), the effect of increasing the upper limit on the grain-size distribution is shown. By increasing the upper boundary of the size distribution power law while keeping the lower boundary constant, mass is extracted from the population of smaller grains and placed into the larger ones. Large grains have lower opacity (absorption cross section per mass). Consequently, the overall IR flux decreases and the 10 and 20 features reduce in strength. The FIR flux decreases more rapidly than the NIR flux because the outer parts of the disk become optically thin (leading to weaker flaring), while the inner parts hardly change in structure. Beyond 60 , the flux increases as more and more cold material is revealed. However, when the maximum grain size exceeds 10 , the flux also decreases in this part of the SED because the decrease in opacity becomes significant. This effect causes the reversal in the IRAS color.
- Stellar luminosity
-
In Figs. 2(g) and 6(g), we show the effect of varying the stellar luminosity. Changing the stellar luminosity influences the spectra in two ways. The inner rim becomes much less pronounced in the calculations for a star with , an effect already noted by DDN01. At the same time, the low-luminosity object contains more flux at long wavelengths, between 60 and 100. In particular, this effect leads to a horizontal shift in the diagnostic color-color plot.
- Carbon/silicate ratio
-
In Figs. 2(h) and 6(h), the effect of varying the carbon/silicon mass ratio in the dust opacity calculations is shown. It is immediately clear that this effect is minor and hardly affects the general shape of the SED. We will discuss in a companion paper (Meijer et al 2007, submitted to A&A) how this is an important parameter in terms of the strength of the 10 feature. However, for the SED shape as probed by our diagnostic diagram, the carbon content has little or no effect. SInce the addition of carbon increases the continuum level, both the NIR and FIR flux increase at the same rate, so that the ratio does not change. Since the slope between 12 and 60 hardly changes, also the IRAS color remains unchanged.
5 Discussion
5.1 Effects of the weak inner rim
In Sect. 2.3 we demonstrated that the inner rim emission in the new models is systematically weaker than in the simpler DDN models. In Table 4, we quantify this result. Looking at the flux ratios derived from observed SEDs (see table 3), we can see that the rim emission (the near-IR flux, listed in Col. 10) accounts for the reprocessing of typically 20-30% of the stellar luminosity. In the models, the typical value is 15-17% and varies only weakly with disk properties. Clearly, this should also have a systematic effect on the diagnostic diagram. In fig.8, the infrared colors of AB Aur are compared with model predictions. Clearly, the difference is mainly a shift in the ratio of NIR to FIR luminosity in the disk. Taking this into account, it is unsurprising that our model predictions are below the data points of the observations.

5.2 Effects of moderate dust growth
An important part of our parameter study has been considering the effects of moderate dust growth, i.e. either extending the upper limit of the size distribution from 1 to values of up to 25, or the complete removal of small grains, modeled by shifting up the lower boundary of the size distribution. In Sect. 4.3 we found that removing grains below 1 has only a small effect on the structure of the models, while shifting the upper boundary of the size distribution (and in this way removing smaller grains as well, including grains with sizes close to 1) may affect the global SED. In this section, we study the basic effects of changes in grain size on the strength of the 10 feature. Again, we do this without paying attention to mineralogical information - only the overall strength of the feature is considered.
5.2.1 Weak 10 feature
Dust emission features in disks are an excellent way of probing the composition and size of grains present in the disk. The observed 10 features can vary strongly, both in strength and shape (e.g. van Boekel et al. 2003; Przygodda et al. 2003; van Boekel et al. 2005; Kessler-Silacci et al. 2006). In particular, there are a few sources that show no discernible 10 feature at all. These objects were classified by Meeus et al. (2001) into subclass b. Observationally, at least in the bright ISO sample (Meeus et al. 2001), a significant fraction of objects with SED group Ib were found, but no clear cases of group IIb. An important question is, whether this is an automatic consequence of the disk flaring geometry (i.e. group I versus group II), or if additional factors are needed to produce weak features. We therefore measured the feature strength in all our models.


Most of the models show a strong 10 feature and would therefore be classified as group Ia or IIa in the Meeus et al. (2001) scheme. However, there are several corners of parameter space where a weak silicate feature can exist. These sources would then have to be classified as group Ib or IIb. An overview plot of all models with a feature-t-continuum ratio lower than 1.05 (see Fig. 9). There are two basic ways of producing a weak emission feature:
-
1.
Viewing a disk model at an inclination close to but not fully edge-on. In this case, the emission feature produced by the warm inner disk is partially compensated by absorption further out in the disk. A typical inclination for this effect to occur is 65∘. It is clear that this requires fine-tuning of the inclination in the modeling. Furthermore, models with a self-absorbed feature have significantly higher reddening. Observed sources with classification Ib do not exhibit higher reddening than group Ia sources. Therefore, we are left with the second possibility:
-
2.
Efficient removal of grains smaller than about 3. In the framework of our model, this can be achieved by either increasing the lower limit of the grain size distribution to a few , or increasing the upper limit of the grain size distribution. If the grain size distribution is sufficiently steep (i.e. ), most of the mass resides in large grains, so that increasing the upper limit effectively reduces the mass in small grains. We show two example of SEDs without strong features in Fig.10.
While possibility (2) providesdelivers a reasonable explanation for the existence of the subgroup b sources, an important problem is introduced by the fact that subgroup b appears to be much more abundant in group I sources than in group II sources (Acke & van den Ancker 2004), while the models show just as many sources that could be classified as IIb. Therefore, we must be dealing here with either an observational bias, or with an evolutionary effect. Acke & van den Ancker (2004) suggested that group IIa sources are systematically brighter than group IIb sources, so that observational biases could be at work.
6 Conclusions
We arrive at the following conclusions.
-
1.
The Parameter range investigated covers most of observed SEDs
By comparing all models with observations, we are able to explain most, but we are unable to account for teh observational data points in the upper right corner for HD 142527 (11), HD 135344 (6) and HD 169142 (8). These stars all show evidence of disk gaps in imaging observations, which may be part of the reason why they are more difficult objects to describe. -
2.
The mass of small grains largely determines the SED type
We find that the mass in small grains is the single most important parameter determining the SED type. While extreme values of the surface density power law (DD04) can also shift a disk from group I to II and vice versa, the values required for this to occur seem too extreme. All other parameters have very limited influence on the classification of a source as group I or group II. -
3.
No group I/II dichotomy
From a modeling point of view, we find that there is no clear dichotomy between group I and group II models. The position of a model in the diagnostic color-color diagram changes smoothly across the dividing line as parameters vary. The line connecting models of different small dust mass is almost perpendicular to the dividing line, while changes in other parameters cause shifts that are at least partially parallel to the dividing line. As the dust mass is changed in logarithmic steps, there is a gradual transition from fully flared (group I) to non-flaring (group II) disks. Some observed sources are in fact close to the dividing line, in particular AB Aur (source number 1) and HD 163296 ( source number 14) fall into this class. A scarcity of intermediate objects, if confirmed in studies of larger samples, would indicate a rapid transition if the distinction is interpreted as an evolutionary effect. -
4.
The strength of the inner rim emission is hardly dependent on disk mass
The emission caused by the inner rim is hardly dependent on model parameters, as long as the dominant grain size is the inner rim remains the same. As long as the inner rim is sufficiently optically thick, its height depends only weakly on the details. In particular, the small grain mass influences only the inner rim emission when the surface density is decreased by more than a factor of 100, compared with the case in which all dust mass is in small grains. This is consistent with observations that show the 3 bump to be similar in all Herbig stars (Meeus et al. 2001).
-
5.
The 3 bump in the predicted spectra is too weak
The models show that with the current assumptions, the self-consistent models do still not produce a sufficient amount of emission the 3 bump. This causes a systematic shift of the models in the color-color diagram. A more detailed implementation of the inner rim in models is highly desired.
Acknowledgements.
J.M. acknowledges financial support from Network II of the Nederlandse Onderzoeksschool Voor Astronomy (NOVA) through project 10.10.2.12 and from the NWO Council for Physical Sciences through project 614.041.007.References
- Acke & van den Ancker (2004) Acke, B. & van den Ancker, M. E. 2004, A&A, 426, 151
- Acke et al. (2004) Acke, B., van den Ancker, M. E., Dullemond, C. P., van Boekel, R., & Waters, L. B. F. M. 2004, A&A, 422, 621
- Bouwman et al. (2001) Bouwman, J., Meeus, G., de Koter, A., et al. 2001, A&A, 375, 950
- Chiang & Goldreich (1999) Chiang, E. I. & Goldreich, P. 1999, ApJ, 519, 279
- Dohnanyi (1969) Dohnanyi, J. W. 1969, J. Geophys. Res., 74, 2531
- Dominik et al. (2003) Dominik, C., Dullemond, C. P., Waters, L. B. F. M., & Walch, S. 2003, A&A, 398, 607
- Dullemond (2002) Dullemond, C. P. 2002, A&A, 395, 853
- Dullemond & Dominik (2004) Dullemond, C. P. & Dominik, C. 2004, A&A, 417, 159
- Dullemond & Dominik (2005) Dullemond, C. P. & Dominik, C. 2005, A&A, 434, 971
- Dullemond et al. (2001) Dullemond, C. P., Dominik, C., & Natta, A. 2001, ApJ, 560, 957
- Dullemond & Natta (2003) Dullemond, C. P. & Natta, A. 2003, A&A, 408, 161
- Fujiwara et al. (2006) Fujiwara, H., Honda, M., Kataza, H., et al. 2006, ApJ, 644, L133
- Fukagawa et al. (2006) Fukagawa, M., Tamura, M., Itoh, Y., et al. 2006, ApJ, 636, L153
- Hillenbrand et al. (1992) Hillenbrand, L. A., Strom, S. E., Vrba, F. J., & Keene, J. 1992, ApJ, 397, 613
- Isella & Natta (2005) Isella, A. & Natta, A. 2005, A&A, 438, 899
- Kamp & Dullemond (2004) Kamp, I. & Dullemond, C. P. 2004, ApJ, 615, 991
- Kessler-Silacci et al. (2006) Kessler-Silacci, J., Augereau, J.-C., Dullemond, C. P., et al. 2006, ApJ, 639, 275
- Lada (1987) Lada, C. J. 1987, in IAU Symp. 115: Star Forming Regions, ed. M. Peimbert & J. Jugaku, 1–17
- Laor & Draine (1993) Laor, A. & Draine, B. T. 1993, ApJ, 402, 441
- Leinert et al. (2004) Leinert, C., van Boekel, R., Waters, L. B. F. M., et al. 2004, A&A, 423, 537
- Mathis et al. (1977) Mathis, J. S., Rumpl, W., & Nordsieck, K. H. 1977, ApJ, 217, 425
- Meeus et al. (2001) Meeus, G., Waters, L. B. F. M., Bouwman, J., et al. 2001, A&A, 365, 476
- Natta et al. (2000) Natta, A., Grinin, V., & Mannings, V. 2000, Protostars and Planets IV, 559
- Natta et al. (2001) Natta, A., Prusti, T., Neri, R., et al. 2001, A&A, 371, 186
- Preibisch et al. (1993) Preibisch, T., Ossenkopf, V., Yorke, H. W., & Henning, T. 1993, A&A, 279, 577
- Przygodda et al. (2003) Przygodda, F., van Boekel, R., Àbrahàm, P., et al. 2003, A&A, 412, L43
- Tanaka et al. (2005) Tanaka, H., Himeno, Y., & Ida, S. 2005, ApJ, 625, 414
- van Boekel et al. (2004) van Boekel, R., Min, M., Leinert, C., et al. 2004, Nature, 432, 479
- van Boekel et al. (2005) van Boekel, R., Min, M., Waters, L. B. F. M., et al. 2005, A&A, 437, 189
- van Boekel et al. (2003) van Boekel, R., Waters, L. B. F. M., Dominik, C., et al. 2003, A&A, 400, L21
- Vinković et al. (2006) Vinković, D., Ivezić, Ž., Jurkić, T., & Elitzur, M. 2006, ApJ, 636, 348
- Waters & Waelkens (1998) Waters, L. B. F. M. & Waelkens, C. 1998, ARA&A, 36, 233
- Whitney et al. (2003) Whitney, B. A., Wood, K., Bjorkman, J. E., & Cohen, M. 2003, ApJ, 598, 1079