Absorption Phenomena and a Probable Blast Wave in the 13 July 2004 Eruptive Event
Abstract
We present a case study of the 13 July 2004 solar event, in which disturbances caused by eruption of a filament from an active region embraced a quarter of the visible solar surface. Remarkable are absorption phenomena observed in the SOHO/EIT 304 Å channel; they were also visible in the EIT 195 Å channel, in the H line, and even in total radio flux records. Coronal and Moreton waves were also observed. Multi-spectral data allowed reconstructing an overall picture of the event. An explosive filament eruption and related impulsive flare produced a CME and blast shock, both of which decelerated and propagated independently. Coronal and Moreton waves were kinematically close and both decelerated in accordance with an expected motion of the coronal blast shock. The CME did not resemble a classical three-component structure, probably, because some part of the ejected mass fell back onto the Sun. Quantitative evaluations from different observations provide close estimates of the falling mass, g, which is close to the estimated mass of the CME. The falling material was responsible for the observed large-scale absorption phenomena, in particular, shallow widespread moving dimmings observed at 195 Å. By contrast, deep quasi-stationary dimmings observed in this band near the eruption center were due to plasma density decrease in coronal structures.
keywords:
Corona, Radio Emission; Coronal Mass Ejections, Low Coronal Signatures; Coronal Mass Ejections, Initiation and Propagation; Prominences, Active; Radio Bursts, Microwave (mm, cm); Surges; Waves, Shock1 Introduction
Some major flares and coronal mass ejections (CMEs) are accompanied by large-scale disturbances moving over distances comparable with the solar radius like Moreton waves, weakly bright coronal transients (Thompson et al., 1998) usually termed ‘EIT waves’, and temporary depressions of soft X-ray (SXR) and extreme-ultraviolet (EUV) emissions (termed dimmings) appearing near eruption centers and far from them. They have been observed with the Extreme-ultraviolet Imaging Telescope (EIT; Delaboudinière et al., 1995) on SOHO, the Transition Region and Coronal Explorer (TRACE; Handy et al., 1999), and other telescopes. Nevertheless, nature of all these phenomena is still controversial.
Moreton waves are sometimes observed in the H line (Moreton, 1960) and, more recently, in the Hei 10830 Å line (e.g., Vršnak et al., 2002; Gilbert et al., 2004a). Uchida (1968) proposed them to be due to coronal disturbances. Balasubramaniam, Pevtsov, and Neidig (2007) also argued their coronal nature. Moreton waves run faster (400–2000 km s-1) than ‘EIT waves’ ( km s-1, typically 250 km s-1). Warmuth et al. (2001, 2004a, 2004b, 2005) found their kinematical closeness and proposed that both chromospheric and coronal signatures of the waves could be created by a single decelerating disturbance, e.g., a blast shock (see also Hudson and Warmuth, 2004). Gilbert et al. (2004a, 2004b) found ‘EIT waves’ to be co-spatial with their counterparts in Hei.
Some observations favor the wave nature of ‘EIT waves’ (Ballai, Erdélyi, and Pintér, 2005). A few moving bright features were interpreted as CME frontal magnetic structures (Dere et al., 1997; Uralov, Grechnev, and Hudson, 2005). Several authors propose explanations for ‘EIT waves’ within scenarios suggested for dimmings. Delannée and Aulanier (1999) proposed ‘EIT waves’ to be running boundaries of successively opening magnetic structures ahead of expanding dimming areas, from which plasmas evacuate. Attrill et al. (2007) proposed to explain ‘EIT waves’ along with expanding shallow dimmings in their scenario based on interchange reconnection. However, ‘EIT waves’ are not commonly associated with dimmings (e.g., Chertok and Grechnev, 2005b; Grechnev et al., 2005). This means that their nature is not always the same.
Trying to reconcile contradictory views, Zhukov and Auchère (2004) proposed that ‘EIT waves’ represent both wave-like and eruptive components. Simulations of Chen et al. (2002, 2005) confirmed a possibility of two types of coronal wave phenomena during an eruption, one according to the scenario of Delannée and Aulanier (1999), and a fast coronal counterpart of the Moreton wave ahead.
Quasi-stationary dimmings develop from 10 minutes to several hours, reach (drop up to of the pre-event brightness; Chertok and Grechnev, 2003a), and live up to two days (Hudson and Webb, 1997). Having once appeared in some region, they persist there (Chertok and Grechnev, 2005b; Grechnev et al., 2005). Such dimmings are related with active regions and large-scale magnetic fields (Chertok and Grechnev, 2005b; Slemzin, Kuzin, and Bogachev, 2005; Slemzin, Grechnev, and Kuzin, 2006; Zhang et al., 2007). Their main interpretation is plasma density depletion due to its outflow from previously closed structures (see also Harra and Sterling, 2001; Harra et al., 2007).
Some moving shallow darkenings seem to accompany ‘EIT waves’ in their expansion (see, e.g., Zhukov and Auchère, 2004). They can have the same wave-like nature as such ‘EIT waves’. Another kind of short-lived, moving darkenings could be due to absorption of the background emission by material of ejecta. Such phenomena have been observed in images produced with EIT in the 195 Å (Fe xii) band and TRACE in the 195 and 173 Å (Fe ix) bands (the 173 channel is usually called 171 to be consistent with the terminology of EIT; we use 173 to distinguish them). In particular, darkenings sometimes observed with EIT in the 304 Å band (mainly He ii, 20 000–80 000 K) without counterparts in coronal bands (Chertok and Grechnev, 2003b) are expected to be certainly due to absorption in the ejected filament material (Delaboudinière, 2005). Such a phenomenon was recorded with the CORONAS-F/SPIRIT EUV telescope (Zhitnik et al., 2002) in a major event of 18 November 2003 (Slemzin et al., 2004; Grechnev et al., 2005). A dark feature as large as the solar radius was observed at 304 Å only to move during 1.5 hr across the Sun with the plane-of-sky speed of km s-1. Thus, the increasing observational material suggests that different kinds of ‘EIT waves’ and dimmings probably exist (as also Warmuth et al. (2001) proposed).
‘Negative bursts’ (transient decreases of the total radio flux below the relatively quiet level of the solar emission) are believed to be mainly also due to absorption (e.g., Covington and Dodson, 1953; Maksimov and Nefedyev, 1991), although other reasons are possible (e.g., Sawyer, 1977). Since opacity of an absorber depends on frequency and plasma parameters, multi-frequency observations of such bursts promise quantitative diagnostics of ejecta. It seems to be useful to compare observations of an event, in which absorption occurs in both EUV and radio ranges.
This paper addresses the 13 July 2004 event, in which a multi-component eruption, CME, Moreton and coronal waves, large-scale EUV absorption phenomena, long-lived dimmings, and a ‘negative radio burst’ were observed simultaneously. The event included an impulsive M6.7 flare (00:09–00:23, all times hereafter are UT) in active region 10646 (N13 W46) and a CME with a central position angle of observed after 00:54 with the Large-Angle Spectrometric Coronagraph (LASCO; Brueckner et al., 1995) on SOHO. EIT observed large-scale disturbances in the 195 Å band, in particular, a faint oval front at 00:24. A type II burst at 00:16–00:43 was reported by a few observatories. At 01:19, a large-scale darkening was observed with EIT at 304 Å. During this event, a strong impulsive radio burst was recorded at 1–80 GHz followed by a decrease of the radio emission. The ‘negative burst’ was revealed in total flux records of the Ussuriysk Astrophysical Observatory (UAFO, 2.8 GHz), Nobeyama Radio Polarimeters (NoRP; Nakajima et al., 1985; Torii et al., 1979), and the Learmonth Observatory. The event was also recorded in the H central line in the Big Bear (BBSO) and Mauna Loa (MLSO) Solar Observatories, in the Hei line in MLSO, and in the TRACE 173 Å channel. The Nobeyama Radioheliograph (NoRH; Nakajima et al., 1994) observed some fragments of the ejecta at 17 GHz.
Using multi-spectral data, we study this event and reconstruct a picture of the eruption. The ejecta disintegrated. One part fell back onto the Sun, while another part escaped. Dispersed material was responsible for the absorption phenomena observed. Estimations of masses of both these parts, performed using different methods, quantitatively confirm this picture.
The event started with an explosive filament eruption and impulsive flare that likely produced a blast wave. Kinematics of the wave and ejected fragments are compared with analytical expressions, which match observations. Other aspects of the event concerning radio bursts, pulsations, and their association with the flare, ejecta, and shocks are addressed by Pohjolainen, Hori, and Sakurai (2008).
Section 2 presents observational data. All measurements are related to the plane of sky (POS), if otherwise not specified. In Section 3, we address absorption in different emissions and estimate the mass of the ejecta. In Section 4, we discuss kinematical characteristics of the observed phenomena and compare them with theoretical expectations. In Section 5, we discuss results of our analysis, the overall picture of the event, and nature of ‘EIT waves’ and dimmings in this event. Section 5.4 summarizes our findings and their implications.
2 Observations
2.1 Filament Eruption, Moreton Wave, and Surge in H Images
The 13 July 2004 event was observed in the H line center in BBSO and MLSO. No H flare was reported for this event, but images from both observatories show it and related eruptive activities. Figure 1 presents H images obtained in BBSO. The electronic version of our paper contains a movie 2004-07-13_BBSO_Ha.mpg, whose left panel shows H images with a limb darkening removed, and the right panel shows the same images after additional processing to reveal features of interest. Before the eruption, the active region contained a system of rather small filaments. Filament located between positions 1 and 2 starts to rise at 00:02:30 with the top part accelerating at m s-2, which reaches 7 Mm at 00:13:25 with a speed of km s-1 ( order fit). It erupts between 00:13:25 and 00:15:25. A Moreton wave runs from the eruption site north/northeast (see Figure 2). At about its onset, surge 3 starts to grow from the western end 1 of the filament with the average speed of km s-1 (00:18–00:29). At 00:17 – 00:18, a surge from its end 2 appears and takes a V-like shape by 00:26 (frame c).
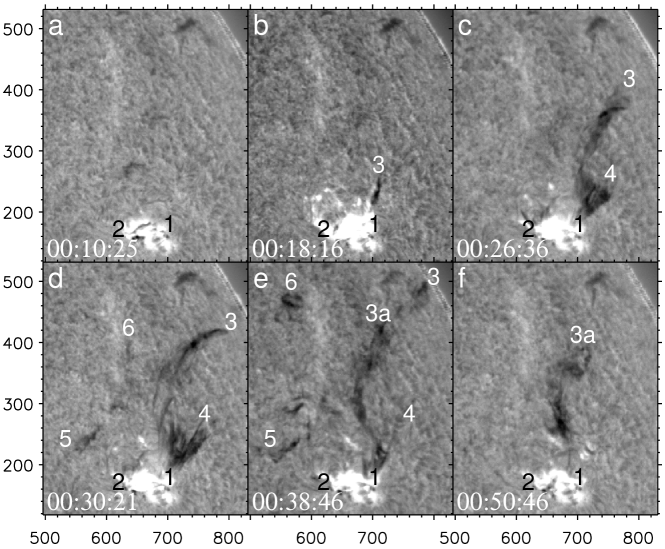
The western surge 1 – 3 consisting of a multitude of thin, likely twisted, threads intensively develops. After 00:22, it starts to bifurcate into the northwest (1 – 4) and north (1 – 3) branches. Branch 1 – 4 rises up to its maximum POS height of 90 Mm by 00:30 and then mainly disappears. Branch 1 – 3 rises and slightly displaces east. New threads appear. Along with fragments emanating from the eastern vicinity 2 of the main filament and a new remote feature 5, they form to 00:30 a large-scale filamentary structure. Its components occupy a significant area 1–4–3–6–5–2 in frame d. Then this area continues to expand north and east, especially, due to the northern part of branch 3 and fragment 6 (frame e). Feature 6 moves toward the North Pole with a speed km s-1 (00:31–00:53). As MLSO Hei 10830 Å images show, the disturbance probably associated with this moving feature reaches vicinities of the polar coronal hole at 01:20. At about 00:40, portion 3a of surge 1–3 overturns at a POS height of 190 Mm and starts to fall, while its farthest part 3 keeps on moving to the limb. After 00:50, the surge partially falls back and becomes fainter. This is due to either spreading out its components that decreases its optical depth, or their increasing line-of-sight velocities that results in the Doppler brightening. Throughout development of the surge, many threads and fragments keep connection with the position of the initial filament(s) 1–2, and their bases rest on its (their) vicinities.
From H data we conclude that a filament eruption resulted in formation of some large-scale ‘dome’ of filament’s threads and fragments to cover in several tens of minutes a significant northwest part of the Sun.
2.2 High-Resolution TRACE 173 Å Images of the Eruption
TRACE observed the event starting from 00:07:27 in the 173 Å channel mainly with intervals from 20 to 70 s, except for the gap of 00:21–00:48. Figure 3 presents several images of the eruption region, which TRACE permits to discern like a magnifier (see also movie 2004-07-13_TRACE_173.mpg). Pre-eruption images show a dark filament(s) and a bright rope along it as well as the northern and southern loop systems surrounding the region.
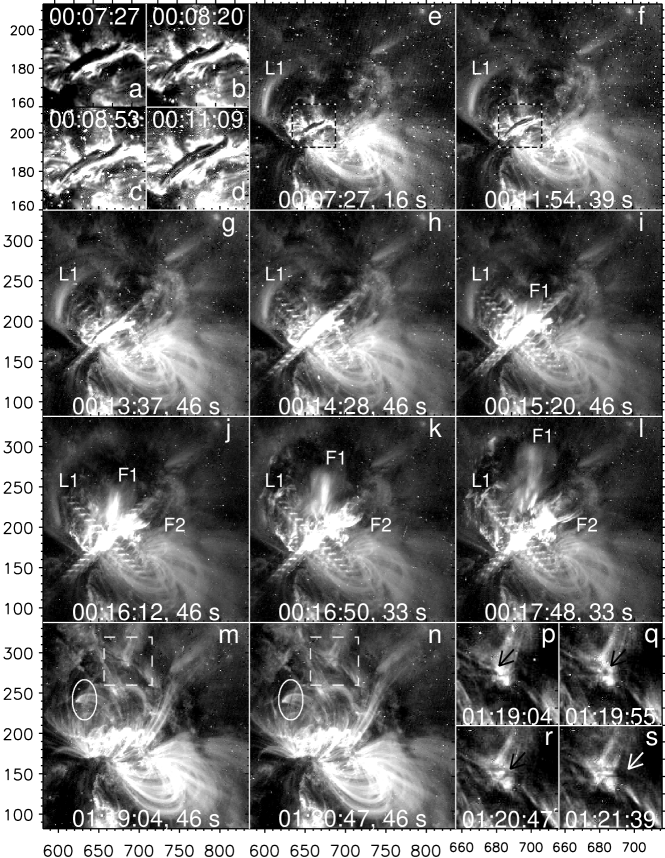
Four enlarged images (this area is outlined in panels e and f by dotted frames) in panels a–d show two filaments located side-by-side to ‘merge’ and then to expand. The expansion of the combined filament is visible in frames e–l. The rising filament gets semi-transparent, and its parts become detectable (j,k). Loop L1 expands in frames i–k and disappears by 00:18 (l). A flare starts beneath the filaments by 00:13:37. In frame i, bright, apparently diffuse material appears above the whole combined filament as its upper envelope, and later, in frames j–l, its brightest part appears as a jet-like feature F1 moving north (up). Another, the slower bright jet-like feature F2 moves west-northwest in frames j–l. Crossly dark/bright patterns are due to interference on the CCD matrix.
The POS speed of feature F1, km s-1, is acquired in min (acceleration km s-2). With this speed and exposure times specified in frames, apparent extents of this feature are . Its jet-like appearance is caused by blurring due to its displacement during the exposure. The same reason explains the semi-transparent appearance of the combined filament. It remains dark in all frames, where it is visible (by 00:17:48). The speed of its top is .
Hence, the eruption occurs between 00:14:28 and 00:15:20. The eruptive filament remains cool. It is surrounded by a hotter envelope with probable temperatures of 0.3 – 1.6 MK (the temperature sensitivity range of the 173 Å channel).
Expansion of the filament and adjacent structures starts before a motion of loop L1. Its displacement visible in frames i,j, when the ejecta was far from the loop, indicates passage of a wave. Thus, loop L1 is pushed by the wave rather than vice versa. The first manifestation of the wave in frame i is somewhat ahead of the Moreton wave (Figure 2a). The speed of the loop is km s-1.
Images obtained after the gap in observations show a post-eruptive arcade. Interesting are dark moving flows occulting brighter structures behind them. Examples are outlined by dashed frames in panels m,n (insets p–s show enlarged images, where a flow is indicated by the arrows) and by ovals. These flows represent moving absorbing (probably cool) material directed likely along magnetic field lines. Note also shrinkage of loops that we do not discuss here.
The eruption destroyed the northern loop system. Loop L1 erupted, but not reappeared afterwards. The southern loop system remained almost unchanged. The eruption looks like a ‘directional explosion’ pointed north.
2.3 Coronal Disturbances in SOHO/EIT 195 Å Images
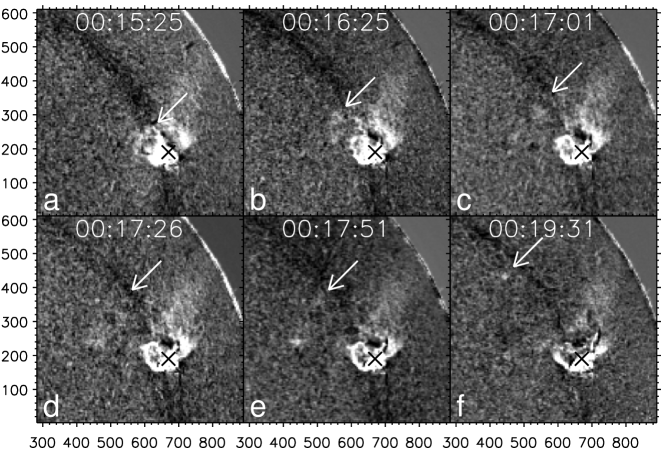
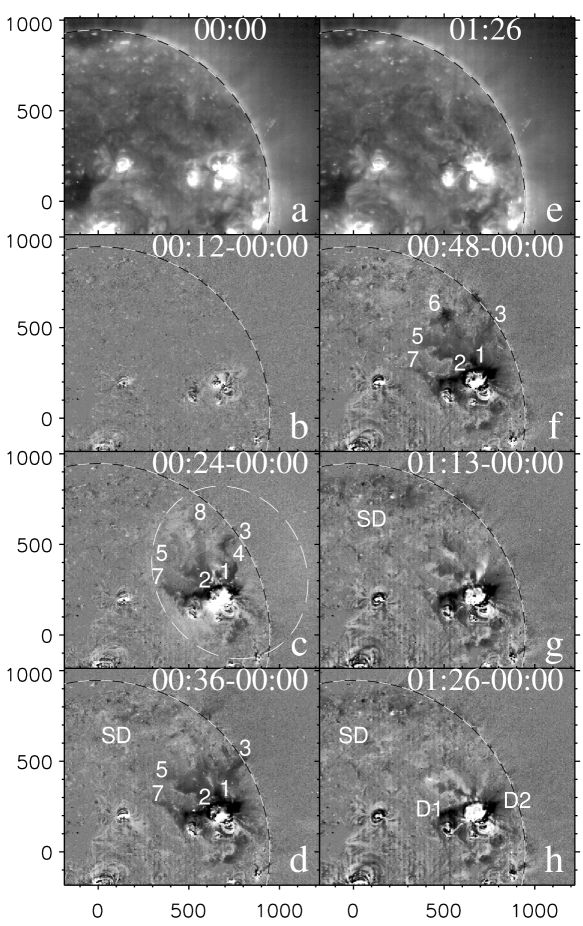
EIT produced 195 Å images every 12 min (CME Watch program). Figure 4 shows a pre-event (a) image and a late-stage (e) one along with six fixed-base differences b – d and f – h with the solar rotation preliminarily compensated (see Chertok and Grechnev, 2005b). Figure 5 provides additional information about large-scale faint disturbances, which are easier to see in running differences.
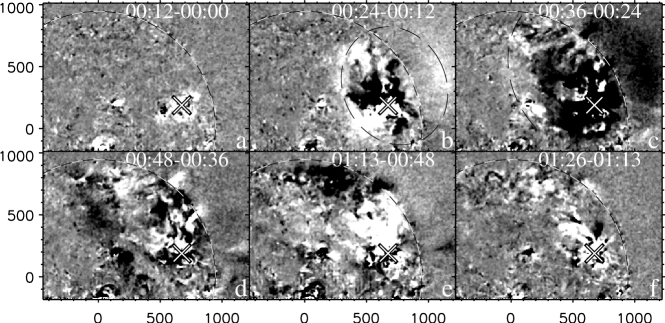
The eruption causes significant disturbances in the corona during 00:24–01:26, both brightening and darkening, that cover a huge area exceeding the NW quadrant of the solar disk. A nearly perfect oval faint brightening is seen at 00:24 (Figures 4c and 5b). It is not uniform in brightness, mainly 5–15 counts/pixel, while the brightness in quiet Sun’s regions is about 40–50 and 5–21 in coronal holes. Three wide brightening sectors directed east-southeast, northeast, and west-southwest spread toward the oval from inside. The oval expands; its next position on the solar disk is denoted by a dashed arc in Figure 5c (00:36).
Darkening areas are pronounced in Figure 4 (c,d, f–h). Some of them, mostly short-lived once, coincide with dark features like surges visible in H images (1–6, the same numbering). Some others are different, e.g., 7 and 8 and, especially, deep, long-lived dimmings. They show up as two regions D1 and D2 near the post-eruptive arcade, a dark arch between their tops, and a V-like dark feature on top of the arch. Comparison of panels h, a, and e shows that these deep, long-lived dimmings are due to significant darkening or disappearance of rather compact coronal structures, which were previously bright. Dimmings of shorter lifetimes with counterparts in H images are probably due to absorption of the 195 Å emission in the ejected material. A shallow depression (SD) moving toward the North Pole is faintly visible in fixed-base difference images (Figure 4d,g,h).
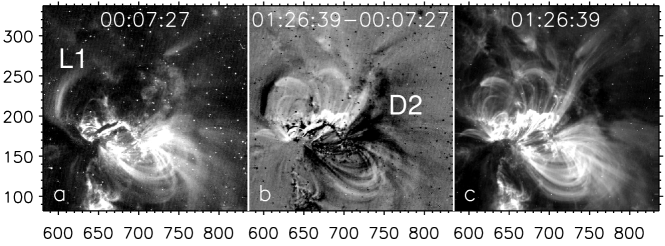
The field of view of TRACE is insufficient to cover dimmings D1 and D2. TRACE 173 Å images in Figure 6 show that the arch-like dimming is due to eruption of loop L1. Dimming D2 is due to changes of the loop system near the western leg of the filament. The TRACE 173 Å and EIT 195 Å bands are different that explains some dissimilarity of their images.
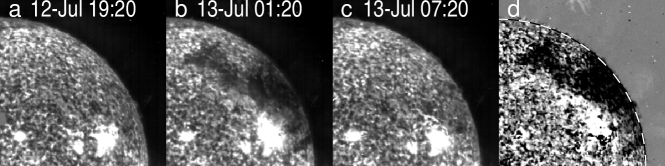
2.4 Large-Scale Darkening in the SOHO/EIT 304 Å Channel
SOHO/EIT observed a large-scale darkening at 304 Å in a single frame at 01:20. Figure 7a–c shows three sequential full-disk images produced in the 304 Å channel. They are separated by 6 hours that rules out a possibility to study development and motion of the dark feature. It is certainly absent in the first (a) and last (c) frames, being well pronounced in frame b. Figure 7d shows a difference of frames b and a. Both positive and negative pixel values are restricted. The area bounded by the level is 6.7% of the solar disk, and the deepest depression reaches . The configuration of the large-scale darkening at 304 Å is completely different from those observed in the 195 Å band.
2.5 Ejecta Observed with NoRH at 17 GHz
The flare produced a strong microwave burst at 17 GHz, with its main phase lasting until 00:19 and a maximum brightness temperature up to K. To reveal faint moving features, we produced enhanced-sensitivity NoRH images at 17 GHz with an integration time of 1 min. Figure 8 shows some of them. Moving features are still poorly visible, especially by cessation of the flare. Using extra averaging over three frames and subtraction of an image averaged during 01:41–01:50, it is possible to detect two moving features in 17 GHz images.
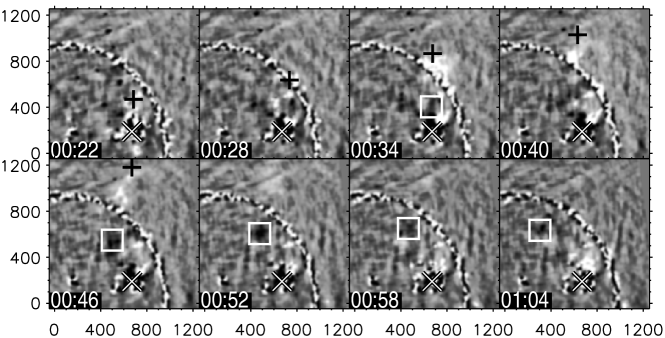
One of them is dark and moves toward the North Pole (white squares mark its center). Its lowest brightness temperature reaches 6 000–8 000 K against the quiet Sun’s background (10 000 K at 17 GHz) pointing at its large optical thickness and, consequently, the kinetic temperature of K. Another feature is bright and moves up in the plane of sky. Black crosses mark its roughly measured leading edge. It becomes pronounced after leaving the solar disk. This is probably due to its overlap with the dark feature, when both of them are not far from the eruption region. Thus, this feature is probably optically thin. Its brightness temperatures are 400–5 000 K; hence, its kinetic temperature is probably 5 000 K. Its estimated velocity is km s-1, close to the speed of the bright feature F1 visible in TRACE 173 Å images. Their trajectories are also close (see Figure 11). The bright NoRH feature resembles in shape the foremost bright envelope observed by TRACE at 00:15:20 (see Figure 3i). Although the NoRH feature is not detectable during TRACE observations because of bright flare emission, these facts demonstrate the NoRH and TRACE bright features to be identical (some dissimilarities are due to their different temperature responses).
2.6 CME in SOHO/LASCO/C2 Images
LASCO/C2 & C3 observed a CME with a central position angle of in many frames from 00:54 onwards. The CME was classified in the Preliminary 2004 SOHO LASCO Coronal Mass Ejection List111ftp://lasco6.nascom.nasa.gov/pub/lasco/status/LASCO_CME_List_2004 as a ‘partial halo’. Figure 9 presents four LASCO/C2 images. A bright part of the CME has an angular span . The spatial structure of the CME does not match a classical three-component one. Its components do not resemble a self-similar structure with each one being inside another one. No cavity is detectable. The foremost part of the CME does not resemble a well-defined frontal structure. It consists of diffuse, faint material, inside which an interconnected structure is visible (frame f).
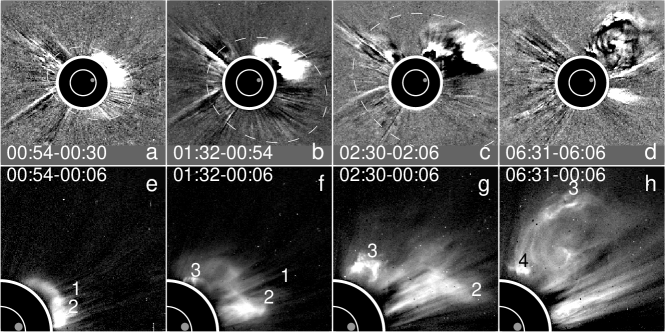
The fastest spike-like feature 1 was used for measurements in the SOHO LASCO CME Catalog222http://cdaw.gsfc.nasa.gov/CME_list/; its linear-fit speed is 409 km s-1. Labels 2 and 3 mark the brightest components of the CME. Rotation of feature 3 determines its helical structure. The ejected material is detectable around almost the whole occultor, but it is faint in position angles , even relative to the foremost NW part (the fainter, faster SW part is listed in the SOHO LASCO CME Catalog as another CME). White dashed ovals in Figure 9 roughly outline the whole CME. Outflow of the ejected material continues a few hours (e.g., feature 4 in frame h).
Feature 3 appears from behind the occultor at a position angle corresponding to the trajectory of bright NoRH and TRACE features. Their shapes are rather similar. The position angle of feature 2 roughly corresponds to TRACE feature F2 and the bright sector visible in the EIT 195 Å image at 00:24.
2.7 Total Flux Radio Data
Records of total radio flux made with Nobeyama Radio Polarimeters (NoRP) and in Learmonth and Ussuriysk Observatories show a strong burst to start at about 00:12:20 and reaching 1200 sfu at 17 GHz. Then, after 00:30–00:40, a post-burst decrease is observed at frequencies GHz by 01:15–01:50 (Figure 10). The duration of the ‘negative burst’ is minimal at 5 GHz and increases toward lower frequencies as well as the depression depth, from 5% at 5 GHz to 12% at 1 GHz. The deepest depression occurs at 00:55. The large-scale darkening is registered in the EIT 304 Å channel at the final stage of the ‘negative burst’.
Thermal free-free emission of post-flare loops contributes to the total flux. The dotted lines in Figure 10 show the total flux records without this contribution. To estimate it, we computed emission measure and temperature, , from soft X-ray GOES data following White, Thomas, and Schwartz (2005). The size of the soft X-ray emitting region was found from GOES/SXI images, and a geometrical depth, cm, estimated from its area, . The optical thickness at a frequency , , was determined from an expression
| (1) |

2.8 Overall Picture of Near-Surface Activities
Figure 11 presents an overall picture of large-scale disturbances observed on the solar disk and in its closest vicinity during and after the 13 July 2004 eruptive event. The figure summarizes observations in the H line, in 195 Å, 304 Å (EIT), and 173 Å (TRACE) bands as well as at 17 GHz (NoRH).
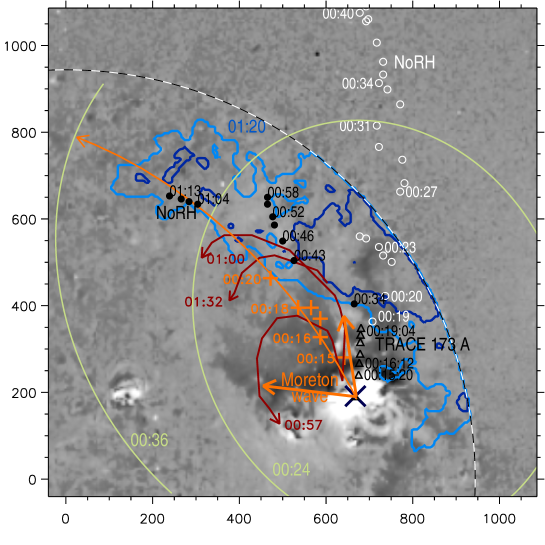
The event starts at 00:02:30 with stretch of a filament or two ‘merged’ ones. During its steady rise, flare energy release starts by 00:13:40 beneath. The filament explosively erupts at about 00:15. The explosion produces Moreton and ‘EIT’ waves, which run faster than all other observed disturbances. Dark fragments of the filament form surges or fly mostly north, even reaching vicinities of the North Pole. One portion of the bright material moves up in the plane of sky, while another one moves west-northwest. The former portion is traceable in TRACE and NoRH images from the eruption site up to the edge of the field of view. The latter portion is only detectable in EIT 195 Å images.
3 Absorption
As multi-spectral data show (Figure 11), fragments of the eruptive filament dispersed over a large area could be responsible for absorption phenomena observed in radio range (‘negative burst’), H (surges), and EUV at 195 Å and 304 Å. In this section, we estimate parameters of the absorbing material and find out if it is possible to reconcile all mentioned manifestations. We then compare the estimated masses of the absorber and the CME.
3.1 Simulation of Radio Absorption
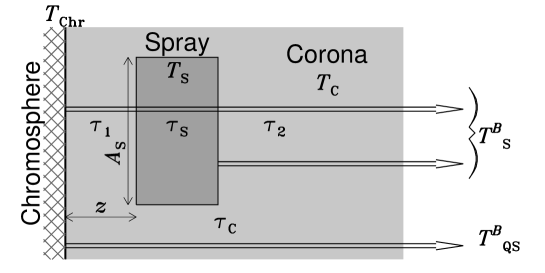
We simulate the ‘negative burst’ using a simple four-layer model with a uniform absorbing slab (Figure 12). The model contains 1) the chromoshpere, 2) the ‘spray’ of area ‘inserted’ into the corona, 3) a coronal layer of depth between the chromosphere and spray, and 4) a coronal layer between the spray and observer. The ratio of the observed flux to the quiet Sun’s total flux is
| (2) |
is the quiet Sun’s area. We used frequency dependencies of the quiet Sun’s radio radius and brightness temperature found by Borovik (1994). Superscripts ‘’ denote brightness temperatures to distinguish them from kinetic ones. Since the brightness temperature after each layer is a sum of its own emission and a non-absorbed remainder emission from preceding layers, the observed brightness temperature, , of the spray with a kinetic temperature is
| (3) | |||
where is determined by expression (1), , with being the total optical thickness of the corona at a given frequency, , the height of the uniform atmosphere, Boltzmann constant, the height of the absorbing layer above the chromosphere, the average mass of ions, and the gravity acceleration at the photosphere, the gravity constant, the mass of the Sun.
Using this model, we fitted the radio absorption depth measured from multi-frequency records (Figure 10) for two instances, the maximum radio absorption (00:55) and EIT observation at 304 Å (01:19). The results are shown in Figure 13 with best-fit parameters. The model is rough; nevertheless, variations of parameters of cause detectable discrepancies with observations.

With an optical thickness evaluated, a density and mass of the absorber could be estimated if its geometrical depth was known. The latter can be found from several facts. One estimate is the POS distance of the overturn of feature 3a, 190 Mm (Section 2.1); with the position of the active region, it is expected to be comparable with its height. The time of the overturn, 00:38–00:40, provides a better estimate. Since the maximum height is large, we used general expressions with an inconstant for a free fall time from the heliocentric distance to , velocity at , and :
| (4) | |||
Using these expressions, we find the height of the overturn to be 180 – 200 Mm and the initial velocity of 350 – 380 km s-1, reasonably close to the measured POS parameters of the filament. From the height and time of the overturn, a height at 00:55 is 100 – 130 Mm. With Mm estimated from the model, the geometrical depth is 70 – 100 Mm, and from expression (1) we find the density of cm-3 and the mass of g at that time.
It is difficult to estimate the depth at 01:19 from observations. We speculate that the height at that time was significantly less than it at 00:55 was — e.g., Mm. On the other hand, there is no reason for the absorbing cloud to be a thin film located at a height of 10 Mm (from the model); therefore, we assume its depth to be Mm (most probable 10 – 20 Mm). With these depths, we get limits for the density of cm-3 and mass of g; most probable are cm-3 and g.
3.2 Absorption in H and EUV
H opacity is due to neutral hydrogen absorbing continuum radiation of underlying atmosphere. Mein et al. (1996); Heinzel, Mein, and Mein (1999); Molowny-Horas et al. (1999), and Tziotziou et al. (2001) calculated physical parameters in stationary or slowly moving cool clouds like filaments on the basis of a non-LTE radiative transfer approach. Heinzel, Schmieder, and Tziotziou (2001) and Heinzel et al. (2003a) studied relations between opacities in H and Lyman continuum at 912 Å and proposed an approximate expression to estimate the hydrogen density from the optical thickness at the H line center. The Doppler-brightening effect decreases absorption of moving prominences, when line-of-sight velocities exceed km s-1. The Doppler shift of the H absorption line exceeds the bandwidth of the BBSO H 0.5 Å Lyot filter at a lower velocity of km s-1.
A spectroscopic model for absorption of EUV emission in filaments and prominences was developed by Heinzel et al. (2003a,b), Anzer and Heinzel (2005), and Schwartz et al. (2006). They showed that the EUV opacity is due to photoionization of hydrogen (below the edge of the Lyman continuum, 912 Å), neutral helium ( Å), and ionized helium ( Å). Absorption of continuum does not depend on radial or turbulent velocity. For 195 Å, we take an average absorption cross-section of a ‘cloud’ consisting of 92% of H and 8% of He, cm2, which varies within 30–40% in a temperature range of K (we calculated the absorption cross sections for 195 and 304 Å using Table 2 and expressions (7) and (9) from Anzer and Heinzel, 2005). Along with absorption, darkening in coronal lines could be due to a volume blocking effect (VBE), i.e., the absence of a coronal radiation from the volume of the cloud. This effect depends on the height and depth of the cloud relative to a height scale at a given wavelength. For 195 Å, a typical radial height scale is Mm, and for our position angle, , the line-of-sight height is Mm.
We computed the hydrogen density from the optical thickness in the H line center assuming a line-of sight velocity km s-1, a turbulent one km s-1, temperature 8 000 K, and depths of absorbing fragments to be equal to their widths. Figure 14 presents masses estimated from absorption of all emissions considered. The mass estimated from H increases from 00:14 by 00:30 and then decreases likely because velocities of fragments become km s-1.

To estimate the opacity at 195 Å, we analyzed EIT difference images (subtrahend is 12 July, 23:59:57) in the interval of 00:12–02:00. Regions of probable absorption were found as depressions below level, where was computed as an r.m.s. over negative pixels of darkening regions in the NW quadrant only. The regions revealed in this way contained long-lived dimmings (e.g., D1, D2), which were unlikely to be due to absorption. We identified them from the difference image at 02:00 and excluded from computations. The mass estimated from 195 Å images reaches a maximum of g at 00:35 and then diminishes. The estimations miss some fragments of the ejecta that crossed the long-lived dimmings and could contain 20–30% of the total mass. A noticeable part of the ejected mass could be contained in hot ionized plasmas of the transition layer between cold absorbing material and ambient corona (analogous to an EUV filament channel) seen in TRACE 173 Å as a bright contour. We did not consider the VBE, because the depth of absorbing fragments was .
A large depression area at 304 Å (01:19, see Figure 7) shows a part of ejected material to return back onto the Sun. The same selection criteria as for 195 Å were applied. A mean brightness ratio to the pre-event image in the whole region is about 0.54, while in its significant part the ratio is noticeably below 0.5.
Absorption at 304 Å can be due to photoionization of H and Hei by continuum or due to resonant scattering of the Heii line in He ions. The latter mechanism cannot provide the absorption ratio : the cloud emits resonant photons in angle, while incident photons come from below and lateral directions, i.e., . Also, the resonant scattering is very sensitive to the line-of-sight velocity: the Doppler shift exceeds a typical width of the Heii 304 Å line if km s-1. Absorption of the continuum is more probable (cross section cm2), and the mass is g (triangle in Figure 14).
The closest 171 Å (01:00) and 195 Å (01:25) images do not show absorption in the 304 Å darkening region (absorption at 195 Å occurs in other regions). At this time, the cloud was likely in between of the heights of Heii 304 Å illumination and coronal loops responsible for the 171 and 195 Å emissions, as absorbing flows in TRACE 173 Å images show. Low clouds with a temperature close to the chromospheric one, 10 000 K, are not detectable in radio range also.
The CME mass estimated using LASCO software reaches g at 04:06. Correction due to the off-plane direction of the CME (Vourlidas et al., 2000) of gives its real mass of g. A lesser mass of g in the SOHO LASCO CME Catalog is related to the faint SW part (see Figure 9a–c).
The estimates of the mass of the ejecta from absorption of different emissions agree with each other within their accuracy and limitations of methods. The masses of the CME and the returned part are close. Thus, the ejecta disintegrated into parts with comparable masses, one of which flew away, while another one fell back onto the Sun. One might ask if the absorbing cloud left the Sun later and was observed as feature 4 in Figure 9h. However, its estimated mass is g, much less than the mass of the cloud. This rules out such a possibility.
4 Kinematics
In this section, we choose analytic expressions to describe kinematics of a wave expanding from the eruption site and mass fragments flying away. Their birth in a single process is certain, but their subsequent interrelation is vague, i.e., it is not clear if a piston existed to determine the motion of the wave. The oval shape of the wave front disfavors the role of the faint NW sector in the EIT image at 00:24 as a piston. The wave and fragments appear to move independently. Deceleration of mass fragments, constituting the CME, points at importance of gravity. This also shows up in the fact that a part of the ejected mass falls back and produces a cool absorbing ‘screen’ to cover a significant part of the Sun.
4.1 Approach
We use a self-similar approximation of the expansion of mass fragments. Low (1982, 1984a,b) first applied it to expansion of a CME. Uralov, Grechnev, and Hudson (2005) derived expressions convenient to compare with observations that apply independent of the presence of a CME-driven coronal shock. If it is present, then CME parts are assumed to be confined by a contact surface, which is also a surface of a moving piston. A solution belongs to a class of self-similar motions, in which Lagrangian velocities of pieces of mass are proportional to their distances from the center of expansion, (see also Sedov, 1981, p. 318).
To describe wave-like phenomena, we employ concepts of self-similar theory of a point-like explosion (e.g., Sedov, 1981; Zel’dovich and Raizer, 1966). Such an explosion produces a strong shock wave in the ambient medium.
A crude example to combine both these approaches is an air explosion of a bomb consisting from a charge and a shell. The outcome is a shock wave and fragments of the shell flying away. They expand synchronously during the explosion and move independently afterwards.
4.2 Mass Fragments
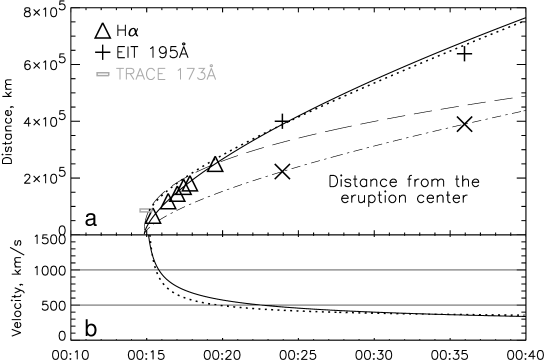
As Section 2.8 shows, some counterparts of CME features are detectable on the Sun or nearby. Figure 15 shows distance-time points measured in POS from TRACE, NoRH, and LASCO data. The best coverage has feature 3 (see Section 2.6) and its counterparts. A quasi-periodical component in plots of all LASCO features is due to their rotation. It complicates measurements and decreases their accuracy.

Expression (A8), , from Uralov, Grechnev, and Hudson (2005) with and gives :
| (5) |
This expression shows that with the increasing distance, the deceleration of all features monotonically decreases up to zero. Therefore, no polynomial fit of the measured data points applies. To compare results with observational data, a few parameters are necessary; the initial and asymptotical velocities, and ; the initial size of the ejecta, ; and origins of measurements both in space and time. The origins are known with a satisfactory accuracy (see Section 4.4; start time of 00:14:50). The can be estimated from Figure 15 (it is 409 km s-1 for feature 1 according to the SOHO LASCO CME Catalog). The for feature 3 can be found from TRACE and NoRH data points. Obviously, . The parameters could be only found in attempts to obtain a good fit. The curves in Figure 15 were obtained with the following parameters:
LASCO feature 1: Mm, km s-1, km s-1;
LASCO feature 2: Mm, km s-1, km s-1;
LASCO feature 3: Mm, km s-1, km s-1.
These parameters provided a satisfactory fit for each of the three features visible in LASCO images, with the accuracy being worse for features 1 and 2, whose counterparts are poorly identified at/near the Sun.
4.3 Wave – Uchida’s Model: Weak Fast Mode
The almost perfect oval shape of the brightening in the EIT 195 Å image at 00:24 and its expansion visible in the next image at 00:36 suggest its wave-like origin and association with the Moreton wave. The following facts also support this: (i) its configuration is different from the main CME components, in particular, (ii) its eastern part is roughly as bright as the western part, if not exceeds it, whereas the eastern CME part in LASCO/C2 images is much fainter than its western part, and (iii) the apparent velocity of the oval, km s-1, is comparable with the Moreton wave’s one. This possibility was previously discussed by, e.g., Hudson and Warmuth (2004) and Warmuth et al. (2001, 2004a, 2004b).
According to the original Uchida’s (1968) idea, Moreton waves are excited by coronal waves, being their skirts. Uchida (1968) considered a weak short fast-mode MHD wave to propagate in a radially-symmetric corona, with the Alfvén speed increasing with height. This caused refraction of rays into regions of lower Alfvén velocity, toward the solar surface, and turned the wave front down. This model predicted acceleration of Moreton waves. However, Warmuth et al. (2001, 2004a) found their systematic deceleration (Yamaguchi et al. (2003) reported acceleration of a Moreton wave in its propagation into a coronal hole). Their observed velocities are sometimes too high for weak fast-mode MHD waves. These inconsistencies with observations do not appear to rule out weak fast-mode MHD waves completely, but encourage to search for another possibility to match observations better. Warmuth et al. (2001, 2004a, 2004b) and Hudson and Warmuth (2004) proposed blast waves to be responsible for Moreton waves and, probably, some ‘EIT waves’.
4.4 Wave – Strong Shock
We use estimative expressions from a theory of a strong point-like explosion in a variable-density medium. A rigorous analysis of this gas dynamic task was carried out by Sedov (1981). Self-similarity of the solution is ensured by a large pressure excess inside the volume confined by the shock front over non-disturbed medium. If the magnetic field in ambient plasma is strong, then the profile and shape of the shock front change. This change is small for a strong shock, because the increase of the magnetic pressure in the shock is determined by extreme plasma compression, whereas gas pressure is unlimited. Also, the magnetic field in our case is weak, because the disturbance propagates over quiet Sun’s regions.
Kinematics of a single-pulse spherical blast wave is governed mainly by pile-up mass. We consider propagation of a self-similar blast wave excited by an explosion of an energy in media (a) with constant density, and (b) with a radial density falloff from the explosion center, .
-
1.
For a constant density, : ( radius and velocity of the shock front), with corresponding to constancy of potential to kinetic energy ratio for plasma involved into self-similar motion. Thus, , and .
-
2.
Similarly, for : . Consequently, , and
(6)
A strong spherical shock decelerates if and accelerates if . Thus, , with for a homogeneous medium () and for a medium with . To compare expression (6) with measured points of the Moreton wave, we use expression (6) in a form . Here is the distance between the origin of measurements and explosion center, the corresponding time, and , are related to one of measured points.
Figure 16 shows the results. Triangles denote the Moreton wave, straight crosses denote distances of the EIT oval from the eruption center measured in the same direction, slanted crosses show measurements of the EIT oval toward the solar disk center, and a rectangle presents the first manifestation of the wave in a TRACE 173 Å image (width: exposure time, height: positional uncertainty). The Moreton wave is expected to slightly lag behind the coronal wave (Vršnak et al., 2002), as the TRACE and H fronts show. We used the last point of the Moreton wave as a reference one . The dashed curve corresponding to shows much stronger deceleration than actually observed. A good fit is achieved with () and a start time of 00:14:50 s for both the Moreton and ‘EIT’ waves. The positional uncertainty of the explosion center is Mm; origins of both the position and time are close to the observed eruption ones. The difference between distances measured along the arc on the sphere in Figure 11 and POS distances in the same direction does not exceed measurement errors.
The kinematical closeness of the Moreton and ‘EIT’ waves confirms their common nature, and agreement with the calculated plot supports their origin due to coronal blast shock. Note that data points of the ‘EIT wave’ suggest a stronger deceleration, implying a density falloff at longer distances.
The calculated instant shock speed in Figure 16b can be compared with estimates from type II bursts listed in Solar Geophysical Data333http://sgd.ngdc.noaa.gov/sgd/jsp/solarindex.jsp. The estimates decrease from 1000 km s-1 at 00:17–00:20 (Culgoora) via 850 km s-1 (00:16–00:40, Learmonth) to 550 km s-1 at 00:27–00:41 (Holloman). Such estimations use model plasma densities, which are uncertain. Nevertheless, the calculated shock speed and estimations from type II bursts are in overall agreement. This supports the same origin of the Moreton wave, ‘EIT wave’, and the type II radio burst, likely associated with the same decelerating coronal blast shock, as Warmuth et al. (2001, 2004a, 2004b) concluded (however, Pohjolainen, Hori, and Sakurai (2008) interpret this type II burst to be due to two distinct shocks).
Our plot in Figure 16 was obtained under assumptions of (1) a strong shock and (2) an omnidirectional density falloff from the eruption site. Their agreement with observations appears to be surprising, because a horizontal density falloff is not expectable at large distances. We discuss this issue in the next section.
We also fitted the oval envelope of the CME with expectable for a coronal shock propagating outward: at heights of , the density in the corona above an active region falls off ( the distance from the photosphere) according to Newkirk model (Newkirk, 1961), and from a model compiled by Gary (2001). This fit is close to the motion of LASCO feature 1. Note that with and , expressions (5) and (6) predict the same height-time plots. Poor measurement accuracy does not allow to distinguish between the wave and mass fragments. Their closeness is also possible.
4.5 Comments on a Realistic Situation
We come to the following possibilities for the Moreton wave.
1. Uchida’s (1968) refraction model is a linear acoustic approximation, which is very sensitive to variations of plasma parameters. This model predicts acceleration of a wave that does not correspond to the observed situation.
2. Strong shock wave: gas velocity behind the wave front (Lagrangian velocity; it is presented by subsequent motion of loop in TRACE images, Figure 3, km s-1) is much higher than the ambient fast magnetosound speed, . This strongly non-linear wave is mainly sensitive to density distribution. Deceleration naturally appears and critically differs if the wave runs along, against, or across the density gradient. To explain propagation of the Moreton wave, we assumed a spherically-symmetric coronal density falloff from the explosion center. In this case, the wave runs contrarily to the density gradient, and its deceleration is determined by expression (6). This resulted in a good fit with . Otherwise, the deceleration is too strong, as the following considerations show.
The Moreton wave runs horizontally, presumably being a skirt of a coronal shock front. With a constant density at a fixed height, a strong shock decelerates even faster than expression (6) with predicts. To roughly estimate this case, we consider a vertically-stratified atmosphere with an upward density falloff of . Here, the coronal part of the Moreton wave runs across the density gradient. The front of a blast wave in such atmosphere is not a spherical one; its initially vertical parts in propagation progressively incline down at the same height. We assume pressure to be uniform inside a volume confined by the shock front, , with being the vertical extension of the wave surface. Its variation is determined by expression (6). In a strong shock, , where is a velocity of the front along a constant-density surface, . With , , and . After the fast onset, such a shock rapidly decelerates up to (cf. a typical speed of ‘EIT waves’).
Besides a spherically-symmetric density falloff, a high horizontal deceleration of a strong shock could be prevented if a piston moved properly in the same direction (cf. Low, 1984a). If a self-similar solution does exist, then a piston and wave of a common origin diverge slowly. Indeed, the velocity of the strong shock front is with the polytropic index and the Lagrangian plasma velocity just behind the shock front. The velocity of the contact discontinuity is with the Lagrangian plasma velocity within the discontinuity. In such self-similar motions, . From these expressions, , and the ratio of distances of the shock front and the piston from the explosion center is . Initially , and then the ratio increases slowly; both the piston and wave are expectable to be not far from each other in images, which we showed. However, the wave appears to have run far away well before the first appearance of mass behind it. A blast wave is also favored because the initial velocities of the ejecta do not point in the same direction as the EIT oval.
An omnidirectional density falloff seems to be possible near the active region, but unlikely at long distances. A possible solution of the problem is subsequent damping of a strong shock to a moderate or weak one. The weak shock runs along rays determined by the spatial distribution of , which, in turn, depends on the density distribution. The speed of the weak shock depends on the density gradient along the ray (e.g., horizontal) rather than on the crosswise (vertical) gradient. Just the vertical density gradient caused the extreme deceleration of a strong shock propagating horizontally, that was considered above.
3. Weak shock: gas velocity behind the wave front is . Propagation of a spherical weak shock in a uniform plasma calculated using expressions from a paper of Uralova and Uralov (1994) is shown in Figure 16 by dotted lines for km s-1 and the phase speed of the wave at its first manifestation of km s-1. This curve matches the coronal wave, whereas at shorter distances its agreement with the Moreton wave is worse. The initial speed is too high for the approximation of a weak shock, suggesting a medium-intensity shock.
4. Shock of a moderate intensity. This intermediate case is difficult to calculate. The curves in Figure 16 imply that the wave is initially a rather strong one, and, after some transitional stage, it becomes weak.
5. Large-amplitude simple wave (without discontinuity). We calculated this case for a uniform density distribution formally using a solution for a simple wave and a spherical wave front. The simple wave has a distance-time plot close to the weak shock fit in Figure 16; its velocity is less at short distances. However, the solution of a simple wave rapidly becomes incorrect. Estimations show that the shock discontinuity appears either during formation stage of the wave disturbance, or just afterwards. To fit the calculated distance-time plot to experimental data points in Figure 16, the maximum Lagrangian velocity must be a few times higher than . The appearance of a type II burst as early as at 00:16 – 00:17 was probably due to the rapid steepening the wave into a shock.
All these curves match more or less observations. Data available do not to permit us to find out a particular type of a wave. The spherical strong shock in decreasing density matches observations better and seems to apply at moderate distances. We therefore use it in our subsequent discussion of the Moreton wave.
The fact that the best fit for the Moreton and ‘EIT’ waves corresponds to is probably accidental. Our idealized assumptions certainly affect results. We assumed a strong blast wave and a radial density falloff from the explosion center, which in reality might be anisotropic and probably variable. The shape of the wave front is also important; the pile-up mass grows with distance in a spherical wave faster than in a cylindrical or a flat wave.
Some range of parameters is expectable in observations. Warmuth et al. (2001, 2004a, 2004b) found average power-law indices for Moreton waves’ distance-time plots of 0.57 – 0.62 corresponding to density falloffs of for spherical waves. The whole range of the measured indices was mainly from 0.41 to 0.91 () with two exceptions of 0.29 and 0.34. Both last events were located on the limb that made correct identification of wave fronts difficult; however, such strong damping and deceleration were, in principle, possible if explosions occurred in media with uniform horizontal density distributions.
The power-law distance-time relations found by Warmuth et al. (2001, 2004a, 2004b) and in our event are expectable for coronal blast waves, in accord with a result of Balasubramaniam, Pevtsov, and Neidig (2007) and the original idea of Uchida (1968) in a general form. Excitation of a filament by a Moreton wave from its upper edge in the 6 December 2006 event also could be due to an incident coronal front inclined down (Gilbert et al., 2007). The nature of Moreton waves due to self-similar coronal shocks is supported by linear growths of wave front thicknesses with distances found by Warmuth et al. (2001, 2004b, 2005) in some events. It is also supported by correspondence with LASCO data.
5 Discussion and Conclusion
5.1 Overall Scenario of the Event
The event started with a steady rise of a filament in the active region. Then an explosive eruption occurred probably due to mergence of two close filaments. Uralov et al. (2002) argued explosive development of MHD instability in such situation; Hansen, Tripathi, and Bellan (2004) confirmed this experimentally. The eruption was likely driven by MHD forces, because the filaments remained cool. The fastest observed feature with a POS acceleration km s-2 was bright, which means that, at least, its parts were at coronal temperatures.
The initial energy of the ejecta was partially spent to disperse the filaments over a large area. The remainder energy was insufficient for all fragments to overcome gravity; both escaping and returning features were observed. The importance of gravity is manifest in deceleration of all observed features. Since the ejecta disintegrated, the CME did not resemble a classical three-part structure with a self-similar frontal structure, cavity, and core. One part of the ejecta escaped as the CME, and another one fell back onto the Sun. Masses of both parts were close. The latter part consisted of fragments of filament(s) dispersed into a cloud covering almost the whole NW quadrant. The cloud absorbed background emissions that was observed as moving EUV dimmings and a ‘negative radio burst’. The cloud later fell back onto the solar surface, slipping along magnetic field lines. Other fragments produced surges visible in H up to heights of 200 Mm. The initial speeds of the fastest parts of filaments were less than the speed of their bright envelope ( km s-1 in the plane of sky) by 30–50%; fragments of their legs moved still slower. The cooler material after the explosion was affected by gravity only, had not exceeded the escape velocity (618 km s-1), and mainly fell back. All observed returning features were cool, while no falling hotter material was seen. By contrast, all observed escaping features were significantly hotter, at about coronal temperatures, and just they had counterparts in LASCO images. Since masses of escaping and falling parts were comparable, the CME was mainly at 1 MK, while the returned part was mostly cool, at K.
The explosion produced a decelerating coronal blast shock. The presence of a wave is demonstrated by a displacement of loop L1 in Figure 3i,j, when the ejecta was far from it. The skirt of the shock was seen as a Moreton wave decelerating from the initial speed of to km s-1, while it was observed. At longer distances, the shock was observed as an ‘EIT wave’ with a speed of km s-1.
The initial magnetic structure was closed and confined inside the filament(s). After the eruption, dispersed fragments flew along lengthy field lines toward the North Pole and landed on a huge area. Some magnetic structure was carried away by the CME, as rotation of its component demonstrates. It is difficult to reconcile these facts without magnetic reconnection, but its role in the event is not quite clear. Probably, just the destruction of the magnetic configuration could cause dispersing the ejecta rather than its ejection as a whole. Anyway, reconnection does not seem to be directly related with the observed ‘EIT wave’ and dimmings.
5.2 Comments on Nature of Large-Scale Disturbances
The bright oval ‘EIT wave’ in this event was likely due to the coronal blast shock as follows from its kinematics, which agrees with the motion of the Moreton wave and theoretically expected propagation of the shock. The spheroidal shape of the wave front and correspondence to parameters of the type II radio burst confirm this conclusion. Quantitative parameters inferred in our analysis and results of other authors obtained for several ‘Moreton & EIT wave events’ show them to be mainly consistent with their origin due to coronal blast shocks. They are probably moderate-intensity ones or strong shocks subsequently damping to moderate waves. Shocks compress (hence brighten) and heat plasmas. Manifestations of heating were presumably found in observations of some ‘EIT waves’ (Grechnev et al., 2005; see also Warmuth, Mann, and Aurass, 2005).
Other large-scale transients of low brightness (visible in Figure 5b north, north-northeast, east-southeast of the eruption center, and a sector above the NW limb) moved slower, had different shapes, and were probably due to a different reason. On-disk brightenings could be similar to the off-limb feature. However, they could be due to some processes in low coronal layers, i.e., different from the off-limb feature. Their nature is not clear.
Two kinds of dimming were observed. Shallow dimmings moving behind the oval ‘EIT wave’ front were due to absorption of the Sun’s background emission in the moving ‘cloud’ of filament fragments, as quantitatively confirmed. By contrast, deep, long-lived dimmings D1, D2 in Figures 4,6 were due to significant changes of previously bright coronal loops. Figure 4 shows that dimming D2 was too large to be due to displacement of loops. A plasma density decrease is the most probable (if not the only) reason that can occur in two cases. (a) Previously closed loops open or stretch into interplanetary space that results in plasma outflows. (b) Loops slightly stretch, but do not significantly change. As can be seen, with the same number of particles in a loop, a change of its volume from to correspondingly changes emission measure, . Thus, stretch of a loop decreases its brightness. In summary, deep, long-lived dimmings are likely due to density decrease in coronal structures and obviously cannot travel. These conclusions agree with those of Chertok and Grechnev (2005a).
5.3 Estimations of Mass from Absorption
We estimated the mass of the ejected ‘cloud’ from absorption in the radio range, in the line, and in EUV lines of 195 Å and 304 Å. All these methods supplied close results, from which we conclude that the mass of the ‘cloud’ was g, a typical mass of a filament. The mass of the CME was g, also typical of CMEs. This implies that such a spectacular event was unlikely an exceptional one. On the other hand, consistency of the estimates obtained by means of these methods demonstrates that they offer a promising way to evaluate masses of on-disk ejecta.
Each of these methods has advantages and limitations. H images distinctly show absorbing features, but estimations are constrained to low temperatures and velocities and need unknown geometrical depths. Estimations from 195 Å emission are not velocity dependent, but they do not say much about the temperature of the absorber and fail at low heights. Estimations from the 304 Å emission are sensitive up to the transition region, but crucially depend on temperature and absorption mechanism (velocity dependence is important for the resonant scattering). Estimations from multi-frequency radio data need unknown geometrical depth and fail at low heights, but they allow to estimate the temperature of ejecta in a wide range and do not depend on velocity.
5.4 Summary and Concluding Remarks
From multi-spectral data, an overall picture of the 13 July 2004 eruptive event was reconstructed and confirmed by quantitative estimations. An explosive filament eruption occurred in an active region. The ejecta disintegrated into two parts of comparable masses, one of which flew away as a decelerating CME, and another part dispersed over almost the whole NW quadrant of the visible solar disk. The latter part absorbed background solar emission that was observed as widespread faint moving dimmings at 195 Å, a ‘negative’ radio burst, and a huge dimming at 304 Å. By contrast, deep, quasi-stationary dimmings also observed at 195 Å in this event were likely due to density decrease in coronal structures.
Properties of both the Moreton wave and the oval faint front observed at 195 Å in this event are consistent with their origin due to a coronal blast shock produced by the eruption. Our results show what could be reasons for ‘EIT waves’ and dimmings in a particular event, not pretending to apply to all events.
The coronal blast shock, the Moreton wave, and a huge cloud of the dispersed material of filaments were interconnected in our event. It was remarkable, but probably not an exceptional one. CMEs produced in such events are not expected to accelerate. A polynomial fit is inappropriate to analyze their kinematics.
Important information about eruptive phenomena could be obtained using the following methods. Radio observations in a range of 1–10 GHz can supply parameters of ejecta (multi-frequency imaging observations would be especially valuable). Space-borne 304 Å and H observations with an interval of min would be important. Masses of on-disk ejecta can be estimated from absorption.
\acknowledgementsname
We thank V. Yurchyshyn for supplying us with BBSO H data and I.L. Beigman, M.A. Livshits, S.A. Bogachev, S.M. White, F. Auchère, G.V. Rudenko, H.R. Gilbert, S. Pohjolainen, and B. Kliem for useful discussions. We thank the anonymous reviewer for valuable remarks.
We used the CME catalog generated and maintained at the CDAW Data Center by NASA and The Catholic University of America in cooperation with the Naval Research Laboratory. SOHO is a project of international cooperation between ESA and NASA. We also used data of the Big Bear Solar Observatory/New Jersey Institute of Technology, the Mauna Loa Solar Observatory/High Altitude Observatory, the Nobeyama Solar Facilities, the USAF RSTN Radio Solar Telescope Network, and the GOES satellites.
The present study is supported by the Russian Foundation of Basic Research (grants 05-02-17415, 06-02-16106, 06-02-16239, 06-02-16295, and 07-02-00101), the Federal Ministry of Education and Science (grant 8499.2006.2), and the programs of the Russian Academy of Sciences ‘Solar Activity and Physical Processes in the Sun-Earth System’ and ‘Plasma Heliophysics’.
References
- Anzer and Heinzel (2005) Anzer, U., Heinzel, P.: 2005, Astrophys. J. 622, 714.
- Attrill et al. (2007) Attrill, G. D. R., Harra, L. K., van Driel-Gesztelyi, L., Démoulin, P.: 2007, Astrophys. J. 656, L101.
- Balasubramaniam, Pevtsov, and Neidig (2007) Balasubramaniam, K. S., Pevtsov, A. A., Neidig, D. F.: 2007, Astrophys. J. 658, 1372.
- Ballai, Erdélyi, and Pintér (2005) Ballai, I., Erdélyi, R., Pintér, B.: 2005, Astrophys. J. 633, L145.
- Borovik (1994) Borovik, V. N.: 1994, Lecture Notes in Physics 432, 185.
- Brueckner et al. (1995) Brueckner, G. E., Howard, R. A., Koomen, M. J., Korendyke, C. M., Michels, D. J., Moses, J. D., Socker, D. G., Dere, K. P., et al.: 1995, Solar Phys. 162, 357.
- Chen et al. (2002) Chen, P. F., Wu, S. T., Shibata, K., Fang, C.: 2002, Astrophys. J. 572, L99.
- Chen, Fang, and Shibata (2005) Chen, P. F., Fang, C., Shibata, K.: 2005, Astrophys. J. 622, 1202.
- Chertok and Grechnev (2003a) Chertok, I. M., Grechnev, V. V.: 2003a, Astron. Reports 47(2), 139.
- Chertok and Grechnev (2003b) Chertok, I. M., Grechnev, V. V.: 2003b, Astron. Reports 47(11), 934.
- Chertok and Grechnev (2005a) Chertok, I. M., Grechnev, V. V.: 2005a, In K. P. Dere, J. Wang, and Y. Yan, editors, Coronal and Stellar Mass Ejections, Proc. IAU Symp. 226, 167.
- Chertok and Grechnev (2005b) Chertok, I. M., Grechnev, V. V.: 2005b, Solar Phys. 229, 95.
- Covington, A. E. and Dodson, H. W. (1953) Covington, A. E. Dodson, H. W.: 1953, J. R. A. S. Canada 47, 207.
- Delaboudinière et al. (1995) Delaboudinière, J.-P., Artzner, G. E., Brunaud, J., Gabriel, A. H., Hochedez, J. F., Millier, F., Song, X. Y., Au, B., et al.: 1995, Solar Phys. 162, 291.
- Delaboudinière (2005) Delaboudinière, J.-P.,: 2005, In K. P. Dere, J. Wang, and Y. Yan, editors, Coronal and Stellar Mass Ejections, Proc. IAU Symp. 226, 178.
- Delannée and Aulanier (1999) Delannée, C., Aulanier, G.: 1999, Solar Phys. 190, 107.
- Dere et al. (1997) Dere, K. P., Brueckner, G. E., Howard, R. A., Koomen, M. J., Korendyke, C. M., Kreplin, R. W., Michels, D. J., Moses, J. D., et al.: 1997, Solar Phys. 175, 601.
- Dulk (1985) Dulk, G. A.: 1985, Ann. Rev. Astron. Astrophys. 23, 169.
- Gary (2001) Gary, G. A.: 2001, Solar Phys. 203, 71.
- Gilbert et al. (2004a) Gilbert, H. R., Holzer, T. E., Thompson, B. J., Burkepile, J.T.: 2004a, Astrophys. J. 607, 540.
- Gilbert and Holzer (2004b) Gilbert, H. R., Holzer, T. E.: 2004b, Astrophys. J. 610, 572.
- Gilbert and Holzer (2007) Gilbert, H. R., Daou, A., Young, D., Detoma, G., Tripathi, D. 2007, Astrophys. J., submitted.
- Grechnev et al. (2005) Grechnev, V. V., Chertok, I. M., Slemzin, V.A., Kuzin, S. V., Ignat’ev, A. P., Pertsov, A. A., Zhitnik, I. A., Delaboudinière, J.-P., Auchère, F.: 2005, J. Geophys. Res. 110, A09S07.
- Handy et al. (1999) Handy, B. N., Acton, L. W., Kankelborg, C. C., Wolfson, C. J., Akin, D. J., Bruner, M. E., Caravalho, R., Catura, R. C., et al.: 1999, Solar Phys. 187, 229.
- Hansen, Tripathi, and Bellan (2004) Hansen, J. F., Tripathi, S. K. P., Bellan, P. M.: 2004, Phys. Plasmas, 11(6), 3177.
- Harra and Sterling (2001) Harra, L. K., Sterling, A. C.: 2001, Astrophys. J. 561, L215.
- Harra et al. (2007) Harra, L. K., Hara, H., Imada, S. et al.: 2007, PASJ 59, S801.
- Heinzel, Mein, and Mein (1999) Heinzel, P., Mein, N., Mein, P.: 1999, Astron. Astrophys. 346, 322.
- Heinzel, Schmieder, and Tziotziou (2001) Heinzel, P., Schmieder, B., Tziotziou, K.: 2001, Astrophys. J. 561, L223.
- Heinzel et al. (2003a) Heinzel, P., Anzer, U., Schmieder, B., Schwartz, P.: 2003a, ESA SP-535, 447.
- Heinzel et al. (2003b) Heinzel, P., Anzer, U., Schmieder, B.: 2003b, Solar Phys., 216, 159.
- Hudson and Warmuth (2004) Hudson, H. S., Warmuth, A.: 2004, Astrophys. J. 614, L85.
- Hudson and Webb (1997) Hudson, H. S., Webb, D. F.: 1997, AGU Geophys. Mon. Ser. 99, 27.
- Low (1982) Low, B. C.: 1982, Astrophys. J. 254, 796.
- Low (1984a) Low, B. C.: 1984a, Astrophys. J. 281, 381.
- Low (1984b) Low, B. C.: 1984b, Astrophys. J. 281, 392.
- Maksimov and Nefedyev (1991) Maksimov, V. P., Nefedyev, V. P.: 1991, Solar Phys. 136, 335.
- Mein et al. (1996) Mein, N., Mein, P., Heinzel, P., Vial, J.-C., Malherbe, J. M., Staiger, J.: 1996, Astron. Astrophys. 309, 275.
- Molowny-Horas et al. (1999) Molowny-Horas, R., Heinzel, P., Mein, P., Mein, N.: 1999, Astron. Astrophys. 345, 618.
- Moreton (1960) Moreton, G. E.: 1960, Astron. J. 65, 494.
- Nakajima et al. (1985) Nakajima H., Sekiguchi H., Sawa M., Kai, K., Kawashima, S.: 1985, Publ. Astron. Soc. Japan 37, 163.
- Nakajima et al. (1994) Nakajima, H., Nishio, M., Enome, S., Shibasaki, K., Takano, T., Hanaoka, Y., Torii, C., Sekiguchi, H., et al.: 1994, Proc. IEEE, 82, 705.
- Newkirk (1961) Newkirk, G. A.: 1961, Astrophys. J. 133, 983.
- Pohjolainen, Hori, and Sakurai (2008) Pohjolainen, S., Hori, K., Sakurai, T.: 2008, Solar Phys., in press.
- Sawier (1977) Sawier, C.: 1977, Solar Phys. 51, 203.
- Schwartz et al. (2006) Schwartz, P., Heinzel, P., Schmieder, B., Anzer, U.: 2006, Astron. Astrophys. 459, 651.
- Sedov (1981) Sedov, L.I.: 1981, Similarity methods and dimensional analysis in mechanics ( ed.), Moscow, Nauka, 448 pp. (in Russian).
- Slemzin et al. (2004) Slemzin, V., Chertok, I., Grechnev, V., Ignat’ev A., Kuzin S., Pertsov A., Zhitnik I., Delaboudinière J.-P.: 2004, In A.V. Stepanov, E.E. Benevolenskaya, and A.G. Kosovichev, editors, Multi-Wavelength Investigations of Solar Activity, Proc. IAU Symp. 223, 533.
- Slemzin, Grechnev, and Kuzin (2006) Slemzin, V. A., Grechnev, V. V., Kuzin, S. V.: 2006, In ‘Solar Activity and its Magnetic Origin’, Proc. IAU Symp. 233, Cairo, Egypt, 361.
- Slemzin, Kuzin, and Bogachev (2005) Slemzin, V., Kuzin, S., Bogachev, S.: 2005, In D. Danesy, S. Poedts, A. De Groof, and J. Andries, editors, The Dynamic Sun: Challenges for Theory and Observations, Proc. 11th European Solar Phys. Meeting, ESA SP-600, 166.
- Thompson et al. (1998) Thompson, B. J., Plunkett, S. P., Gurman, J. B., Newmark, J. S., St. Cyr, O. C., Michels, D. J.: 1998, Geophys. Res. Lett. 25, 2465.
- Torii et al. (1979) Torii C., Tsukiji Y., Kobayashi S., Yoshimi, N., Tanaka, H., Enome, S.: 1979, Proc. Res. Inst. Atm. Nagoya Univ. 26, 129.
- Tziotziou et al. (2001) Tziotziou, K., Heinzel, P., Mein, P., Mein, N.: 2001, Astron. Astrophys. 366, 686.
- Uchida (1968) Uchida, Y.: 1968, Solar Phys. 4, 30.
- Uralova and Uralov (1994) Uralova, S. V., Uralov, A. M.: 1994, Solar Phys. 152, 457.
- Uralov et al. (2002) Uralov, A. M., Lesovoi, S. V., Zandanov, V. G., Grechnev, V. V.: 2002, Solar Phys. 208, 69.
- Uralov, Grechnev, and Hudson (2005) Uralov, A. M., Grechnev, V. V., Hudson, H. S.: 2005, J. Geophys. Res. 110, A05104.
- Vourlidas et al. (2000) Vourlidas, A., Subramanian, P., Dere, K. P., Howard, R. A.: 2000, Astrophys. J. 534, 456.
- Vršnak et al. (2002) Vršnak, B., Warmuth, A., Brajša, R., Hanslmeier, A.: 2002, Astron. Astrophys. 394, 299.
- Warmuth et al. (2001) Warmuth, A., Vršnak, B., Aurass, H., Hanslmeier, A.: 2001, Astrophys. J. 560, L105.
- Warmuth et al. (2004a) Warmuth, A., Vršnak, B., Magdalenić, J., Hanslmeier, A., Otruba, W.: 2004a, Astron. Astrophys. 418, 1101.
- Warmuth et al. (2004b) Warmuth, A., Vršnak, B., Magdalenić, J., Hanslmeier, A., Otruba, W.: 2004b, Astron. Astrophys. 418, 1117.
- Warmuth, Mann, and Aurass (2005) Warmuth, A., Mann, G., Aurass, H.: 2005, Astrophys. J. 626, L121.
- White, Thomas, and Schwartz (2005) White, S. M., Thomas, R. J., Schwartz, R. A.: 2005, Solar Phys. 227, 231.
- Yamaguchi et al. (2003) Yamaguchi, K., Sakurai, T., Irie, M., Kumagai, K., Hagino, M., Miyashita, M., Shiomi, Y., Hiei, E.: 2003, Rep. Nat. Astron. Obs. Japan, 6(3–4), 101 (in Japanese).
- Zel’dovich and Raizer (1966) Zel’dovich, Ya. B., Raizer, Yu. P.: 1966 Physics of shock waves and high-temperature hydrodynamic phenomena ( ed.), Moscow, Nauka, 686 p. (in Russian).
- Zhang et al. (2007) Zhang, Y., Wang, J., Attrill, G. D. R., Harra, L. K., Yang, Z., He, X.: 2007, Solar Phys. 241, 329.
- Zhitnik et al. (2002) Zhitnik, I. A., Bougaenko, O. I., Delaboudinière, J.-P., Ignatiev, A. P., Korneev, V. V., Krutov, V. V., Kuzin, S. V., Lisin, D. V., et al.: 2002, Proc. 10th European Solar Physics Meeting, Prague (ESA SP-506), 915.
- Zhukov and Auchère (2004) Zhukov, A. N., Auchère, F.: 2004, Astron. Astrophys. 427, 705.