Trigonometric Parallaxes of Massive Star Forming Regions: III. G59.7+0.1 and W 51 IRS2
Abstract
We report trigonometric parallaxes for G59.7+0.1 and W 51 IRS2, corresponding to distances of kpc and kpc, respectively. The distance to G59.7+0.1 is smaller than its near kinematic distance and places it between the Carina-Sagittarius and Perseus spiral arms, probably in the Local (Orion) spur. The distance to W 51 IRS2, while subject to significant uncertainty, is close to its kinematic distance and places it near the tangent point of the Carina-Sagittarius arm. It also agrees well with a recent estimate based on O-type star spectro/photometry. Combining the distances and proper motions with observed radial velocities gives the full space motions of the star forming regions. We find modest deviations of 5 to 10 km s-1 from circular Galactic orbits for these sources, both counter to Galactic rotation and toward the Galactic center.
1 Introduction
We are carrying out a large project to study the spiral structure and kinematics of the Milky Way by measuring trigonometric parallaxes and proper motions of star forming regions. The target sources are 12 GHz methanol masers and we use the National Radio Astronomy Observatory’s 111The National Radio Astronomy Observatory is a facility of the National Science Foundation operated under cooperative agreement by Associated Universities, Inc. Very Long Baseline Array (VLBA). Details of this program can be found in Reid et al. (2008), hereafter called Paper I.
Here we present observations of G59.7+0.1 (IRAS 19410+2336) and W 51 IRS2. Depending on its distance, G59.7+0.1 could be in either the Carina-Sagittarius or Local spiral arm of the Milky Way. W 51 IRS2 is a very well studied region of high-mass star formation; its radial velocity is very close to the maximum allowed by circular rotation for standard models of the Milky Way, and it has generally been assigned the tangent-point distance, , in the Carina-Sagittarius arm. Our direct measurements of distance and proper motion indicate the true location of these star forming regions in the Galaxy and their departures from circular Galactic orbits.
2 Observations and Calibration
We conducted phase-referenced observations of G59.7+0.1 and W 51 IRS2 with respect to two extragalactic radio sources with the VLBA under program BR100D in order to measure parallaxes. Paper I describes the general observational setup and data calibration procedures, so here we only describe details specific to the observations of G59.7+0.1 and W 51 IRS2.
The time between epochs was planned to be three months, matching the eastward and northward extrema of the Earth’s orbit as seen by the sources. The observations were conducted on 2005 Jul. 13 and Oct. 20, 2006 Jan 15, Apr. 23 and Oct. 19, and 2007 Apr. 19. However, the data for the epoch of 2006 Apr. 23 were not correlated at the position of W 51 IRS2 and were lost for this source.
Background compact extragalactic sources were chosen as follows. For G59.7+0.1, we selected J1946+2300 (with separation of 1.0∘ from the maser target) from the ICRF source list (Ma et al., 1998) and J1941+2307 (separation 0.7∘) and J1943+2330 (separation 0.3∘), based on a VLA survey of compact NVSS sources (Xu et al., 2006a). Ultimately, we used only data from the first two sources, as we failed to detect J1943+2330. For W 51 IRS2, we chose two sources from the VLBA Calibrator Survey (Petrov et al., 2006), J1922+1530 (separation 1.0∘) and J1924+1540 (separation 1.2∘), augmented by J1922+1504 (separation 0.6∘), which was found in our VLA survey. Two strong sources (J1800+3848 and J1922+1530) were observed near the beginning, middle and end of the observations in order to monitor delay and electronic phase differences among the IF bands.
After applying the basic calibration procedures described in Paper I, we used the maser features toward G59.7+0.1 at km s-1 and toward W 51 IRS2 at km s-1 for interferometer phase-reference data. When imaging the data referenced to G59.7+0.1, we adopted a round restoring beam of 1.7 mas (FWHM), slightly larger than the geometric mean of the interferometer response (“dirty beam”) of mas at a position angle of 14∘ East of North. For the data referenced to W 51 IRS2, we adopted a round restoring beam of 3.3 mas (FWHM), slightly larger than the dirty beam of mas at a position angle of 134∘.
3 Parallax and Proper Motion
3.1 G59.7+0.1
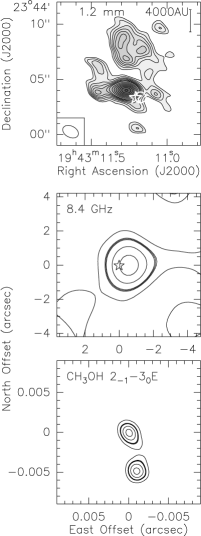
A map of the maser emission made by integrating all channels with detectable emission at the first epoch is shown in Fig. 1. Millimeter and centimeter wavelength continuum data associated with the maser are also presented. We analyzed 8.4 GHz data, which we obtained from the VLA archival database, and find a weak continuum source with flux density of mJy at () = (19 43 11.21, +23 44 03.32), with a probable position uncertainty of about 0.2 arcsec. We conclude that the methanol maser (Table 1) and the compact continuum sources are associated. The continuum source has an upper limit of for its size. One millimeter wavelength core is also associated with the maser and the weak cm continuum source (Beuther, Schilke & Stanke, 2003).
We show the first epoch images of each background continuum source in Fig. 2. One can see that they both appear dominated by a single compact component.

When conducting phase-referenced observations, it is important that the position of the reference source matches the interferometer phase center in order to minimize second-order positional errors and improve image quality. Since the ICRF source J1946+2300 has a position accuracy of mas, we used its position as the basis for all absolute positions given in Table 1.
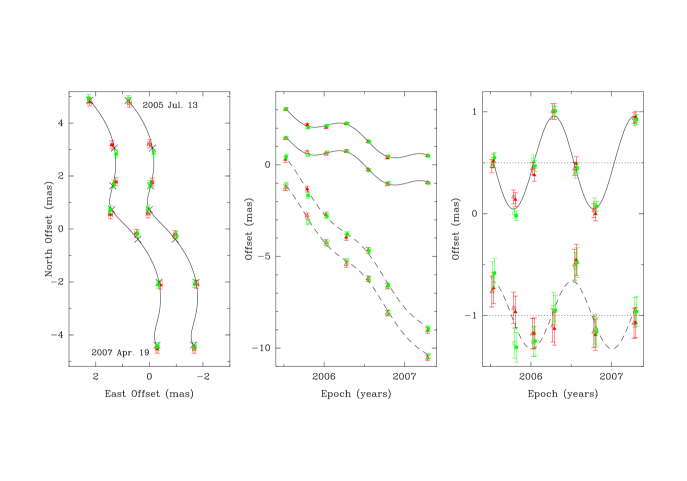
We fitted elliptical Gaussian brightness distributions to two maser spots and the two background radio sources for all seven epochs. In Fig. 3, we plot the positions of two maser spots (at of 26.6 and 27.4 km s-1) relative to two background sources. The measured positions of the G59.7+0.1 masers were then modeled as a linear combination of the elliptical parallax and linear proper motion signatures. Because systematic errors (owing to small uncompensated atmospheric delays and, in some cases, varying maser source structure) typically dominate over signal to noise considerations when measuring relative source positions, we added “error floors” in quadrature to the formal position uncertainties. We used different error floors for the Right Ascension and Declination data and adjusted them to yield post-fit residuals with per degree of freedom near unity for both coordinates. Individual fits are given in Table 2.
Fitting for the parallax and proper motion for both sources simultaneously, we obtain mas. The quoted parallax uncertainty is the formal fitting uncertainty, multiplied by to account for possible correlations between the position data for the two maser spots. This parallax corresponds to a distance of kpc, which is smaller than the “near” kinematic distance of 2.7 kpc, and rules out the far distance of 5.8 kpc. The average proper motions in the eastward and northward directions are and mas y-1, respectively, as listed in Table 2. Similarly, the uncertainties were also multiplied by .
3.2 W 51 IRS2
We made a 12 GHz methanol maser map of W 51 IRS2 by integrating all channels with detectable emission at the first epoch. This map is shown in Fig. 4, superposed on a continuum (23.8 GHz) image from archival VLA data (AS724).
In Fig. 5, we show maps of the background continuum sources, phase referenced to the km s-1 maser spot in W 51 IRS2, from the first epoch. These background sources are dominated by a single compact component. Absolute positions for the maser reference spot and the background sources are given in Table 1. These are based on the position of J1924+1540, which is uncertain by mas (Petrov et al., 2006).


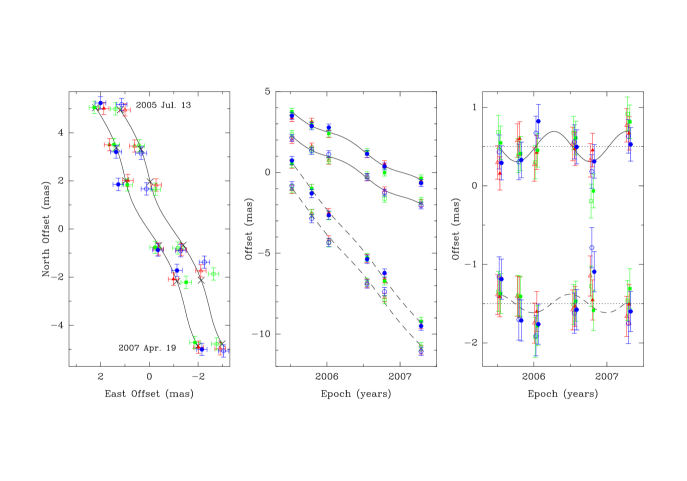
In order to determine the parallax and proper motion of W 51 IRS2, we used positions of two strong maser spots relative to all three background sources. Following the fitting procedures discussed for G59.7+0.1, individual spot/background source parallax solutions are listed in Table 3. A combined parallax solution yielded mas, corresponding to a distance of kpc, which will be discussed in §3.3. The data and model used for this fit are shown in Fig. 6. The formal parallax uncertainty has been multiplied by , in order to account for possible correlations between the position data for the two maser spots. Some of the relative positions for the fifth epoch (2006.80) appear to be outliers. Were we to drop the data from this epoch, the parallax estimate decreases to mas, suggesting a slightly greater distance. The average proper motions of the two maser spots in the eastward and northward directions are and mas y-1, respectively, as listed in Table 3.
3.3 The Distance to W 51 IRS 2
It is interesting to compare our directly measured distance of kpc with other distance determinations that have recently published for W51 IRS 2. Imai et al. (2002) performed multi-epoch VLBI observations of the intense H2O maser outflow in the region (“W 51 N”). A kinematic model they fitted to the measured internal proper motions of the outflow contains its distance as free parameter, for which they find a best fit value of kpc.
Barbosa et al. (2008) combine near infrared spectroscopy and radio continuum and recombination line observations to characterize the exciting star of W 51 IRS 2. Using available data and calculations modeling the temperatures, radii and Lyman continuum production rates of Zero Age Main Sequence (ZAMS) stars, they propose a classification of its spectral type as O3 or O4 (ZAMS). Using the source’s observed bolometric luminosity, they derive and 5.8 kpc for these two choices, respectively, which compares very well with our distance.
We note that the same group recently also obtained a distance of from spectroscopic and photometric observations of four objects in W 51 A classified as O-type stars (Figueredo et al., 2008). W 51 A and W 51 IRS 2, separated by an angle of roughly 1 arc minute (or 1.5 pc), are commonly thought to belong to the same complex and a (near) kinematic distance of 5.5 kpc has been found by Russeil (2003) for W 51 A, comparable to our parallax distance of IRS 2.
Currently, large-scale infrared surveys are leading to the discovery of many new open star clusters throughout the Milky Way (see, e.g., Ivanov et al., 2002; Dutra et al., 2003; Bica et al., 2003), why may trigger a renaissance in efforts to use spectro/photometry of O-type stars for distance estimates with the goal of constraining Galactic structure (see, e.g., Messineo et al., 2006). In view of this, we find that the discrepancy discussed above deserves further investigation. We note that in the famous case of W3OH in the Perseus arm, the O-star method yielded kpc for the close-by Per OB 1 association (Humphreys, 1978), roughly half the kinematic distance implied by a model of Galactic rotation. This turned out to be in excellent agreement with the 2.0 kpc directly determined via two VLBI parallax measurements of CH3OH and H2O masers in W3OH much later (Hachisuka et al., 2006; Xu et al., 2006b). Future maser VLBI trigonometric parallax measurements of W 51 A could certainly contribute to the perplexing question described above.
3.4 Galactic Locations and 3-D Motions
In order to study the 3-dimensional motion of the maser sources in the Galaxy, we converted the proper motions and radial velocities to a Galactocentric reference frame. We adopt the IAU standard constants of kpc and km s-1, and the Hipparcos Solar Motion values , , and km s-1 from Dehnen & Binney (1998). For these values and a flat rotation curve for the Galaxy, the Galactocentric distance of G59.7+0.1 is 7.64 kpc. Its velocity in the direction of Galactic rotation is km s-1 slower than for a circular orbit. Its velocity toward the Galactic Center is km s-1, and its velocity toward North Galactic Pole is km s-1. These uncertainties include measurement errors, but do not include systematic terms from uncertainty in and . Thus we find that G59.7+0.1 has a peculiar motion of km s-1 directed mostly counter to Galactic rotation and toward the Galactic Center.
Our trigonometric parallax places G59.7+0.1 in the Milky Way between the Carina-Sagittarius and Perseus spiral arms. It seems to be a fairly distant member of the Local (Orion) arm or spur, located close to the point where the spur joins the Carina-Sagittarius arm. G59.7+0.1 is near the open cluster NGC 6823, which is also thought to be located in the Local arm (Basharina, Pavlovskaya & Filippova, 1980). Spur-like structures have been observed for many galaxies (Aalto et al., 1999; Scoville et al., 2001; La Vigne, Vogel & Ostriker, 2006). These spurs may form as a consequence of gravitational instabilities inside spiral arms or/and effects of magnetic fields (Balbus, 1998; Kim & Ostriker, 2002; Shetty & Ostriker, 2006). Kim & Ostriker (2002) showed that the growth of spurs can occur due to the mutual contributions of self-gravity and magnetic fields via the so-called magneto-Jeans instability.
Adopting a distance of 5.1 kpc from the Sun, places W 51 IRS2 6.5 kpc from the Galactic center, in the the Carina-Sagittarius spiral arm and reasonably close the spiral arm tangent point. Converting the proper motions and radial velocity of W 51 IRS2 to a Galactocentric reference frame, we find a velocity in the direction of Galactic rotation that is km s-1 slower than for a circular orbit. Its velocity toward the Galactic Center is km s-1, and its velocity toward North Galactic Pole is km s-1. These peculiar motion uncertainties are fairly large, primarily because of the uncertain parallax measurement.
4 Conclusions
We have measured the parallax and proper motion of methanal masers in two regions of high-mass star formation. G59.7+0.1 lies at a distance of kpc in the Local (Orion) arm or spur. Its space motion, relative to a frame rotating with the Milky Way, is about 12 km s-1 counter to Galactic rotation and toward the Galactic center. Our parallax for W 51 IRS2, while less accurate than for G59.7+0.1, indicates that W 51 IRS2 is in the Carina-Sagittarius spiral arm.
Facilities: VLBA
References
- Aalto et al. (1999) Aalto, S., Httemister, S., Scoville, N. Z. & Thaddeus, P. 1999, ApJ, 522, 165
- Balbus (1998) Balbus, S. A. 1988, ApJ, 324, 60
- Barbosa et al. (2008) Barbosa, C. L., Blum, R. D., Conti, P. S., Damineli, A., & Figuerêdo, E. 2008, ApJ, 678, L55
- Beuther, Schilke & Stanke (2003) Beuther, H., Schilke, P. & Stanke, T. 2003, A&A, 408, 601
- Basharina, Pavlovskaya & Filippova (1980) Basharina, T. S., Pavlovskaya, E. D., & Filippova, A. A. 1980, SvA, 24, 559
- Dutra et al. (2003) Dutra, C. M., Bica, E., Soares, J., & Barbuy, B. 2003, A&A, 400, 533
- Bica et al. (2003) Bica, E., Dutra, C. M., Soares, J., & Barbuy, B. 2003, A&A, 404, 223
- Dehnen & Binney (1998) Dehnen, W., & Binney, J. J., 1998, MNRAS, 298, 387
- Figueredo et al. (2008) Figurêdo, E., Blum, R. D., Damineli, A., Conti, P. S. & Barbosa, C. L. 2008, AJ, 136, 221
- Hachisuka et al. (2006) Hachisuka, K., Brunthaler, A., Menten, K. M., Reid, M. J. et al. 2006, ApJ, 645, 337
- Humphreys (1978) Humphreys, R. M. 1978, ApJS, 38, 309
- Imai et al. (2002) Imai, H., Watanabe, T., Omodaka, T., Nishio, M., Kameya, O., Miyaji, T., & Nakajima, J. 2002, PASJ, 54, 741
- Ivanov et al. (2002) Ivanov, V. D., Borissova, J., Pessev, P., Ivanov, G. R., & Kurtev, R. 2002, A&A, 394, L1
- Kim & Ostriker (2002) Kim, W.-T., & Ostriker, E. C. 2002, ApJ, 570, 132
- La Vigne, Vogel & Ostriker (2006) La Vigne, M. A., Vogel, S. N., & Ostriker, E. C. 2006, ApJ, 650, 818
- Ma et al. (1998) Ma, C. et al. 1998, AJ, 116, 516
- Messineo et al. (2006) Messineo, M., Petr-Gotzens, M., Menten, K. M., Schuller, F., & Habing, H. J. 2006, Journal of Physics Conference Series, 54, 238
- Petrov et al. (2006) Petrov, L., Kovalev, Y. Y., Fomalont, E., & Gordon. D. 2006, AJ, 131, 1872
- Reid et al. (2008) Reid, M. J. et al. 2008, submitted to ApJ, (Paper I).
- Russeil (2003) Russeil, D. 2003, A&A, 397, 133
- Scoville et al. (2001) Scoville, N. Z., Polletta, M., Ewald, S., Stolovy, S. R., Thompson, R., & Rieke, M. 2001 AJ, 122, 3017
- Shetty & Ostriker (2006) Shetty, R. & Ostriker, E. C. 2006, ApJ, 647, 997
- Xu et al. (2006a) Xu, Y., Reid, M. J., Menten, K. M. & Zheng, X. W. 2006a, ApJS, 166, 526
- Xu et al. (2006b) Xu, Y., Reid, M. J., Zheng, X. W., & Menten, K. M. 2006b, Science, 311, 54
| Source | R.A. (J2000) | Dec. (J2000) | Brightness | Restoring Beam | ||
|---|---|---|---|---|---|---|
| (∘) | (Jy/beam) | (km s-1) | (mas, mas, deg) | |||
| G59.7+0.1 …… | 19 43 11.2470 | 23 44 03.315 | 1.4 | 27.4 | 1.7 | |
| J1946+2300 …… | 19 46 06.25140 | 23 00 04.4145 | 1.0 | 0.073 | 2.23.2 @ 33 | |
| J1941+2307 ……. | 19 41 55.1114 | 23 07 56.525 | 0.7 | 0.010 | 2.33.8 @ 30 | |
| W51 ……… | 19 23 39.8244 | 14 31 04.953 | 2.2 | 56.4 | 3.3 | |
| J1924+1540 … | 19 24 39.45588 | 15 40 43.9417 | 1.2 | 0.46 | 2.44.3 @ -51 | |
| J1922+1530 … | 19 22 34.6993 | 15 30 10.0327 | 1.0 | 0.23 | 1.94.2 @ -48 | |
| J1922+1504 … | 19 22 33.2728 | 15 04 47.537 | 0.6 | 0.022 | 1.94.6 @ -43 |
Note. — is the separations. The radial velocity of the masers and the size and shape of the interferometer restoring beam are listed for the first epoch’s data. The position angle of the beam is defined as East of North.
| Maser | Background | Parallax | ||
|---|---|---|---|---|
| (km s-1) | Source | (mas) | (mas y-1) | (mas y-1) |
| 26.6 …… | J1941+2307 | |||
| 26.6 …… | J1946+2300 | |||
| 27.4 …… | J1941+2307 | |||
| 27.4 …… | J1946+2300 | |||
| 26.6 …… | combined | |||
| 27.4 …… |
Note. — Combined fit used a single parallax parameter for both maser spots relative to the two background sources; a single proper motion was fit for each maser spot relative to all two background sources.
| Maser | Background | Parallax | ||
|---|---|---|---|---|
| (km s-1) | Source | (mas) | (mas y-1) | (mas y-1) |
| 56.0 …… | J1922+1504 | |||
| 56.0 …… | J1922+1530 | |||
| 56.0 …… | J1924+1540 | |||
| 56.4 …… | J1922+1504 | |||
| 56.4 …… | J1922+1530 | |||
| 56.4 …… | J1924+1540 | |||
| 56.0 …… | combined | |||
| 56.4 …… |
Note. — Combined fit used a single parallax parameter for both maser spots relative to the three background sources; a single proper motion was fit for each maser spot relative to all three background sources.