11email: saalto@chalmers.se 22institutetext: Harvard-Smithsonian Center for Astrophysics, 60 Garden Street, Cambridge, MA 02138, USA 33institutetext: I. Physikalisches Institut, Universit t zu Köln, Zülpicher Str. 77, D - 50937 Köln, Germany 44institutetext: Kapteyn Astronomical Institute, PO Box 800, 9700 AV Groningen, The Netherlands 55institutetext: Institute of Astronomy and Astrophysics, Academia Sinica, P.O. Box 23-141, Taipei 10617, Taiwan 66institutetext: National Astronomical Observatory of Japan, Mitaka, Tokyo 181-8588, Japan
High-resolution HNC 3–2 SMA observations of Arp 220
Abstract
Aims. We study the properties of the nuclear molecular gas of the ultra luminous merger Arp 220 and effects of the nuclear source on gas excitation and chemistry. Specifically, our aim is to investigate the spatial location of the luminous HNC 3–2 line emission and address the underlying cause of its unusual brightness.
Methods. We present high resolution observations of HNC =3–2 with the SubMillimeter Array (SMA).
Results. We find luminous HNC 3–2 line emission in the western part of Arp 220, centered on the western nucleus, while the eastern side of the merger shows relatively faint emission. A bright (36 K at resolution), narrow (60 ) emission feature emerges from the western nucleus, superposed on a broader spectral component. A possible explanation is weak maser emission through line-of-sight amplification of the background continuum source. There is also a more extended HNC 3–2 emission feature north and south of the nucleus. This feature resembles the bipolar OH maser morphology around the western nucleus. Substantial HNC abundances are required to explain the bright line emission from this warm environment – even when the high gas column density towards the western nucleus is taken into account. We discuss this briefly in the context of an X-ray affected chemistry and radiative excitation.
Conclusions. The luminous and possibly amplified HNC emission of the western nucleus of the Arp 220 merger reflects the unusual, and perhaps transient environment of the starburst/AGN activity there. The faint HNC line emission towards Arp 220-east reveals a real difference in physical conditions between the two merger nuclei.
Key Words.:
galaxies: evolution — galaxies: individual: Arp 220 — galaxies: starburst — galaxies: active — radio lines: ISM — ISM: molecules1 Introduction
The closest of the ultra luminous galaxies (ULIRGs), Arp 220 (=73 Mpc, 1′′=354 pc) provides an excellent opportunity to study the properties of the interstellar medium in the extreme environment at the heart of an ongoing galaxy merger. High-resolution CO studies (e.g. Sakamoto et al. 1999) find that the molecular gas is distributed in two counter-rotating molecular gas discs with radii of 100 pc, each surrounding the two nuclei. These discs are embedded in a larger ( 1 kpc) gas disc which is rotating around the dynamical centre of the system. The nature of the two nuclei is different with the western one dominating at mid-IR wavelengths, suggesting a compact starburst (and/or buried AGN) and the eastern one less luminous, but with deep silicate absorption features (e.g. Soifer et al. 1999). Downes & Eckart (2007) find a compact, hot dust source surrounding the nucleus of Arp 220 west. They claim that this dust source surrounds an AGN and that a considerable fraction of the total IR luminosity of Arp 220 stems from this AGN.
Recently, it has been discovered that the HNC 3–2 line of Arp 220 is unusually luminous
compared to HCN 3–2 (Cernicharo et al. 2006; Aalto et al. 2007).
Bright HNC 3–2 line emission can be explained in several ways, alone or in combination:
a) The presence of significant quantities of cold ( K) molecular gas (e.g. Hirota et al. 1998),
b) very large optical depths due to large columns of gas, c) an effect of mid-IR
pumping of HNC enhancing the luminosity, or d) an abundance enhancement
of HNC in an X-ray dominated chemistry near an AGN (e.g. Aalto et al. 2007; Meijerink & Spaans 2005; Meijerink et al. 2006, 2007).
Both HCN and HNC have degenerate bending modes in the IR. For HNC this mode occurs at =21.5 m with an energy level =668 K and an -coefficient of =5.2 s-1. For HCN the bending mode occurs at =14 m, energy level =1027 K and =1.7 s-1. In a radiation environment where the intensity rises through the mid-infrared toward a peak at longer wavelengths HNC undergoes absorption and fluoresence at a much faster rate than HCN. As a result HNC can be pumped more easily than HCN (e.g. Aalto et al. 2007). The X-ray irradiation of molecular gas leads to a so-called X-ray dominated region (XDR) (e.g. Maloney et al. 1996; Lepp & Dalgarno 1996) similar to photon-dominated regions (PDRs) associated with bright UV sources (Tielens & Hollenbach 1985). The more energetic (1-100 keV) X-ray photons penetrate large columns ( ) of gas and lead to a different ion-molecule chemistry. Models of XDRs by Meijerink & Spaans (2005) indicate that the HNC/HCN column density ratio is elevated () compared to PDRs (where the HNC/HCN abundance ratio may be 1) and quiescent cloud regions for gas densities around . Hence, ULIRGS that contain an AGN and possess high gas densities are likely candidates for luminous HNC emission.
In order to study the mechanisms behind the large HNC luminosity of Arp 220, we undertook high resolution HNC 3–2 observations with the SMA. In Sect. 2 we present the observations and results. In Sect. 3.1 and 3.2 the luminous nuclear HNC emission is discussed in terms of possible amplified emission in a hot, dense environment. The origin of a more extended HNC emission is discussed in Sect. 3.5 and HNC abundances are briefly discussed in Sect. 3.6.
2 Observations and results
We have observed the HNC 3–2 line (rest frequency 271.981 GHz) in Arp 220 on 2006 June 30 (project 2006-03-S057) with the SubMillimeter Array (SMA) on Mauna Kea, Hawaii. We assigned velocity 5486 to channel 36 (out of 72) corresponding to frequency 267.093310 GHz thus using the optical velocity definition (=). The optical velocity is approximately 100 larger than the velocities for the radio definition. The observations were carried out in the very extended array where the baselines ranged from 67 to 507 meters. There were seven antennas in the array and the atmospheric opacity was = 0.15, with low wind, and a reasonable phase stability for this configuration. System temperatures were 200-700 K (DSB) (with strong elevation dependence). The quasar J1635+381 was used to calibrate both Arp 220 and J1613+342. Fitting a Gaussian to the J1613+342 visibilities we find an effective seeing of about . The data were calibrated with the MIRIAD package and then transferred to FITS format for further reduction with the AIPS package. The data were deconvolved using the AIPS CLEAN task IMAGR and the data were binned to a velocity resolution of 30 . For natural weighting, the beam size is , omitting antenna 3, which had performance issues. Dropping antenna 3 makes the longest baseline 458 meters. At this resolution, the flux to temperature scale is: 120 K/Jy so that 0.3 Jy corresponds to 36 K. We used the AIPS task IMLIN for continuum subtraction in the image plane.
| East nucleus | West nucleus | |
|---|---|---|
| Continuuma: | ||
| position (J2000) | : 15:34:57.31 | : 15:34:57.23 |
| : +23:30:11.4 | : +23:30:11.5 | |
| flux (mJy) | ||
| Lineb: | ||
| peak flux | ||
| (mJy beam-1) | 75 50 | 330 50 |
| integrated flux | ||
| (Jy ) |
a) Gaussians were fitted to the continuum images and the
eastern source was found to be slightly resolved while the western source was
unresolved. Removing a 10% contribution from free-free and synchrotron continuum, we find
the corresponding beam-smeared brightness temperature of the dust emission
to be 16 K - similar to the 18 K
Downes & Eckart (2007) find for their 1.3 mm continuum source at somewhat higher resolution ().
b) The integrated flux in the naturally weighted map is 250 80 Jy . Out of these, 130 Jy is associated with a 0.5′′structure.
2.1 Continuum emission
Continuum emission at 277 GHz (upper side band – the HNC 3-2 line was placed in the lower side band) is detected towards both the western and eastern nucleus. The continuum results are presented in tab. 1. These SMA observations were not aimed at obtaining absolute astrometry and thus the positional uncertainty for the continuum peaks is . We refer to Sakamoto et al. (2008) for more accurate positions of the continuum and for a detailed discussion of the nature of the continuum sources.
2.2 HNC =3–2 line emission
2.2.1 Naturally weighted map
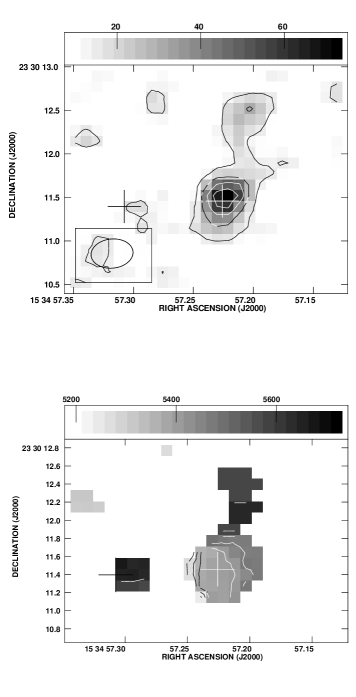
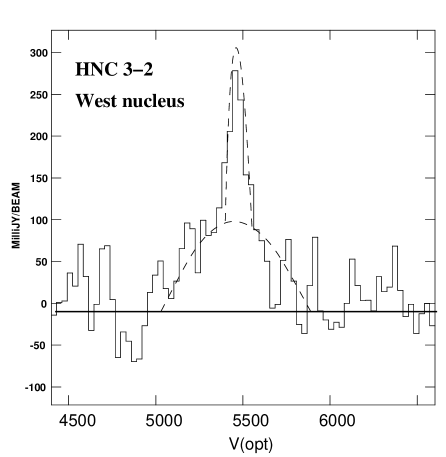
In the integrated line map (fig. 1 upper panel), most of the HNC flux is at the western nucleus of Arp 220 (see tab. 1). The line peak coincides with the western continuum peak. The line peak is about 250 mJy/beam in the Hanning-smoothed spectrum (Fig.2), and it is 330 +/- 50 mJy/beam (39 +/-6 K) in the unsmoothed data (the 30 km/s channel maps in Fig.3), at 5456 . The velocity field (fig. 1 (lower panel)) shows east-west rotation around the western nucleus consistent with what has been seen previously for CO 2–1 and 3–2 (e.g. Sakamoto et al. 1999; Downes & Eckart 2007; Sakamoto et al. 2008) from an edge-on rotating torus or disc. Higher velocities to the north of the western nucleus, and in the eastern nucleus, are also consistent with previous CO results. A channel map is shown in fig. 3 where we can see that the brightest line emission can be found in the velocity range 5400 to 5550 - with a peak at 5456 . In total, line emission can be found from 5200 to 5633 . From the channel map we see that emission is present in the nucleus itself, and also extends to the north and south.
2.2.2 Tapered map
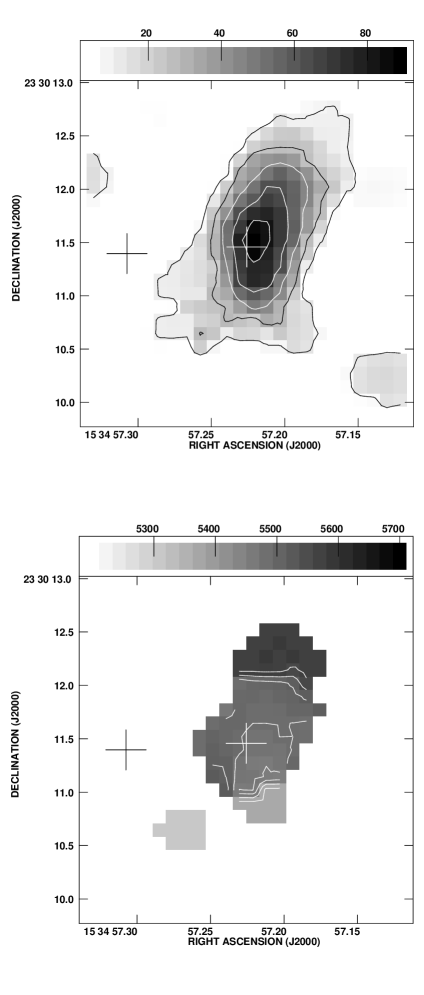
To study the more extended part of the emission we tapered the map to a resolution of where 0.3 Jy corresponds to 11 K (see fig 4 top panel). The integrated peak intensity is then shifted somewhat off the western nucleus and the shape of the emission (and the velocity structure) appears dominated by a north-south feature.

2.3 Single dish spectrum and recovered flux
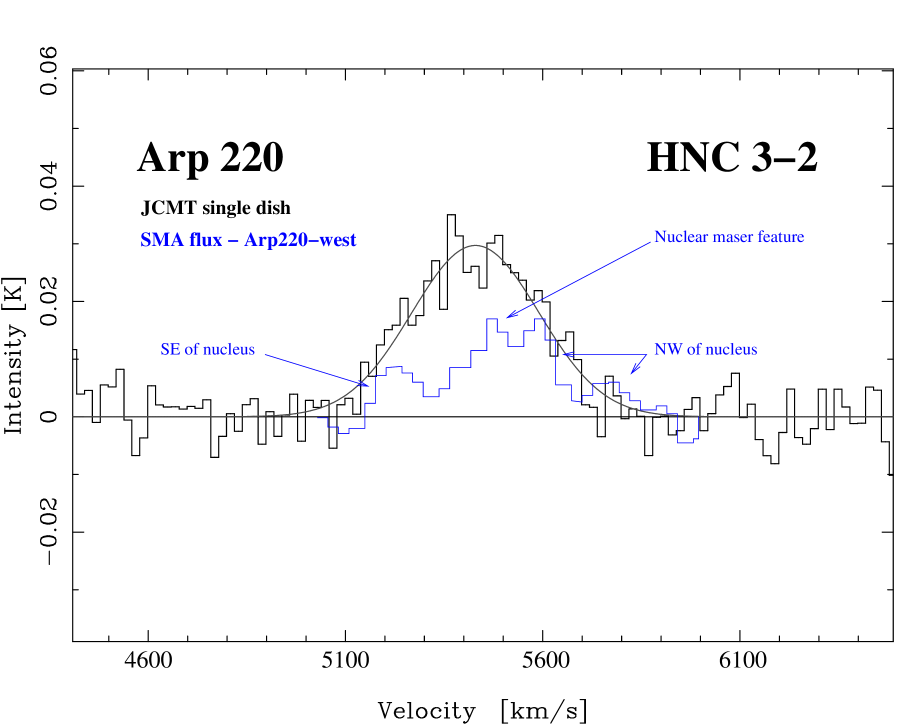
Single dish data on HNC 3–2 were reported in Aalto et al. (2007) and obtained with the JCMT in April 2005. The integrated intensity translates to 351 Jy () where the integrated intensity is 12.8 K in the scale. In fig. 5 we show the JCMT single-dish spectrum and the SMA (naturally weighted) flux-summed spectrum for the western region of Arp 220. Note the difference in line shape and that there appears to be a larger fraction of blue-shifted emission missing in the naturally weighted interferometer map. The contribution from the eastern nucleus is not included in fig. 5. Its contribution is small and would add 10% flux to the higher velocity part of the spectrum.
3 Discussion
The HNC 3–2 spectrum of the western nucleus shows a broad feature upon which a narrow, luminous feature (=5440 ) is superposed (see Sect. 2.2.1 and fig. 2). The peak brightness temperature of the HNC 3–2 emission feature is 39 K in our beam. In the same velocity range, CO 2–1 and 3–2 (at similar resolution) instead show deep, narrow (100 ) absorption (Downes & Eckart 2007; Sakamoto et al. 2008). The deepest CO 2–1 absorption occurs at 5450 , but other, less prominent, absorption features show up at higher velocities, In CO 3–2 the absorption occurs in the range 5400-5450 (transferred from the of Sakamoto et al. (2008). Downes & Eckart (2007) suggest that this is due partly to absorption of hot continuum, and CO self-absorption, implying that the CO-West disc has a temperature gradient increasing inwards.
We suggest that the luminous, narrow HNC 3–2 emission features could be caused by weak maser action in the cooler part of the nuclear disc - amplifying instead of absorbing the background continuum from the inner hot, dusty part of the disc. If the narrow, luminous feature is indeed emerging only in front of the continuum source, the undiluted brightness temperature is 156 K.
Previous claims of weak masering in other molecules (besides OH) include methanimine Salter et al. (2008), and formaldehyde Araya et al. (2004).
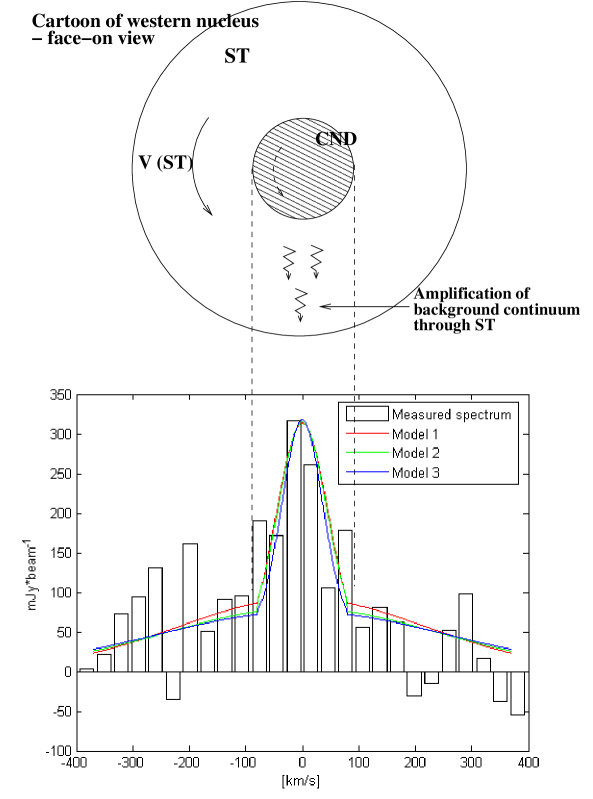
3.1 A simple model
Downes & Eckart (2007)
propose a model of the western nucleus consisting of: An inner circum-nuclear disc (CND)
which is hot (dust temperature =170 K) and with an average gas
density =1105 and H2 column density .
Its rotational velocity is =370 and radius 30 pc.
The CND is surrounded by a cooler (=50 K) outer disc or torus with average gas density
=1104 , , radius 90 pc and has a rotational
velocity of 250 . From now on we will refer to
these two features as the CND and the surrounding torus, ST. Thus in this scenario, the
CO absorption
occurs in the cooler ST obscuring the hot dusty nucleus. The division of the western nucleus into these
two features is somewhat misleading since to view them as two separate entities with constant temperature and
density is likely incorrect. However, for the purpose of a simple model the ST/CND model
will suffice and we adopt it for the maser discussion here. We have also assumed that the
rotation velocity of the ST falls linearly from 370 at the radius of the CND
to 250 (i.e. from 30 to 90 pc). The detailed dynamics of the western nucleus
is not known, however, and this is a simple (but unphysical) approximation that allows for a
straightforward handling of the kinematics in front of the continuum source.
In fig. 6 we show a model fit superposed on the nuclear spectrum towards Arp 220-west. It consists of HNC 3–2 line emission contributions from the ST and its amplification of the background continuum (the narrow feature) and the HNC emission from the CND. In our simplified assumption on the velocity (see above) the gas in front of the CND has a velocity width of 80 (similar to the fit of 60 to the observational data). Inside of this velocity range we get amplified emission from the CND plus a contribution from the ST itself. Outside of this velocity region there is only contribution from the ST and CND. We propose that the populations are inverted throughout the ST and we have fixed the excitation temperature in the ST to 40 K which gives 1% population inversion. Other choices can be made and we will discuss conditions for population inversion in the next section.
In the model fit the resulting average optical depth through the amplifying ST is 0.16 (at resolution ). There is also a contribution to the HNC emission from the CND which is modelled to be about 4 K at line centre diluted in the 0.4′′beam. The CND contributes all of the emission in the line wings beyond a velocity of 300 .
We have assumed HNC column densities for the CND in the range of cm-2 (i.e. an abundance relative to H2 in the range (HNC)=), and CND kinetic temperatures in the range 100 – 170 K (close to the dust temperature). A high abundance in the CND will increase its line centre contribution and reduce the resulting optical depth in the maser. (See discussion on HNC abundances in Sect. 3.6). If however the contribution from the CND becomes too large it starts to affect the overall line shape, broadening it. Thus, for the given conditions above, we find a range of maser optical depths of =0.04 to =0.25 where the higher absolute optical depth is for a small contribution from the CND. Note, however, that the dusty graybody of the CND may prevent much line emission emerging from the CND depending on dust optical depth, dust clumpiness and structure.
The shape of the observed spectrum can be reproduced within the noise level. Testing a more sophisticated model requires higher signal-to-noise observations at higher resolution, where the ST and CND contributions can be resolved. Below we discuss possible mechanisms for HNC population inversion.
3.2 Conditions for population inversion
In the previous section we propose that population inversion can take place between the rotational levels 3 and 2 and we show the line profile in a simple case of amplification by the HNC molecule. It is possible to either collisionally or radiatively pump HNC:
a) Collisional pumping:
At gas densities approaching
and kinetic temperatures around 150 K the HNC 3–2 line can become inverted.
For a column density of (HNC)= (assuming (H2)= through ST
and (HNC)=), a line-width of 80 , a continuum background
model as the one described in Downes & Eckart (2007), the HNC 3–2 line would be a maser with
=34 K, =0.16 and =58 K. This simulation
is done with RADEX code modified by us to include the mid-IR and IR transitions of HNC.
The on-line version of RADEX (van der Tak et al. 2007) does
currently not include these IR transitions of HNC.
This is to illustrate that HNC maser action can be achieved with the approximate
brightness, excitation and optical depth as indicated in the simple
model in the previous section. We furthermore note that in this model, the HNC 3–2
line is by far the most luminous of the rotational lines. The 1–0 and 2–1 lines
are also masering, but with lower brightness temperatures. The =4–3 line is
not masering and is fainter by a factor of 6.
b) Radiative pumping: Both HCN and HNC have degenerate bending modes in the IR through which they can be pumped (see Sect. 1). HNC is pumped via 21.5 m continuum and the pumping of HNC may start to become effective when the IR background reaches a brightness temperature of 50 K at that wavelength. The inner 30 pc CND would then serve as a source of mid-IR photons to pump the HNC molecules in the surrounding torus. According to Downes & Eckart (2007), the brightness temperature at 1.3 mm is 90 K. Sakamoto et al. (2008) report the 860 m brightness temperature of the west nucleus to be (90-160) K, where the range corresponds to the range of possible source structure (i.e., a Gaussian or a disc). The nuclear mid-IR temperature may therefore be as high as 160 K, although the mid-IR emission with brightness temperature of 160 K for the dust in the CND likely has a solid angle that is less than 2 as seen by the ST, it is luminous enough to affect significantly the excitation of the ST - at least its inner parts. Furthermore, mid-IR imaging by Soifer et al. (1999) showed that the brightness temperature is around 100 K in the 100 pc region around the western nucleus. The mid-IR photons for the broad component may therefore be from the 100 pc western disc itself. Modelling the geometry, radiation field, gas density and temperature will help determine what fraction of the HNC-emission from the ST that could be affected by radiative pumping.
3.3 Physical conditions in the ST
The broader part of the nuclear spectrum has a line width of 500 - 550 and a peak flux of 100-150 mJy (11 - 18 K)(fig. 2). We identify this feature with the surrounding, 90 pc torus (ST) for which Downes & Eckart (2007) find a CO 2–1 brightness temperature of 40 K and Sakamoto et al. (2008) find a slightly higher CO 3–2 brightness of 50 K. Thus, roughly, the CO 2–1/HNC 3–2 brightness temperature ratio is only 2-4 for the ST outside of the luminous, narrow, maser-like feature.
Such a low line ratio is consistent with both possible pumping scenarios discussed above. For the physical conditions suggested by Downes & Eckart (2007) for the ST it is difficult to get such a low CO/HNC line ratio. At , the density is too low to effectively excite the HNC 3–2 line to the required level unless the HNC abundances are extreme (see Sect. 3.6 for a discussion of HNC abundances). However, if the ST is very clumpy and clump densities can approach then the observed line ratio can be understood. There is a large number of SNRs in this area so it is likely that there is compressed, high-density gas around the SNRs. Alternatively, the low CO/HNC line ratio can be a result of the HNC excitation being affected by mid-IR pumping since the mid-IR continuum would boost the HNC 3–2, but not the CO emission.
3.4 Alternative scenarios
Instead of originating as amplified emission in the ST, the narrow luminous HNC line may emerge from the CND itself - but then one would expect a much broader line width, similar to the suggested rotational velocity (Downes & Eckart 2007) of 370 . However, the line width of the inner CND is not well constrained, so this is an option that warrants further study.
Another possibility is that the narrow feature emerges from a nuclear outflow. The shape and width of the line would then be dependent on the viewing-angle of the disc, the outflow velocity and the opening angle of the cone.
3.5 The extended HNC 3–2 emission
Outside of the compact, and possibly amplified, emission of the western nucleus we find HNC emission distributed on radii (150 - 350 pc) north and south of the western nucleus. This is not an unreasonable scale in a merging system. Its north-south morphology also resembles the bipolar morphology of the OH maser emission from the western region of Arp 220 (Rovilos et al. 2003). This is intriguing, since both HNC and OH can undergo infrared radiative excitation.
3.6 HNC abundances
It is predicted in chemical steady state models and also by shock models that the HNC/HCN ratio drops with increasing temperature and gas density. This is supported by the fact that the measured HNC/HCN ratio is especially low in the vicinity of the hot core of Orion KL. This behaviour is to some degree caused by neutral-neutral chemistry in warm ( K) dense environments: At high temperatures HNC can be transferred into HCN via the reaction . Furthermore, HNC is destroyed through reactions with atomic oxygen at high temperatures (e.g. Schilke et al. 1992; Hirota et al. 1998). Therefore, the HNC abundances in these regions are expected to be below and factors of 10 – 100 lower than those for HCN.
However, if the chemistry is dominated by ion-neutral processes, the negative temperature dependence of the HNC abundances is less pronounced or absent even in warm regions, which would be expected in a PDR or XDR. In an XDR the ion-molecule chemistry is different from that of a PDR and may lead to HNC abundances exceeding those of HCN even when temperatures are high (Meijerink & Spaans 2005). For gas densities around in an XDR, (HNC) may become twice that of HCN.
3.6.1 The CND
For the adopted densities and columns of the CND (see Sect. 3.1), we would require X-ray fluxes in excess of 10 erg cm-2 s-1 to affect the chemistry. One would have 100 erg cm-2 s-1 at 30 pc for an X-ray point source of 1043 erg s-1. For this, HNC abundances would be enhanced up to about 100 pc. We find - using the models described in e.g. Meijerink & Spaans (2005) - HNC abundances increasing one order of magnitude with increasing X-ray flux (FX)(Tab 2). Also the HCN abundances increase with FX, but remain lower than (HNC) with factors 1.2 to 1.8.
| (HNC) | (HCN) | FX (erg cm-2 s-1) |
|---|---|---|
| 2.110-9 | 1.710-9 | 1 |
| 8.810-9 | 5.610-9 | 10 |
| 2.910-8 | 1.610-8 | 100 |
a) For a column of , density and temperature =150 K.
In Sect. 3.1 we discussed the contribution from the CND to the western nuclear line profile and how it becomes merged with emission from the ST and the narrow, amplified emission. At a density of and temperature 170 K even a large HNC abundance of would not result in a very strong signal in the line wings (signal would be 2 K, or 17 mJy). If the CND is clumpy with gas densities an order of magnitude higher than the average density, the signal in the line wings could start to be detectable even at the current noise level and resolution. However, the CND is immersed in its own strong continuum emission which would affect the excitation of HNC. A detailed model and higher signal-to-noise and resolution observations are required to more closely address the issue of HNC abundances in the core of Arp 220-west.
3.6.2 The surrounding 90 pc torus, ST
In the surrounding torus the H2 column and average gas density are suggested to be one order of magnitude lower than in the hot CND. As we mention in Sect. 3.3, it would be difficult to explain the HNC line emission of the ST from a medium of density of only assuming collisional excitation unless HNC abundances were extremely high, (HNC)=. If we assume either radiative excitation or that the HNC emission is emerging from a clumpy medium with higher densities than average, the bright HNC signal is consistent with a range of abundances: (HNC)= which can be fitted to both XDR and PDR models.
3.6.3 The extended HNC emission
In Sect 3.5 the possibility that part of the extended HNC emission is
associated with a nuclear outflow is mentioned. The bright HNC emission may be due
to significant HNC abundances in a dense medium and/or radiative excitation of HNC.
With no information on the density and temperature of the molecular medium here it
is difficult to estimate the HNC abundances.
The potentially high abundance of HNC in an
outflow is interesting since it has been viewed as a molecule
that becomes removed by shocks (e.g. Schilke et al. 1992).
Loenen et al. (2008) have studied shock destruction of HNC in a star-bursting system.
They find that a star formation rate of yr-1 can bring down the HNC/HCN abundance
ratio by a factor of two in the nuclei of active galaxies.
In contrast, Arce & Sargent (2004) find that in some protostellar outflows
HNC abundances may become enhanced in the cavity walls.
We furthermore note the difference between the eastern and western nuclei. The CO 3–2 luminosity difference between the two nuclei is less than two (Sakamoto et al. 2008) while the HNC 3–2 luminosity of the eastern nucleus is only 15 - 20% of that of the western. If the HNC emission is enhanced by the IR fields and stimulated emission in the western nucleus, this demonstrates the difference in degree and type of activity of the two nuclei. It is also possible that the dense gas content in the eastern nucleus is lower than in the west.
4 Outlook: Future observational tests
There are a number of possible ways to further test the effects of the intense continuum on the excitation of molecules in Arp 220. With better signal-to-noise and even higher resolution HNC data one should be able to test hypotheses of radiative excitation, maser amplification and various XDR/PDR models. Also the suggested difference in physical conditions between the eastern and western nuclei should be further studied. It will be very useful to compare the HNC with high resolution observations of other molecular lines, in particular other high density tracers. In an XDR scenario a large abundance of CN is expected. Also CS, HCN, HCO+, NO, HOC+, SiO may be abundant depending on X-ray flux, temperature, number- and column density of the XDR. Rotational transitions of vibrationally excited HNC in the millimetre/submillimetre are potentially detectable. Several of the suggested molecules have important transitions in the infrared with large diagnostic potential. The suggestion that the bipolar structure around the western nucleus is an outflow could be addressed through observing HCO+ – which is a molecule that is often enhanced in outflows (e.g. Rawlings et al. 2004).
The fact that the HNC 3–2 emission from the western nucleus has its peak intensity where CO 2–1 and 3–2 show distinct absorption, is a strong indication that HNC may be a maser. We can reproduce the HNC 3–2 spectrum with a simple maser model, but further tests are necessary. Higher resolution observations will reveal the presence of brighter maser-spots if the emission is emerging from a clumpy medium. A weak, large-scale maser may however be difficult to distinguish from strong thermal emission, even in a clumpy medium. Time variability connected to the motions of maser spots and variability in the nuclear source can also be investigated. High resolution observations of other HNC transitions will help constrain radiative transport models.
We furthermore note that the collisional excitation rates for HNC are not well known. In models, it is therefore assumed that the rates are the same as for HCN. Better collisional rates for HNC are necessary for fine-tuning of fits of observational data to radiative transport and chemistry models.
5 Conclusions
Luminous HNC 3–2 line emission is detected towards the western nucleus of the ULIRG Arp 220. About 50% of the flux is emerging from the inner 180 pc consisting of an east-west rotating torus or disc surrounding a hot, dense, and dusty circum nuclear region of radius 30 pc. The emission consists of broad emission from the disc which we suggest is being pumped by mid-IR continuum from the buried circum nuclear region – but also possibly by the surrounding torus itself. Superposed on this emission is a narrow feature which may be the result of a weak HNC maser, enhancing the background continuum along the line of sight through the pumped disc. The emission feature coincides in position and velocity with absorption in the CO line.
HNC 3–2 line emission is also found north and south of the nucleus. This is either due to the presence of dense gas on scales of - and/or the mid-IR field is affecting the HNC excitation here as well. The spatial correlation with OH maser emission may suggest that part of the extended HNC emission is due to a nuclear outflow.
The HNC emission is located mostly on the western side of Arp 220. Only faint emission is detected close to the eastern nucleus. This reflects a real difference in physical conditions between the two nuclei.
Acknowledgements.
We thank an anonymous referee for useful comments and suggestions that helped improve the paper. The Submillimeter Array is a joint project between the Smithsonian Astrophysical Observatory and the Academia Sinica Institute of Astronomy and Astrophysics and is funded by the Smithsonian Institution and the Academia Sinica.References
- Aalto et al. (2007) Aalto, S., Spaans, M., Wiedner, M. C., & Hüttemeister, S. 2007, A&A, 464, 193
- Araya et al. (2004) Araya, E., Baan, W. A., & Hofner, P. 2004, ApJS, 154, 541
- Arce & Sargent (2004) Arce, H. G. & Sargent, A. I. 2004, ApJ, 612, 342
- Cernicharo et al. (2006) Cernicharo, J., Pardo, J. R., & Weiss, A. 2006, ApJ, 646, L49
- Downes & Eckart (2007) Downes, D. & Eckart, A. 2007, A&A, 468, L57
- Hirota et al. (1998) Hirota, T., Yamamoto, S., Mikami, H., & Ohishi, M. 1998, ApJ, 503, 717
- Lepp & Dalgarno (1996) Lepp, S. & Dalgarno, A. 1996, A&A, 306, L21
- Loenen et al. (2008) Loenen, A. F., Spaans, M., Baan, W. A., & Meijerink, R. 2008, A&A, 488, L5
- Maloney et al. (1996) Maloney, P. R., Hollenbach, D. J., & Tielens, A. G. G. M. 1996, ApJ, 466, 561
- Meijerink & Spaans (2005) Meijerink, R. & Spaans, M. 2005, A&A, 436, 397
- Meijerink et al. (2006) Meijerink, R., Spaans, M., & Israel, F. P. 2006, ApJ, 650, L103
- Meijerink et al. (2007) Meijerink, R., Spaans, M., & Israel, F. P. 2007, A&A, 461, 793
- Rawlings et al. (2004) Rawlings, J. M. C., Redman, M. P., Keto, E., & Williams, D. A. 2004, MNRAS, 351, 1054
- Rovilos et al. (2003) Rovilos, E., Diamond, P. J., Lonsdale, C. J., Lonsdale, C. J., & Smith, H. E. 2003, MNRAS, 342, 373
- Sakamoto et al. (1999) Sakamoto, K., Scoville, N. Z., Yun, M. S., et al. 1999, ApJ, 514, 68
- Sakamoto et al. (2008) Sakamoto, K., Wang, J., Wiedner, M. C., et al. 2008, ApJ, 684, 957
- Salter et al. (2008) Salter, C. J., Ghosh, T., Catinella, B., et al. 2008, AJ, 136, 389
- Schilke et al. (1992) Schilke, P., Walmsley, C. M., Pineau des Fôrets, G., et al. 1992, A&A, 256, 595
- Soifer et al. (1999) Soifer, B. T., Neugebauer, G., Matthews, K., et al. 1999, ApJ, 513, 207
- Tielens & Hollenbach (1985) Tielens, A. G. G. M. & Hollenbach, D. 1985, ApJ, 291, 722
- van der Tak et al. (2007) van der Tak, F. F. S., Black, J. H., Schöier, F. L., Jansen, D. J., & van Dishoeck, E. F. 2007, A&A, 468, 627