Evidence of natural isotopic distribution from single-molecule SERS
Abstract
We report on the observation of the natural isotopic spread of carbon from single-molecule Surface Enhanced Raman Spectroscopy (SM-SERS). By choosing a dye molecule with a very localized Raman active vibration in a cyano bond (CN triple bond), we observe (in a SERS colloidal liquid) a small fraction of SM-SERS events where the frequency of the cyano mode is softened and in agreement with the effect of substituting 12C by the next most abundant 13C isotope. This example adds another demonstration of single molecule sensitivity in SERS through isotopic editing which is done, in this case, not by artificial isotopic editing but rather by nature itself. It also highlights SERS as a unique spectroscopic tool, capable of detecting an isotopic change in one atom of a single molecule.
As a spectroscopic technique, single-molecule Surface Enhanced Raman Scattering (SM-SERS) is now well established and accepted. A précis of some of its most salient aspects has been recently provided in Ref. PCCPfeature . Arguably, one of the most refined and elegant demonstrations of Single Molecule Surface-Enhanced Raman Scattering (SM-SERS) is through the bi-analyte SERS technique 2006LeRuJPCBBiASERS ; 2007GouletAnChem ; 2007MurakoshiJACS , using isotopically edited molecules 2007DieringerJACS ; 2008BlackiePCCP . Isotopic editing is done purposely on specific moieties of standard SERS probes (like rhodamines 2007DieringerJACS ; 2008BlackiePCCP ) to obtain molecules that have nominally identical chemical properties but distinguishable Raman features.
Still, the typical atoms that constitute the structure of standard dyes used for SERS have their own natural isotopic spread. Accordingly, we can ask if the reverse logic applies: under SM-SERS conditions, is it possible to discern natural isotopologues? In this paper we show that –for specific cases– the natural isotopic spread of carbon in organic dyes is indeed detectable.
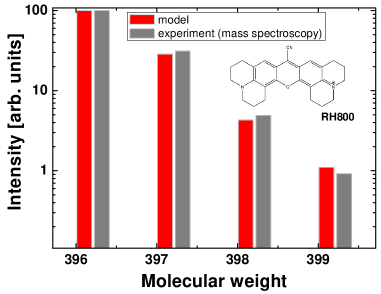
One of the obvious contributions to the isotopic distribution of organic molecules (of interest for SERS) is carbon. Despite a relatively small natural isotopic spread between 12C (98.9%) and 13C (1.1%) IUPAC , carbon still plays a decisive role in the isotopic spread of organic molecules due to it preponderance with respect to other atomic species. Hydrogen is, of course, very abundant too in typical organic dyes, but this is compensated by its much smaller natural isotopic spread between hydrogen (99.985%) and deuterium (0.015%) IUPAC . Let us study one particular example of a useful SERS probe: rhodamine 800 (RH800). The reason for choosing this particular molecule will become clearer later. The structure of RH800 is shown in the inset of Fig. 1; it has the chemical formula: C26H26N3O+, and a molar mass of 396.21 g/mol when all the atoms are in their most abundant (lightest here) versions. Carbon and hydrogen are the most abundant atoms in the structure. Nitrogen and oxygen are not only a minority, but they also have smaller natural isotopic spreads with respect to carbon (14N: 99.63%; 15N: 0.37%, and 16O: 99.75%; 17O: 0.05%; 18O: 0.20%) IUPAC . It is quite clear that by having the largest abundance and the widest (relative) natural isotopic spread (even when it is only ), it is enough for carbon to play the most predominant role. In fact, the “combinatorics” of isotopic mass distributions are straightforward to calculate and can be compared to direct experimental measurements of the mass distribution of RH800 molecules, a common practice in mass spectroscopy analysis. This is explicitly shown in Fig. 1, obtained by standard high resolution mass spectroscopy on our sample. Note that mass spectrometry typically uses large (macroscopic) amounts of molecules to discern these differences.
These natural isotopic changes in mass result, in principle, in slight changes in vibrational frequencies. However, these cannot be resolved in most cases for a variety of reasons that include: the natural isotopic spread is very small, natural isotopic substitutions occur at random places within the molecular structure, and not necessarily at places where they will considerably affect the eigenvectors and frequencies of Raman active vibrations, and natural isotopic shifts are in many cases too small and hidden within the homogeneous linewidth of Raman peaks. In fact, a big fraction of the eigenvectors that produce Raman active modes in medium-size or large molecules will be extended over many atoms book , and the perturbation of a small mass change at a certain site will be relatively minor. From the standard theory of vibrations in molecules, the frequency of a given mode in a molecule is related to its reduced mass through the proportionality book . The reduced mass can be viewed as a eigenvector-weighted mass-average that takes into account the relative participation of different atoms in the collective motion described by a particular eigenvector. A change of mass on the -th atom results in a relative change of frequency given by: with . In general, this change will be small, and within the intrinsic linewidth (homogeneous broadening) of the peak.
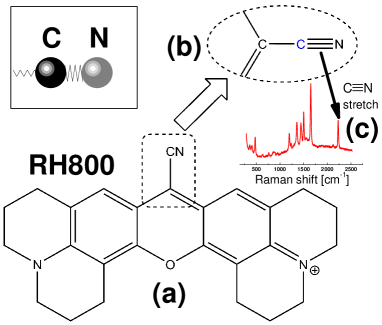
There are nevertheless exceptions, a family of which is associated with the existence of localized vibrational modes (for which is much larger). RH800 has such a mode. The carbon-nitrogen triple bond (cyano group) in the structure of RH800, highlighted in Fig. 2(a), is a strong bond that produces a relatively isolated and localized stretch vibration. The cyano group (highlighted in Fig. 2(b)) produces a Raman active vibration at a frequency of for the most common isotopic combination of 12C14N. This vibration is fairly localized to the stretch motion of carbon against nitrogen and occurs in the so-called “Raman silent” region; above the standard fingerprint region () and below the hydrogen-stretching region () for typical organic molecules. The cyano stretch Raman-active mode is shown explicitly in the spectrum in Fig. 2(c) for the specific case of RH800. Only triple bonds produce Raman active modes in this region. To a very good approximation, it is possible to think of the cyano bond as a “dumbbell” formed by the C and N atoms, coupled (through a “softer” spring) to the rest of the molecular structure. This is shown explicitly in the inset of Fig. 2. By being a localized vibration with a high frequency, the CN is particularly susceptible to isotopic substitution and, in particular, to the most common 12C13C replacement. The identification is helped by two facts: the shift also occurs in a region where there cannot be any overlap with other Raman active modes, thus facilitating its identification, and the shift is large (because it is proportional to the frequency of the mode) and the peak is narrow enough to produce a new peak that cannot be confused as a small shift of the normal case (that could have other origins, like anharmonic/thermal effects).
| cyanobenzene | Abundance | ||
| CN stretch | [cm-1] | [cm-1] | |
| 12C14N | 2332 | - | 98.53 % |
| 13C14N | 2277 | 55 | 1.1 % |
| 12C15N | 2303 | 29 | 0.37 % |
| 13C15N | 2247 | 85 | 0.004 % |
Considering initially the most abundant case: 12C14N, the reduced mass of the isolated “dumbbell” changes by for 12C13C. . Hence, the predicted frequency change in the cyano frequency is . More accurate values that consider the link of the “dumbbell” to the rest of the structure can be obtained by direct calculations with Density Functional Theory (DFT). One advantage of the the cyano bond is that, being a localized vibration, it can be modeled with any molecule that resembles the local chemical environment of the bond. For example, we can study the cyano bond dynamics in RH800 with calculations on the much smaller molecule cyanobenzene (C6H5CN) with obvious computational advantages. Further details of the calculations are provided in the supplementary information. A summary of the results is provided in Table 1. A frequency softening of between the most abundant form of the bond (12C14N) and next most abundant one (13C14N) is predicted by DFT. Such a shift is much larger than the linewidth of the corresponding Raman peak and therefore has to be easily observable in a small fraction of the SM-SERS spectra.
SERS spectra have been collected in immersion for RH800 in a silver (citrate-reduced) Lee & Meisel colloid 1982LeeJPC at 10 mM KCl. The experimental conditions were identical to those reported in our recent study of isotopologues of rhodamine in Ref. 2008BlackiePCCP . Spectra were obtained with a objective indexed-matched to water and the 633 nm line of a HeNe laser. Data were collected by a Jobin-Yvon LabRam spectrometer equipped with a notch filter and a nitrogen-cooled CCD. The dye concentration in the colloidal solution was 10 nM and 18000 spectra were taken with 0.2 sec integration time (with a 1 sec dwell time in between spectra, to ensure statistical independence). We know from previous characterizations of our system for similar experiments with the bi-analyte method 2008BlackiePCCP that we are in the conditions where many of the spectra are single molecule in nature, with a fraction of them having contributions from more than one molecule.
Once the spectra are taken, we need to find cases where the isotopically modified cyano bond is present. This implies looking for a “minority” of cases that will not contribute much to the average signal. We have done this using Principal Component Analysis (PCA) (as explained in the supplementary information), but this is not necessary and any method should render equivalent results. The big advantage of PCA is that it reduces the search for the appropriate spectra to a matter of seconds; a task that becomes very tedious otherwise when 18000 spectra need to be analyzed.
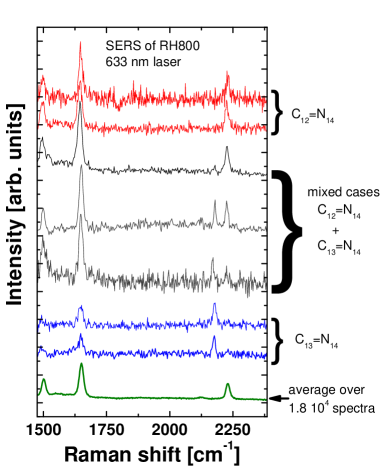
Figure 3 shows representative spectra of the different cases of interest here. The vast majority of events show the cyano bond Raman peak at . A closer look, however, reveals situations with mixed signals at the corresponding frequencies expected for 12C14N and 13C14N. These are equivalent to the mixed signals that appear in the standard bi-analyte method. The experimental frequency softening is , in excellent agreement with the DFT predictions (Table 1). We chose three spectra in Fig. 3 showing a larger, equivalent, or smaller intensity of the the 12C14N-peak with respect to that for 13C14N. Finally, we show cases where the signal comes only from the isotopically modified cyano bond (13C14N). The average SERS spectrum is also shown for direct comparison. It is interesting to note the small feature at with an integrated intensity times less than the cyano bond peak. This is assigned to an overtone band and has no relation to the isotopic spread. It does however give an idea of how small the 13C14N Raman peak should be in the average signal: times smaller than this overtone band, i.e. clearly undetectable in the average spectrum under the present conditions. This is in stark contrast with the SM-SERS spectra, where the (13C14N)-cyano bond signal can completely dominate the spectra. The single-molecule nature of the signals here enable us to access information, such as the isotope-induced shift, that are clearly washed out in the ensemble average.
The results of this paper provide inderectly another demonstration of SM-SERS sensitivity to the ones already known PCCPfeature ; 2008PieczonkaCSR ; Pettinger2008 . But with this aside, the main claim here is one step beyond another demonstration of SM-SERS sensitivity. We have indeed shown a specific example of how single-molecule SERS can be used as tool for the observation of weak spectroscopic features that are otherwise washed out in ensemble averaged spectra. Other types of spectroscopy (like fluorescence) would be completely insensitive to a change of one unit in the isotopic mass of one atom, even if single molecule sensitivity is achieved. We believe the observation of naturally occurring single-molecule isotopic fluctuations in SERS is a pleasing demonstration of the consistency of SM-SERS phenomena in revealing subtle aspects of molecular spectroscopy that cannot be observed otherwise. The spectra in Fig. 3 show, effectively, examples of single-molecule Raman spectra of molecules that differ from the others by one unit of atomic mass in one atom. Finally, it is also worth pointing out that the observation of natural isotopic spread with SM-SERS is not necessarily restricted to triple bonds. Options with chlorine-containing dyes could be particularly interesting to explore, for the natural isotopic spread of chlorine can produce a much more balanced list of naturally occurring isotopologues.
We are indebted to Sean Buchanan for help with the measurements. PGE and ECLR acknowledge partial support from the Royal Society of New Zealand (RSNZ) through a Marsden Grant.
Supplementary information available: details of DFT calculation and PCA analysis of the SERS spectra.
References
- (1) P. G. Etchegoin and E. C. Le Ru, Phys. Chem. Chem. Phys. 10, 6079 (2008).
- (2) E. C. Le Ru, M. Meyer, and P. G. Etchegoin, J. Phys. Chem. 110, 1944 (2006).
- (3) P. J. G. Goulet and R. F. Aroca, Anal. Chem. 29, 2728 (2007).
- (4) Y. Sawai, B. Takimoto, H. Nabika, K. Ajito, and K. Murakoshi, J. Am. Chem. Soc. 129, 1658 (2007).
- (5) J. A. Dieringer, R. B. Lettan II, K. A. Scheidt, and R. P. Van Duyne, J. Chem. Soc. Am. 129, 16249 (2007).
- (6) E. Blackie, E. C. Le Ru, M. Meyer, M. Timmer, B. Burkett, P. Northcote, and P. G. Etchegoin, Phys. Chem. Chem. Phys. 10, 4147 (2008).
- (7) J. R. De Laeter, J. K. Böhlke, P. De Bièvre, H. Hidaka, H. S. Peiser, K. J. R. Rosman, and P. D. P. Taylor, Pure Appl. Chem. 75, 683 (2003).
- (8) E. C. Le Ru and P. G. Etchegoin, Principles of Surface Enhanced Raman Spectroscopy (and related plasmonic effects) (Elsevier, Amsterdam, 2009).
- (9) P. C. Lee and D. Meisel, J. Phys. Chem. 86, 3391 (1982).
- (10) N. P. W. Pieczonka and R. F. Aroca, Chem. Soc. Rev. 37, 946 (2008).
- (11) J. Steidtner and B. Pettinger, Phys. Rev. Lett. 100, 236101 (2008).