Different superconducting percolation regimes in the layered organic Mott system -(BEDT-TTF)2Cu[N(CN)2]Cl – evidence from fluctuation spectroscopy
Abstract
Fluctuation spectroscopy is used to investigate the organic bandwidth-controlled Mott system -(BEDT-TTF)2Cu[N(CN)2]Cl. We find evidence for percolative-type superconductivity in the spatially inhomogeneous coexistence region of antiferromagnetic insulating and superconducting states. When the superconducting transition is driven by a magnetic field, percolation seems to be dominated by unstable superconducting clusters upon approaching from above, before a ”classical” type of percolation is resumed at low fields, dominated by the fractional change of superconducting clusters. The noise is resolved into Lorentzian spectra in the crossover region where the action of an individual mesoscopic fluctuator is enhanced.
pacs:
74.70.Kn, 71.30.+h, 72.70.+mMaterials in which magnetic, correlated metallic and superconducting phases compete for stability often show an intrinsic tendency to electronic phase separation, an effect which is intensively discussed for the high- cuprates and the manganites, see Kivelson2003 ; Dagotto2003 for reviews. For these correlated electron systems based on oxide materials, nano-scale inhomogeneities are reported including stripes and variations in the superconducting gap in high- materials Tranquada1995 ; KMLang2002 or the phase separation in doped manganese oxides Faeth1999 .
Recently, also for quasi-two-dimensional organic conductors -(BEDT-TTF)2X, where BEDT-TTF (or simply ET) is bis(ethylenedithio)tetrathiafulvalene and X stands for polymeric anions Toyota2007 , an inhomogeneous coexistence of antiferromagnetic insulating and superconducting phases is observed when the material is located in the vicinity of the first-order metal-to-insulator transition (MIT), which can be tuned either by altering the chemical composition of the material or by applying pressure Ito1996 ; Lefebvre2000 ; Miyagawa2002 ; Kagawa2004 ; Sasaki20045 .
Pressure studies of the compound with X = Cu[N(CN)2]Cl (-Cl hereafter) revealed a first-order MIT line Ito1996 ; Lefebvre2000 ; Limelette2003 ; Fournier2003 ; Kagawa2004 , indicative of a bandwidth-controlled Mott transition. The region of inhomogeneous phase coexistence in -Cl has been studied by simultaneous measurements of 1H-NMR and ac-susceptibility Lefebvre2000 , 13C-NMR Miyagawa2002 , and resistivity Ito1996 ; Kagawa2004 . Despite strong evidence for spatially and statically coexisting phases, the question was raised whether the coexistence was macroscopic or of mesoscopic type Lefebvre2000 . The details of spatial distribution, domain size, and stability of the inhomogeneous state are still under debate Sasaki20045 .
From resistance measurements, a percolative superconducting phase was suggested where tiny superconducting domains are induced progressively in the insulating host phase at small enough pressures Kagawa2004 , see phase diagram in Fig. 1.
In contrast, in partially deuterated samples of the material with X= Cu[N(CN)2]Br (-Br) metallic and insulating domains of macroscopic size (m) were found in real-space imaging employing scanning microregion-infrared spectroscopy Sasaki20045 below the critical temperature K of the first-order Mott transition.
In this Letter we report fluctuation spectroscopy measurements on bulk single crystals of the title organic charge-transfer salt aiming to investigate the percolative nature of the supercondicting transition in pressurized -Cl. We find evidence for different percolation regimes when the superconducting transition is driven by a magnetic field, and low-frequency switching of an individual mesoscopic fluctuating entity.
Single crystals of -(ET)2Cu[N(CN)2]Cl were grown by electrochemical crystallization as described elsewhere Williams1990 . Samples were of plate- and rod-like morphology with the smallest and longest dimension, respectively, perpendicular to the conducting planes.
In order to produce a small pressure, samples (denoted as -Cl∗ hereafter) have been embedded in a solvent-free epoxy, the slightly larger coefficient of thermal expansion of which results in a finite stress acting on the sample during cooldown. Although the exact pressure is not known a priori, the actual conditions have been found to be reproducible for different cooldowns. An effective pressure of bar on our samples has been estimated from the comparison to resistivity curves obtained from He-gas pressure experiments reported in the literature Kagawa2004 . These values are in good agreement with the effect on a superconducting reference compound for which the (known) pressure dependence of has been used as pressure ”gauge”.
Low-frequency resistance fluctuations have been measured by a standard bridge-circuit ac-technique Scofield1987 in a five- or six-terminal (-Cl∗) or four-terminal (-Cl) setup. The output signal of a lock-in amplifier (SR830) operating at a driving frequency of typically 517 Hz was processed by a spectrum analyzer (HP35660A). Care was taken to exclude that spurious noise sources contributed to the results.
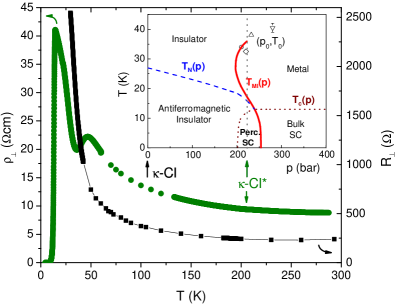
Fig. 1 compares the temperature dependence of the resistivity of -Cl∗ with that of the resistance of -Cl located at different positions in the temperature-pressure phase diagram shown in the inset. Due to the stress acting on the sample -Cl∗ embedded in epoxy, it exhibits a semiconducting (insulating) behavior down to about 46 K below which the resistivity shows a pronounced minimum following the transition into the metallic phase. The S-shaped transition line of the MIT (see inset) is crossed again leading once more to insulating behavior below about 22 K, where a kink in the resistivity curve is observed. Upon further cooling, the sample undergoes an insulator-to-superconductor transition at K (midpoint of the transition). The transition is rather broad due to the inhomogeneous nature of the coexistence region. The resistivity drops within K from 90 % to 10 % of its normal-state value. The observed behavior is in good agreement with the phase diagram determined from isobaric temperature and isothermal pressure sweeps by Kagawa et al. Kagawa2004 ; Kagawa2005 . The reference samples -Cl showed the expected semiconducting behavior down to low temperatures.
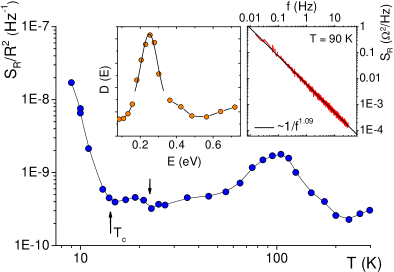
A typical noise power spectral density (PSD) of -Cl∗ taken at K is shown in Fig. 2 (right inset). At all temperatures above we observe a noise spectrum of generic -type with . The main panel shows the normalized noise taken at 1 Hz. We apply a phenomenological random fluctuation model introduced by Dutta, Dimon, and Horn (DDH) Dutta1979 based on the assumption that spectra are created by the superposition of a large number of random and independent switching entities called ”fluctuators”, which are assumed to linearly couple to the resistance of the sample:
| (1) |
Each fluctuator is characterized by a thermally-activated time constant , where is a characteristic attempt time of the order of an inverse phonon frequency, the activation energy of the process and Boltzmann’s constant. represents a certain distribution of activation energies that is deduced from the application of the DDH model to the temperature dependent noise (details of the analysis will be published elsewhere). The resulting (left inset of Fig. 2) exhibits a pronounced, roughly Gauss-shaped peak at an energy of meV. This energy is known as the signature of the orientational degrees of freedom of the ET molecules’ terminal ethylene moieties undergoing a glass-like transition at around 70 K Mueller2002a ; Toyota2007 , which corresponds to a certain degree of disorder. The peak energy agrees well with values of meV reported in the literature Miyagawa1995 ; Akutsu2000 ; Mueller2002a . This demonstrates that fluctuation spectroscopy provides a promising novel access to the microscopic transitions and dynamical molecular properties of the present materials.
Upon further cooling the sample, a small but distinct step-like increase in is observed at 22 K (see arrow in Fig. 2), which coincides with a kink in the resistivity (see Fig. 1 and text above). This feature is most likely due to the crossing of the MIT line when re-entering the insulating state, where an increase of the noise due to localization effects is expected. In the following we will focus on the transition into the superconducting state which goes along with a substantial rise of the noise level. We interpret its more than two-orders-of-magnitude increase when cooling through as a result of the percolative nature of the superconducting transition in this sample. Similar behavior has been observed for many high--cuprate samples, see e.g. Testa1988 ; Lee1989 ; Kiss1994 ; Kogan1996 and references therein. Qualitatively, in strongly disordered conductors, the resistance fluctuations are determined not by the entire volume of the conductor but by an essentially smaller volume leading to a large noise level Weissman1988 ; Kogan1996 . Alternatively, strongly disordered conductors exhibit much higher resistance noise than homogeneous or weakly disordered ones due to the strongly non-uniform current and electric field distribution confined to narrow paths.
We now apply ideas of percolation theory and treat the coexistence region close to the MIT as a mixture of superconducting and non-superconducting (normal or insulating) phases, i.e. a lattice of resistors with a temperature-dependent fraction that is short-circuited, simulating the superconducting links. For instance, one can think of a network of Josephson-coupled junctions formed by connections between superconducting grains or clusters. A wide distribution of junction critical currents (determined by inhomogeneities on the length scale of the superconducting coherence length) means that at a given macroscopic current , the local current can be either larger or smaller than which determines if the Josephson junction is superconducting or resistive. In this ”classical” percolation model Kiss1993b , the noise level is determined by fluctuating (non-superconducting) resistors , i.e. resistive junctions. With decreasing temperature, increases, so the noisy volume contributing to the macroscopic resistance fluctuations shrinks, which in turn leads to a divergence of the spectral density of fractional resistance fluctuations when approaching the percolation threshold from above, in agreement with our observations shown in Fig. 2.
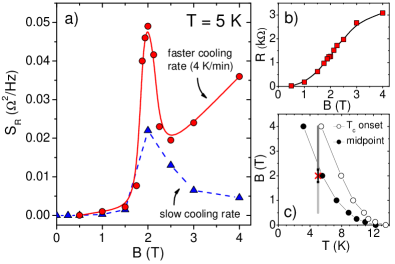
In the present materials, even when homogeneous, it is known that the effect of fluctuations is strongly enhanced in increasing magnetic fields Toyota2007 , which in combination with the percolative nature of superconductivity might enhance the signature of only a few fluctuators. Consequently, we have studied the percolation effects at the superconducting transition in more detail by performing isothermal noise measurements in magnetic fields applied perpendicular to the planes. Fig. 3 a) shows that the magnitude of the resistance noise at K strongly depends on the magnetic field exhibiting a pronounced peak at T, just below the midpoint of the superconducting transition, see Fig. 3 b) and c). Also, the PSD is sensitive to disorder in the ethylene endgroups degrees of freedom which can be tuned in the present compounds by applying different cooling rates Toyota2007 . Percolation theory predicts power-law scaling behavior in the variable which very often cannot be determined accurately. Thus, it is more convenient Kogan1996 to consider a scaling law , where is the resistor-superconductor (RS) network scaling exponent.
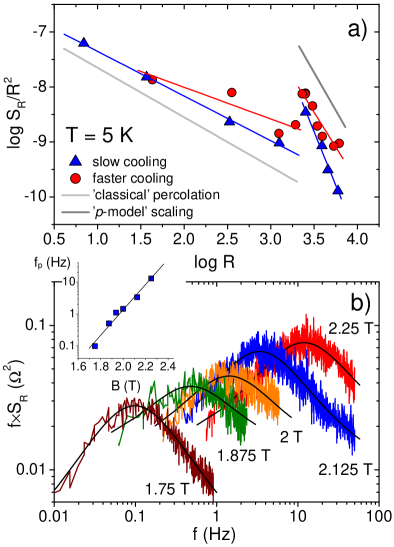
Surprisingly, as shown in Fig. 4 a), the transition is not just dominated by a single scaling law but rather by two percolation regimes (different slopes ) with an apparent discontinuity corresponding to the peak in the noise level. Deep in the superconducting phase (low fields), the scaling follows the prediction for a ”classical” RS network in 3D of Kiss1993b , whereas the slope when approaching superconductivity from above (high fields) is significantly larger. The slope we observe is close to the characteristic exponent of for the so-called -model in 3D Kiss1993a ; Kiss1993b , which has been first observed for thin-film high- superconductors. -noise, leading to a new class of universal scaling exponents, in the above-described picture corresponds to a random switching (on-off) of superconducting links in the RS network, i.e. spontaneous fluctuations of leading to fluctuations in the macroscopic resistance, which may be due to time-dependent perturbations of the Josephson coupling energy between superconducting clusters. When approaching from above, percolation seems to be dominated by unstable superconducting clusters/domains switching back and forth. At a field of 2 T, which is just below the midpoint of the resistive transition, the noise peaks and shows a crossover to a ”classical” percolation regime dominated by the change in the fraction of superconducting domains. Fig. 4 b) shows the PSDs as vs. at various fields in the vicinity of 2 T where the noise peaks. In this narrow field range we observe clear deviations from -type behavior which in this representation appears as a constant background. Obviously, under certain conditions (”noise window”) the spectra are resolved into Lorentzian contributions superimposed on a background. A Lorentzian PSD
| (2) |
represents a random telegraph signal between ”high” and ”low” resistance levels in the time domain Machlup1954 , where denote the characteristic lifetimes for the ”high” and ”low” states. Lines in Fig. 4 b) are fits to a background plus eq. (2) showing that an individual fluctuator dominates the noise. For the relative resistance change we infer %. The inset of Fig. 4 shows a clear shift of the peak frequency to higher values with increasing magnetic field. One may consider the fluctuating entity as a cluster that switches between the superconducting and normal state and assume a thermally activated behavior, for which at a given temperature the energy barrier depends on the magnetic field: . Here, denotes the energy barrier at zero field and the magnetic energy, for which we find a value of meV from the fit to the data, see inset of Fig. 4. If we compare this energy to the condensation energy density , where is the thermodynamic critical field and the free space permeability, we get a rough estimate for the fluctuating sample volume of comment . The estimated volume indicates a mesoscopic rather than a macroscopic inhomogeneous state. An alternative explanation would be that in an already superconducting cluster the vortices become temporarily pinned and unpinned, possibly going along with switching between vortex solid and liquid state. Assuming that in such a case may simply be compared to the pinning energy we find a value for which is smaller but in the same order as the one above.
In summary, the low-frequency electronic fluctuations in the spatially inhomogeneous coexistence state in pressurized -(ET)2Cu[N(CN)2]Cl indicate a crossover between different percolation regimes for the superconducting transition in finite magnetic fields. The data can be explained by a random-resistor network
consisting of superconductung and resistive domains for which we estimate a cluster volume in the order of a few hundred nm3.
Acknowledgements.
Work supported by the Deutsche Forschungsgemeinschaft (DFG) through the Emmy Noether program. J.M. is grateful to Dr. S. Wirth for helpful discussions. Work at Argonne National Laboratory is sponsored by the U. S. Department of Energy, Office of Basic Energy Sciences, Division of Materials Sciences, under Contract DE-AC02-06CH11357.References
- (1) S.A. Kivelson et al., Rev. Mod. Phys. 75, 1201 (2003).
- (2) E. Dagotto, Nanoscale Phase Separation and Colossal Magnetoresistance (Springer, Berlin Heidelberg, 2003).
- (3) K.M. Lang et al., Nature 415, 412 (2002).
- (4) J.M. Tranquada et al., Nature 375, 1201 (1995).
- (5) M. Fäth et al., Science 285, 1540 (1999).
- (6) N. Toyota, M. Lang, J. Müller, Low-Dimensional Molecular Metals (Springer, Berlin Heidelberg, 2007).
- (7) H. Ito et al., J. Phys. Soc. Japan 65, 2987 (1996).
- (8) S. Lefebvre et al., Phys. Rev. Lett. 85, 5420 (2000).
- (9) K. Miyagawa et al., Phys. Rev. Lett. 89, 017003 (2002).
- (10) F. Kagawa et al., Phys. Rev. B 69, 064511 (2004).
- (11) T. Sasaki et al., Phys. Rev. Lett. 92, 227001 (2004), J. Phys. Soc. Japan 74, 2351 (2005).
- (12) P. Limelette et al., Phys. Rev. Lett. 91, 016401 (2003).
- (13) D. Fournier et al., Phys. Rev. Lett. 90, 127002 (2003).
- (14) M. de Souza et al., Phys. Rev. Lett. 99, 037003 (2007).
- (15) J.M. Williams et al., Inorg. Chem. 29, 3272 (1990).
- (16) J.H. Scofield, Rev. Sci. Instr. 58, 985 (1987).
- (17) F. Kagawa et al., Nature 436, 534 (2005).
- (18) P. Dutta et al., Phys. Rev. Lett. 43, 646 (1979).
- (19) J. Müller et al., Phys. Rev. B 65, 144521 (2002).
- (20) K. Miyagawa et al., Phys. Rev. Lett. 75, 1174 (1995).
- (21) H. Akutsu et al., Phys. Rev. B 61, 4346 (2000).
- (22) J.A. Testa et al., Phys. Rev. B 38, 2922 (1988).
- (23) J.H. Lee et al., Phys. Rev. B 40, 6806 (1989).
- (24) L.B. Kiss and P. Svedlindh, IEEE Trans. El. Dev. 41, 2112 (1994).
- (25) Sh. Kogan, Electronic Noise and Fluctuations in Solids (Cambridge University Press, 1996).
- (26) M.B. Weismann, Rev. Mod. Phys. 60, 537 (1988).
- (27) L.B. Kiss and P. Svedlindh, Phys. Rev. Lett. 71, 2817 (1993).
- (28) L.B. Kiss at al., Physica C 207, 318 (1993).
- (29) S. Machlup, J. Appl. Phys. 25, 341 (1954).
- (30) For we use the value for -Br Toyota2007 .