Pressure-induced quenching of the charge-density-wave state observed by x-ray diffraction
Abstract
We report an x-ray diffraction study on the charge-density-wave (CDW) LaTe3 and CeTe3 compounds as a function of pressure. We extract the lattice constants and the CDW modulation wave-vector, and provide direct evidence for a pressure-induced quenching of the CDW phase. We observe subtle differences between the chemical and mechanical compression of the lattice. We account for these with a scenario where the effective dimensionality in these CDW systems is dependent on the type of lattice compression and has a direct impact on the degree of Fermi surface nesting and on the strength of fluctuation effects.
pacs:
71.45.Lr, 62.50.-p, 61.05.cpLow dimensionality plays an important role in condensed-matter physics owing to the observation of intriguing phenomena such as the formation of spin- and charge-density-waves (CDW), as well as non Fermi-liquid behavior of the electronic properties in a variety of materials CDW ; LeoBook . A revival of interest in low-dimensional interacting electron gas systems, and in their wealth of astonishing properties, took place since the discovery of high-temperature superconductivity in the layered two-dimensional (2D) copper oxides. This furthermore led to the quest for prototype layered systems, allowing a systematic study of these phenomena. In this context, the rare-earth tri-tellurides (Te3, with =La-Sm, Gd-Tm) were recently revisited and recognized as a paramount example of easily tunable 2D materials. Their crystal structure is weakly orthorhombic (pseudotetragonal) struct ; LattConst ; foot_struct and is composed of corrugated Te2 slabs alternating with pairs of Te-layers, stacked along the (long) axis. The formation of the CDW condensate, hosted within Te-layers, is to a large extent driven by the nesting of the Fermi-surface (FS) Dimasi ; Brouet , which is thus gapped over a sizeable portion. Systematic x-ray diffraction (XRD) studies of the Te3 series revealed that the modulation vector ( is the reciprocal lattice vector of the axis) is almost the same for every member of this family qCDW , and that the CDW state is progressively suppressed as the lattice is chemically compressed (i.e., going from =La to =Tm) ICDW . The transition temperature is 250 K for TmTe3, increases gradually up to 410 K in SmTe3 ICDW , and is larger than 450 K in the tri-tellurides with lighter rare-earth elements (=La-Nd) qCDW . A corresponding strong reduction of the CDW gap with chemical pressure was then established on the basis of optical-spectroscopy experiments IR_PRB . Subsequent light scattering experiments on the same series of compounds showed that the CDW gap reduction is accompanied by a progressive disappearance of the signal from the Raman active phonon modes Raman . The same effects have been observed in the light rare-earth tri-tellurides under external hydrostatic pressure: infrared reflectivity experiments on CeTe3 at high-pressures IR_PRL as well as on the related LaTe2 compound LaTe2_HP revealed a pressure-induced reduction of the CDW gap, while the Raman-active phonons in LaTe3 and CeTe3 disappeared Raman .
In this Letter we present a high-pressure XRD diffraction study on LaTe3 and CeTe3, with the goal of monitoring the evolution of the CDW distortion with pressure. We establish a pressure-induced quenching of the CDW state and show that, while there is general equivalence between physical and chemical pressure, there are also important subtle distinctions. We speculate that this is due to differences in the effective dimensionality that derive from the chemical and physical lattice compression and from the resulting interplay between FS instabilities and fluctuation effects.
The LaTe3 and CeTe3 single-crystals were grown as described in Ref. Ru, . Small ( m3) sample slabs were placed inside the hole (initial diameter 250 m) of a stainless steel gasket of a membrane driven diamond anvil cell (DAC, culet size 600 m) together with He as pressure transmitting medium and a 5 m diameter ruby sphere for pressure calibration Mao . Diffraction images were collected at the ID09A beamline of the ESRF with a monochromatic beam ( Å) focussed to m2 using a MAR345 image plate detector. During exposure the pressure cells were rotated around the -axis. Here at =0 the incident x-rays are along the -axis and rotates the axis about the incoming beam direction. Total rotation ranges were 40∘ with standard 1.5 mm high diamond anvils and 60∘ with cells modified for Boehler-Almax anvils Boehler . For the low temperature measurements the DAC was placed inside a He flow cryostat with the rotation range limited to . These latter measurements were performed on coarse polycrystalline samples.
XRD patterns were collected at room temperature as a function of pressure for LaTe3 and CeTe3 single crystal and as a function of temperature for a LaTe3 polycrystal at GPa. Representative areas of the diffraction patterns at selected pressures and temperatures are shown in Fig. 1.
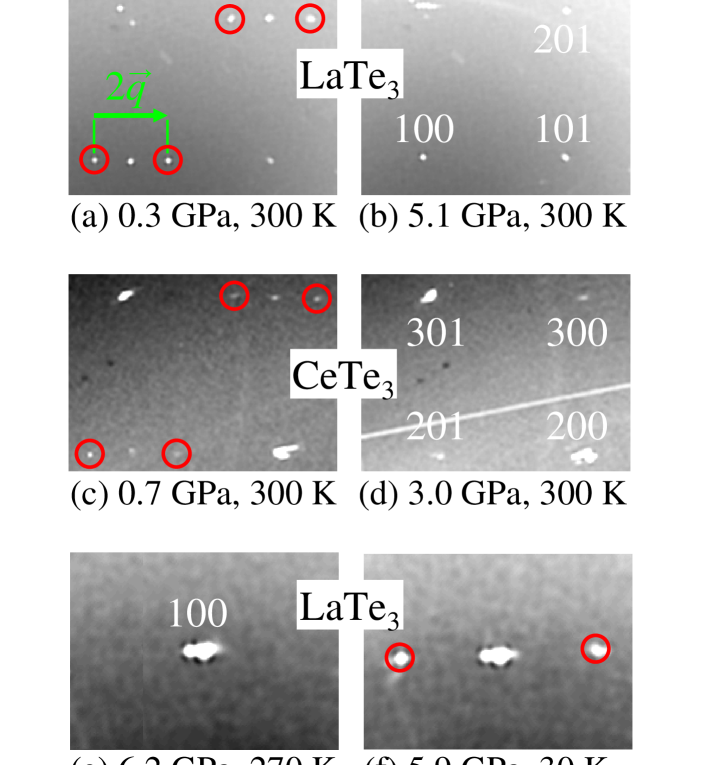
At low-pressure and at 300 K, several Bragg-peaks in both LaTe3 and CeTe3 display pairs of satellites, which are due to the modulated CDW lattice-distortion ICDW . Upon increasing pressure, the intensity of these satellite peaks is progressively reduced and they eventually disappear at high enough pressure (3 and 5 GPa in CeTe3 and LaTe3, respectively) as shown in Fig. 1(a-d). At GPa the satellite peaks in LaTe3 are recovered by cooling the polycrystalline specimen well below 300 K [see Fig. 1(e,f)]. This indicates that at this pressure the CDW transition occurs at a lower critical temperature (i.e., 300 K).
From the positions of selected Bragg peaks we obtained the lattice parameters and thus the unit-cell volume. The corresponding results for CeTe3 under pressure at 300 K and for LaTe3 as a function of temperature at GPa are shown in Fig. 2.
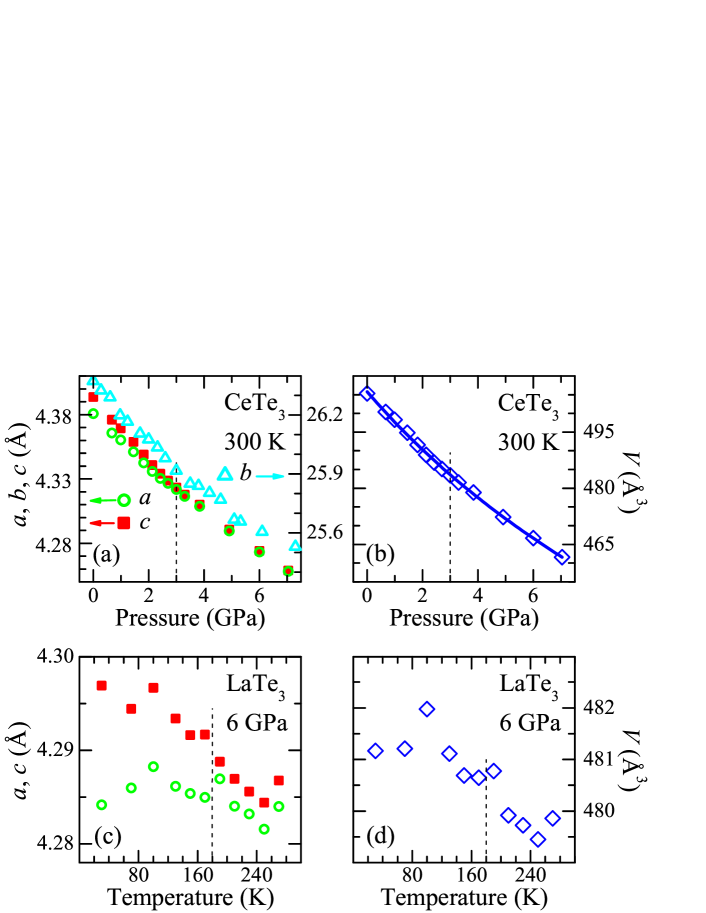
The pressure experiment on LaTe3 at room temperature provides similar results (not shown) as for CeTe3. At ambient pressure the slight orthorhombic distortion of the unit-cell results in a small difference between the in-plane lattice parameters and foot_struct . Upon increasing pressure this difference between the and axes decreases and both lattice constants become nearly indistinguishable above 3 GPa in CeTe3 [Fig. 2(a)]. A similar effect is observed in LaTe3 at 5 GPa and was previously reported for Te3 with =Sm-Tm on crossing at ambient pressure ICDW . The unit-cell volume [Fig. 2(b)] decreases smoothly with pressure and follows the Birch-Murnaghan equation of state Murnaghan :
| (1) |
with the bulk-modulus GPa and its pressure-derivative . The fitted value is in reasonable agreement with a previous estimate IR_PRL from specific heat data SpecHeat while lies within the typical range of 4-8 Bprime . A change in the temperature dependence of the and lattice constant is also observed when lowering the temperature below 180 K in LaTe3 at 6 GPa [Fig. 2(c)]. While the scatter in the data is more pronounced than in the experiment as a function of pressure at fixed temperature, the tendency for and to diverge below 180 K is evident, like the weak discontinuity in the unit-cell volume [Fig. 2(d)]. The overall temperature dependence of the lattice parameters is very similar to that observed at ambient pressure in the heavy rare-earth tri-tellurides ICDW , suggesting an analogous impact of both chemical and applied pressure on the structural properties of Te3.
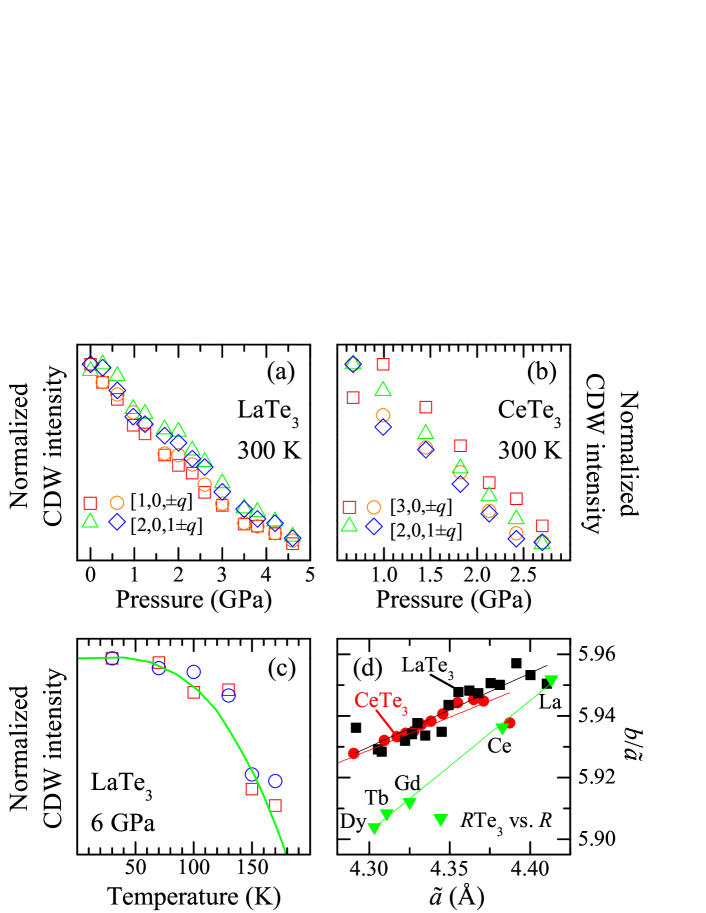
The most compelling result of our investigations is the observation that the integrated intensities of the CDW satellite peaks gradually decrease with increasing pressure at 300 K, and vanish at 5 and 2.8 GPa in LaTe3 and CeTe3, respectively [Fig. 3(a) and (b)]. This finding shows that the CDW state, observed at ambient pressure and 300 K in these compounds, is quenched by a moderate lattice compression of about 5% of the volume. This is moreover consistent with the previously reported pressure-induced reduction of the CDW gap IR_PRL and of the integrated intensities of the Raman-active phonon modes Raman . The temperature dependence of the intensities of the CDW satellite peaks of LaTe3 at 6 GPa [Fig. 3(c)] is also similar to that of the heavy rare-earth tri-tellurides at ambient pressure ICDW , supporting again a qualitative equivalence between chemical and applied pressure in order to achieve the lattice compression. We note that the satellite intensities are consistent with the BCS behavior BCS with K, bearing a striking similarity with results on prototype 1D systems CDW .
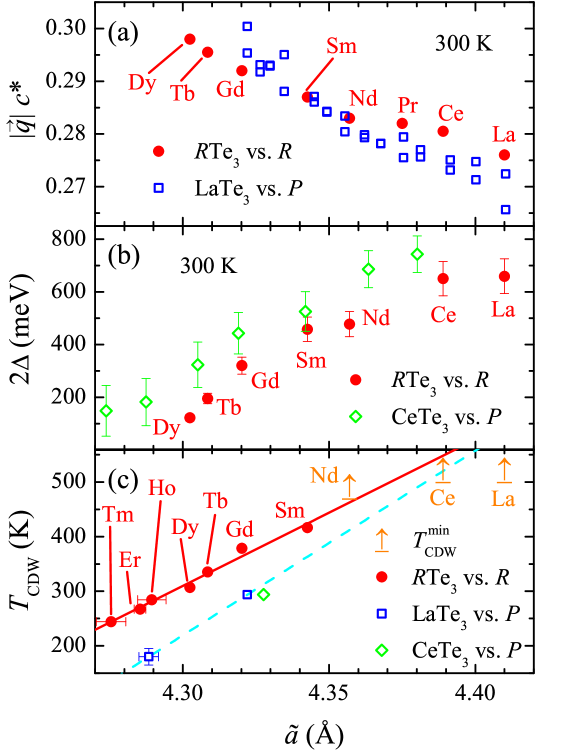
To further test the extent of equivalence between chemical and applied pressure, we first define the average in-plane lattice parameter , which is related to the Te-Te distance within the Te-layers. can be considered as a common variable for several quantities measured upon compressing the lattice. We then plot in Fig. 3(d) the quantity , which is representative of the anisotropy ratio between the inter- and intra-plane Te-Te distances, for the Te3 series LattConst ; ICDW and for LaTe3 and CeTe3 under applied pressure using the data from Fig. 2(a). Despite some scatter in the data there is a clear trend, showing a significantly more pronounced decrease of in the chemical series than in the applied pressure experiment. The -dependence of the CDW modulation wave-vector , extracted from the positions of the satellite peaks (Fig. 1), for the Te3 series at 300 K qCDW and for LaTe3 as a function of pressure is shown in Fig. 4(a). The magnitude of monotonously increases with increasing pressure. The similarity of with chemical and applied pressure is suggestive of an equivalent modification of the FS and thus of its nesting properties Brouet ; IR_PRB , upon compressing the lattice. The -dependence of the CDW gap (averaged over the FS) for the Te3 series at 300 K IR_PRB and for CeTe3 under pressure IR_PRL is shown in Fig. 4(b). The comparison here is much better than that reported in Ref. IR_PRL, , which was based on a crude estimation of . The two data sets follow the same trend and within the experimental error the values for both experiments are almost identical. From our data we can furthermore exclude that the CDW gap in the chemical Te3 series is larger than in CeTe3 under pressure. Some educated guesses can be also advocated as far as the pressure dependence of the critical temperature is concerned. From our isothermal experiments at 300 K on LaTe3 and CeTe3 we obtain two points in the phase diagram and an additional data point is extracted from the isobaric experiment at GPa on LaTe3 [i.e., converting the pressure at which the satellite peaks disappear into a corresponding lattice constant (Fig. 2)]. These data are then compared in Fig. 4(c) with of the Te3 series measured at ambient pressure ICDW . For =La, Ce, and Nd only the lower limits of are known qCDW .
While these findings confirm the overall qualitative equivalence between chemical and applied pressure, they show that a subtle difference exists between the two types of lattice compression. In contrast to our observations for [Fig. 4(b)], we note that is systematically larger for the chemical pressure than for applied pressure. This is unexpected. We speculate that such a behavior is due to a difference in the effective dimensionality of the system when compressing the lattice chemically compared with applied pressure: specifically, the effective dimensionality is larger (more three dimensional) for chemical pressure. This intriguing possibility is consistent with the observation that the relative change of between LaTe3 and DyTe3 at ambient pressure is roughly a factor two larger than, for instance, in LaTe3 between 0 GPa ICDW and 5.5 GPa, for which is the same as in DyTe3 at ambient pressure [Fig. 3(d)]. The lower effective dimensionality achieved by applied pressure implies stronger fluctuations and therefore a reduced transition temperature. At the same time, if the reduced dimensionality has an effect at all on the FS properties, this might lead to a better FS nesting and thus a possible larger (average) gap . A detailed structural study devoted to the determination of the internal atomic coordinates in the unit-cell is required to confirm this speculative scenario. Nonetheless, a crude linear extrapolation of the data with chemical pressure and with applied pressure on LaTe3 [Fig. 4(c)] leads to an intersection at Å, which compares nicely with the zero-pressure value for LaTe3 LattConst .
In summary, we have reported a high-pressure XRD study on the CDW LaTe3 and CeTe3 compounds. The pressure dependence of the in-plane lattice parameters is consistent with a pressure-induced reduction of the -tetragonal phase, i.e. of the lattice distortion accompanying the formation of the CDW condensate. This is similar to what has been observed upon cooling across the CDW transition in LaTe3 at high pressure (present work), as well as at ambient pressure in the heavy rare-earth tri-tellurides ICDW . More striking evidence of the pressure-induced quenching of the CDW phase is provided by the intensities of the CDW satellite peaks, which tend to zero with increasing pressure. Such observations support ideas based on the equivalence between chemical and applied pressure in Te3, put forward in our previous work IR_PRB ; Raman ; IR_PRL . Nevertheless, subtle differences between the two types of lattice compression were revealed. Those could be accounted by differences in effective dimensionality, and hence the impact of fluctuations and FS nesting, upon lattice compression achieved by either chemical substitution or hydrostatically.
Acknowledgements.
The authors wish to thank R. Monnier for fruitful discussions. This work has been supported by the Swiss National Foundation for the Scientific Research as well as by the NCCR MaNEP pool and also by the Department of Energy, Office of Basic Energy Sciences under contract DE-AC02-76SF00515. Portions of this research were carried out at the Stanford Synchrotron Radiation Laboratory, a national user facility operated by Stanford University on behalf of the U.S. Department of Energy, Office of Basic Energy Sciences.References
- (1) G. Grüner, Density Waves in Solids, Addison Wesley, Reading, MA (1994).
- (2) Strong Interactions in Low Dimensions, Eds. D. Baeriswyl and L. Degiorgi, Kluwer Academic Publishers, Dordrecht (2004).
- (3) B.K. Norling and H. Steinfink, Inorg. Chem. 5, 1488 (1966).
- (4) P. Villars and L.D. Calvert, Pearson’s Handbook of Crystallographic Data for Intermetallic Phases, American Society for Metals, Metals Park, OH (1991).
- (5) The crystal structure of Te3 belongs to the space group struct , which is orthorhombic. However, the in-plane lattice constants and differ by approximately (-)/ and 0.5% in CeTe3 and LaTe3, respectively (in the standard space group setting, the -axis is perpendicular to the Te planes).
- (6) E. DiMasi et al., Phys. Rev. B 52, 14516 (1995).
- (7) V. Brouet et al., Phys. Rev. Lett. 93, 126405 (2004).
- (8) C.D. Malliakas and M.G. Kanatzidis, J. Am. Chem. Soc., 128, 12612 (2006).
- (9) N. Ru et al., Phys. Rev. B 77, 035114 (2008).
- (10) A. Sacchetti et al., Phys. Rev. B 74, 125115 (2006).
- (11) M. Lavagnini et al., cond-mat 0806.1455 (2008), to be published in Phys. Rev. B (in press).
- (12) A. Sacchetti et al., Phys. Rev. Lett. 98, 026401 (2007).
- (13) M. Lavagnini et al., Phys. Rev. B 77, 165132 (2008).
- (14) N. Ru and I.R. Fisher, Phys. Rev. B 73, 033101 (2006).
- (15) H.K. Mao, J. Xu, and P.M. Bell, J. Geophys. Res. 91, 4673 (1986).
- (16) R. Boehler and K. De Hantsetters, High Press. Res. 24, 391 (2004).
- (17) F.D. Murnaghan, P. Natl. Acad. Sci. U.S.A. 30, 244 (1944).
- (18) K.Y. Shin et al., Phys. Rev. B 72, 085132 (2005).
- (19) S. Jiuxun et al., J. Phys. Chem. Solids 66, 773 (2005).
- (20) M. Tinkham, Introduction to superconductivity, Ed., McGraw-Hill, New York (1996).