The Environmental Influence on the Evolution of Local Galaxies
Abstract
The results of an H photometric survey of 30 dwarf galaxies of
various morphologies in the Centaurus A and Sculptor groups are presented.
Of these 30, emission was detected in 13: eight are of late-type, two are
early-type and three are of mixed-morphology. The typical flux detection limit of
erg s-1 cm-2, translates into a Star
Formation Rate (SFR) detection limit of
4yr-1.
In the light of these results, the morphology-density relation is reexamined: It is shown that, despite a number of unaccounted parameters, there are significant correlations between the factors determining the morphological type of a galaxy and its environment. Dwarf galaxies in high density regions have lower current SFR and lower
neutral gas content than their low
density counterparts, confirming earlier results from the Local Group and other denser environments.
The effect of environment is also seen in the timescale formed from the ratio of blue luminosity to current SFR - dwarfs in higher density environments have larger values, indicating relatively higher past average SFR.
The influence of environment extends very far and no
dwarfs from our sample can be identified as ‘field’ objects.
1 Introduction
Constraining the evolutionary parameters for local galaxies is a difficult task. Empirical evidence has shown that the physical properties of a stellar system depend on a poorly constrained mixture of environmental and internal influences. For example, galaxies are known to follow a morphology-density relation where the early-types are found in denser environments than late-types (Dressler, 1980; Postman & Geller, 1984; Binggeli et al., 1990; Whitmore & Gilmore, 1991). This relation also holds for Local Group dwarfs where dwarf Spheroidals (dSph) and dwarf Ellipticals (dE) are located closer to the Milky Way or M31 than dwarf Irregulars (dIrr) (Einasto et al., 1974; van den Bergh, 1994). However, discrepancies remain within this relation and some galaxies with similar morphologies, evolving under comparable environmental conditions, can have different properties, e. g., the two early-type dwarfs NGC147 and NGC185 have largely different interstellar medium (ISM) content (see Mateo, 1998). Indeed, it may be that environment plays a subordinate role to local processes in the determination of their basic properties such as gas content and star formation rate (Dellenbusch et al., 2008).
The mixed-morphology dwarfs may help to identify these evolutionary parameters. Five such objects exist in the Local Group (i. e., LGS3, Phoenix, Antlia, DDO210 and Pegasus). While all five contain sizable amounts of neutral hydrogen (Hi) (Lo et al., 1993; Young & Lo, 1997; St-Germain et al., 1999; Barnes et al., 2001) and all show evidence for recent star formation (Mateo, 1998, and references therein), they also display the smooth ellipsoidal light distribution typically attributed to the old stellar population of early-type dwarfs. These intermediate-type galaxies may be evolving objects currently undergoing the final transition from late to early-type (Mayer et al., 2001; Pedraz et al., 2002; Simien & Prugniel, 2002; Grebel et al., 2003; De Rijcke et al., 2003, 2004; van Zee et al., 2004; Read & Gilmore, 2005).
One of the main aspects involved in studying the evolution of a galaxy is the evolution of its stellar population. As such, it will depend on three parameters: its past, present and future star formation rates (SFR). Only the present SFR can be readily measured, from the intensity of the H emission (e. g., Kennicutt et al., 1994). For past and potential future star formation, this information can be extrapolated from various observational measurements. For instance, stellar populations (e. g., Martínez-Delgado & Aparicio, 1997) and morphology both reflect past star formation, and Hi measurements allow extrapolation of possible further star formation.
In this context, the morphology-density relation implies that the past SFR of a galaxy is regulated by the local environment. It has been established that the fraction of galaxies sustaining current star formation decreases near the projected density center of galaxy clusters (Ellingson et al., 2001; Lewis et al., 2002; Gómez et al., 2003; Balogh et al., 2004; Rines et al., 2005) and this effect can be measured out to several virial radii. One explanation is that ram pressure between the galaxy’s interstellar medium (ISM) and the cluster’s intergalactic medium (IGM) removes the Hi gas supply for galaxies dwelling in high density regions, where this phenomenon is most effective due to the large relative velocities. These Hi depleted objects will basically see their on-going star formation terminate due to the lack of gas, while the galaxies in the outskirts should not be affected.
For nearby dwarf galaxies, detailed studies of SFR and star formation history (SFH) (Grebel, 2001; Skillman et al., 2003; Tolstoy et al., 2004), stellar population (Jerjen & Rejkuba, 2001; Karachentsev et al., 2002, 2007), structure (Jerjen et al., 2000a, c; Coleman et al., 2004, 2005), Hi content (Côté et al., 1997; Blitz & Robishaw, 2000; Huchtmeier et al., 2000; Koribalski et al., 2004; Chemin et al., 2006) and ISM abundances (Lee et al., 2007) are readily available. It is, however, not clear how environmentally driven evolution operates outside of the high galaxy densities of cluster environments (e. g., in the Local Group). Nevertheless, since many recent efforts have been made to measure line-of-sight distances to galaxies in the Sculptor and Centaurus A groups (Jerjen et al., 1998, 2000b, 2001; Karachentsev et al., 2002, 2003, 2004, 2007) it is now possible to use these groups to study the correlation between dwarf evolution indicators and the direct 3-dimensional galaxy distribution. The Centaurus A group is a much denser environment than the Sculptor group and we thereby expect the former’s environmental impact to be greater than the latter’s (Bouchard et al., 2007).
This paper presents the results of H observations of selected dwarf galaxies in the nearby Centaurus A and Sculptor groups. The aim was to complete the global picture of current star formation for these galaxies and the ultimate fate of their ISM. This enables us to constrain the role of the environment on the evolution of nearby dwarf galaxies. It also allows us to probe and explain the local morphology-density relation in a regime of much lower densities than those of clusters.
2 Observations
2.1 A note on galaxy classification
The specific galaxy classification scheme used throughout this paper (column 4 of Tables 1 and 2) comes from the literature and is most often based on integrated photometry from optical B band images (see Sandage & Binggeli, 1984; de Vaucouleurs et al., 1991). Consequently, these morphologies are a measure of the relative importance and distribution of the young, very bright stars with respect to an older and fainter underlying stellar population. Obviously, such classification is rather loose as it depends on a number of unrelated factors, such as seeing conditions. The classification scheme is refined as new observations become available (e. g., colour-magnitude diagrams) and galaxies may be swapped from one category to another.
We also use a more general, early vs. late type classification, conveying less information about the stellar distribution in the objects. Explicitly, early-type galaxies should be objects lacking any obvious young stellar population, having no ongoing star formation (i. e., no H emission) and no detectable ISM (i. e., no Hi emission); late-type galaxies should have an important young stellar population, ongoing star formation and a sizeable amount of ISM. Any other object, e. g., one dominated by old stars, where Hi emission is detected but not H, should be classified as a mixed-type. In many cases, there has been no attempt to measure Hi or H fluxes and the classification is simply inferred from the Hubble sequence. One of the secondary aims of this paper is to verify the galaxy classification by providing some of the missing H measurements for early-type dwarf galaxies.
2.2 The Centaurus A and Sculptor galaxy groups
A list of all known galaxies in the Centaurus A (CenA) and Sculptor (Scl) galaxy groups (Tables 1 and 2, respectively) has been compiled from the catalogues in Côté et al. (1997), Jerjen et al. (2000a) and Karachentsev et al. (2004, 2007). The first reference provides a good overview of the groups with a bias towards Hi rich dIrrs. The latter three articles expand the list of objects associated with the groups and remove some spurious Hi detections. We believe this combined catalogue to be a representative sample of the real galactic populations residing in the two groups.
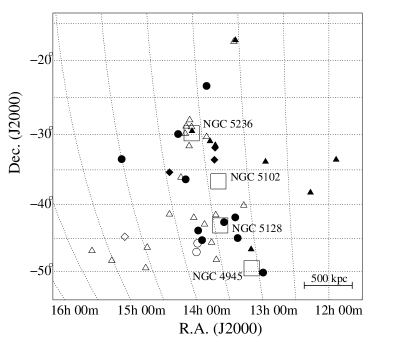
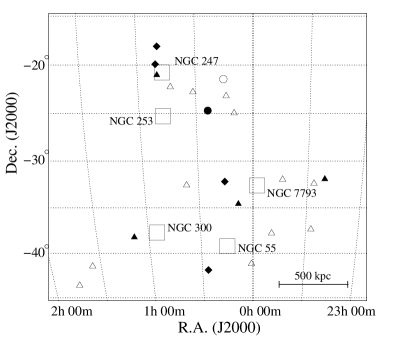
Figure 1 shows the spatial distribution of galaxies in the two groups and highlights the fundamentally different environments represented. Not only is the number of early-type dwarfs much greater in CenA than in Scl, but also the CenA dwarf galaxies are more clustered around NGC5128 and NGC5236 than the Scl dwarfs are around any of the major group members.
2.3 Target selection
The CenA group (Table 1) contains 58 galaxies. Of these, 17 are classified as having an early-type morphology, 37 are of late-type and 4 are mixed. The four galaxies of unknown types are presumably of late morphology and have been used as such. The faintest galaxies, [KK2000]55 and LEDA166172, have an apparent integrated magnitude of = 18.5 and the list is probably complete down to . Based on the entries in Table 1 the CenA group is at an average distance of 0.75 Mpc (standard deviation), and has an average systemic heliocentric velocity of 275 km s-1.
The Scl group (Table 2) is composed of 27 galaxies, 1 of early type, 22 late types and 4 mixed. These are at an average distance of 1.6 Mpc and average velocity of 190 km s-1, based on Table 2 data. The faintest object has and the group is probably complete to .
The focus of our observations was to constrain the characteristics of galaxies at the low end of the luminosity function because these objects are more likely to be affected by environmental parameters than the ones with higher luminosities. Consequently, little attention was given to brighter members of the groups. We observed a selection of dwarf galaxies within the two groups, provided they are of low luminosity () and no H measurements could be found in the literature. A consequence of these criteria is that nearly all known low mass early-type galaxies of the CenA and Scl groups were observed, randomly leaving out some of the faintest ones () because of limited observing time. Moreover, some objects (mostly late-types) satisfying the luminosity constraint were already observed in H by Côté et al. (2008) hence were also left out of the present study. For comparison purposes, previously observed objects were randomly added to our selection. Our final sample can be found in Table 3 and was highlighted in Tables 1, 2 with asterisks in front of the galaxy name, as well as in Figure 1 with filled symbols.
| Galaxy | RA | Dec | Type | Ref. | |||
|---|---|---|---|---|---|---|---|
| (J2000) | (J2000) | (Mpc) | (km s-1) | ||||
| ESO379-G007 | 11:54:43 | -33:33:36 | dIrr | 16.60.09 | 5.20.5 | 6414 | 1, 2 |
| ESO321-G014 | 12:13:49 | -38:13:53 | IBm | 15.210.09 | 3.20.3 | 6103 | 1, 2 |
| ESO381-G018 | 12:44:42 | -35:58:00 | Irr | 15.720.1 | 5.30.4 | 3 | |
| ESO381-G020 | 12:46:00 | -33:50:13 | IB(s)m | 14.240.09 | 5.50.5 | 5892 | 2, 3 |
| ESO443-G009 | 12:54:53 | -28:20:27 | dIm | 17.060.1 | 5.80.5 | 3 | |
| ESO219-G010 | 12:56:09 | -50:08:38 | dE,N | 16.40.2 | 4.80.4 | 4, 5 | |
| UGCA319 | 13:02:14 | -17:14:15 | IB(s)m | 15.330.1 | 7554 | 2, 6 | |
| DDO161 | 13:03:16 | -17:25:23 | IB(s)m_sp | 13.50.1 | 2, 6 | ||
| ESO269-G037 | 13:03:33 | -46:35:06 | dSph | 16.290.09 | 3.50.4 | 7442 | 1, 7 |
| [CFC97]Cen6 | 13:05:02 | -40:04:58 | dIrr | 16.330.1 | 5.80.5 | 3, 7 | |
| NGC4945 | 13:05:27 | -49:28:05 | SB(s)cd(Sy2) | 9.40.2 | 3.80.3 | 2, 3 | |
| ESO269-G058 | 13:10:32 | -46:59:27 | I0 pec | 13.30.1 | 3.80.3 | 3 | |
| CenA-dE1 | 13:12:45 | -41:49:57 | dSph | 17.750.1 | 4.20.3 | 3, 5 | |
| ESO269-G066 | 13:13:09 | -44:53:24 | dE,N | 14.590.08 | 4.10.5 | 78030 | 4, 5 |
| HIPASSJ1321-31 | 13:21:08 | -31:31:45 | dIrr | 17.10.1 | 5.20.3 | 5713 | 2, 6 |
| CenA-dE2 | 13:21:33 | -31:52:43 | dE/dIm | 18.10.2 | 5 | ||
| [KK98]196 | 13:21:47 | -45:03:48 | IBm | 16.10.1 | 4.00.3 | 3 | |
| NGC5102 | 13:21:57 | -36:37:48 | SB(s)b | 10.00.2 | 3.40.4 | 1, 2 | |
| SGC1319.1-4216 | 13:22:02 | -42:32:07 | dE | 15.70.1 | 3.90.3 | 3, 5 | |
| [KK2000]55 | 13:22:12 | -42:43:51 | dSph | 18.50.1 | 3.90.3 | 3 | |
| [CFC97]Cen8 | 13:22:56 | -33:34:22 | Im/dE | 17.650.08 | 5 | ||
| AM1320-230 | 13:23:29 | -23:23:35 | dE | 17.530.08 | 5 | ||
| AM1321-304 | 13:24:36 | -30:58:19 | dIm | 16.70.1 | 4.60.5 | 4853 | 1 |
| NGC5128 | 13:25:27 | -43:01:08 | S0pec(sy2) | 7.840.09 | 3.80.4 | 2, 8 | |
| IC4247 | 13:26:44 | -30:21:44 | S? | 14.410.09 | 5.00.4 | 3 | |
| ESO324-G024 | 13:27:37 | -41:28:50 | IABm | 12.910.09 | 3.70.4 | 1, 2 | |
| NGC5206 | 13:33:44 | -48:09:04 | SB0 | 11.620.09 | 3.50.3 | 3, 6 | |
| ESO270-G017 | 13:34:47 | -45:32:51 | SB(s)m: | 11.690.09 | 4.30.8 | 2, 3 | |
| UGCA365 | 13:36:31 | -29:00:00 | Im | 15.490.09 | 5.20.4 | 3, 7 | |
| [KK98]208 | 13:36:35 | -29:34:17 | dIrr | 14.30.1 | 4.70.4 | 1 | |
| NGC5236 | 13:37:00 | -29:51:56 | SAB(s)c | 8.220.09 | 5.20.4 | 2, 3 | |
| DEEPJ1337-33 | 13:37:00 | -33:21:47 | ? | 17.30.1 | 4.50.5 | 6 | |
| ESO444-G084 | 13:37:20 | -28:02:42 | Im | 15.010.09 | 4.60.5 | 1, 2 | |
| HIPASSJ1337-39 | 13:37:25 | -39:53:52 | Im | 16.50.1 | 4.90.5 | 2, 6 | |
| NGC5237 | 13:37:39 | -42:50:49 | I0? | 13.260.09 | 3.40.3 | 2, 3 | |
| NGC5253 | 13:39:55 | -31:38:24 | Im_pec | 11.170.09 | 3.70.3 | 2, 9 | |
| IC4316 | 13:40:18 | -28:53:38 | IBm? pec | 15.00.2 | 4.40.4 | 1 | |
| NGC5264 | 13:41:36 | -29:54:47 | IB(s)m | 12.60.2 | 4.50.5 | 1, 2 | |
| [KK2000]57 | 13:41:38 | -42:34:55 | dSph | 18.10.1 | 3.90.3 | 3 | |
| AM1339-445 | 13:42:05 | -45:12:18 | dE | 16.320.1 | 3.50.3 | 5, 10 | |
| LEDA166172 | 13:43:36 | -43:46:11 | dSph | 18.50.1 | 3.60.4 | 1 | |
| ESO325-G011 | 13:45:00 | -41:51:40 | IB(s)m | 14.020.09 | 3.40.4 | 1, 2 | |
| CenA-dE3 | 13:46:00 | -36:20:15 | dE | 17.40.2 | 5 | ||
| AM1343-452 | 13:46:16 | -45:41:05 | dSph | 17.60.1 | 3.70.3 | 5, 10 | |
| CenA-dE4 | 13:46:40 | -29:58:41 | dE | 17.60.1 | 5 | ||
| CenN | 13:48:09 | -47:33:54 | ? | 17.50.6 | 3.70.3 | 3 | |
| HIPASSJ1348-37 | 13:48:33 | -37:58:03 | ? | 16.90.1 | 5.80.5 | 3 | |
| LEDA166179 | 13:48:46 | -46:59:46 | dSph? | 180.1 | 4.00.4 | 1 | |
| ESO383-G087 | 13:49:18 | -36:03:41 | SB(s)m | 110.09 | 3.50.3 | 2, 3 | |
| HIPASSJ1351-47 | 13:51:22 | 47:00:00 | ? | 17.50.1 | 5.70.5 | 3 | |
| ESO384-G016 | 13:57:01 | -35:20:01 | dS0/Im | 15.110.06 | 4.50.4 | 56030 | 4, 5 |
| NGC5408 | 14:03:20 | -41:22:39 | IB(s)m | 12.20.2 | 4.80.5 | 1, 2 | |
| UKS1424-460 | 14:28:03 | -46:18:06 | IB(s)m | 16.50.1 | 3.60.4 | 1, 2 | |
| CenA-dE5 | 14:30:05 | -33:28:45 | dE | 18.40.1 | 5 | ||
| ESO222-G010 | 14:35:02 | -49:25:14 | dIrr | 16.30.1 | 2 | ||
| ESO272-G025 | 14:43:25 | -44:42:18 | dE/dIrr | 14.80.1 | 7 | ||
| ESO223-G009 | 15:01:08 | -48:17:25 | IAB(s)m | 14.80.1 | 6.40.5 | 2, 3 | |
| ESO274-G001 | 15:14:13 | -46:48:33 | Sd | 12.00.2 | 3.10.3 | 2, 3 |
-
•
Note — Galaxies with the symbol preceding there name, are objects that were observed in this study. Units of right ascension are hours, minutes, and seconds, and units of declination are degrees, arcminutes, and arcseconds (J2000.0).
- •
| Galaxy | RA | Dec | Type | Ref. | |||
|---|---|---|---|---|---|---|---|
| (J2000) | (J2000) | (Mpc) | (km s-1) | ||||
| WHIB2317-32 | 23:20:37 | -31:54:21 | dIrr | 180.1 | 1, 2 | ||
| UGCA438 | 23:26:27 | -32:23:26 | IB(s)m pec: | 13.90.1 | 2.20.2 | 1, 3 | |
| ESO347-G017 | 23:26:57 | -37:20:47 | SB(s)m:sp | 14.70.1 | 7.00.4 | 4, 5 | |
| UGCA442 | 23:43:46 | -31:57:24 | SB(s)m: sp | 13.60.1 | 4.30.5 | 1, 5 | |
| ESO348-G009 | 23:49:23 | -37:46:19 | IBm | 13.60.1 | 6.50.4 | 4, 5 | |
| NGC7793 | 23:57:50 | -32:35:28 | SA(s)d | 9.720.09 | 3.90.4 | 1, 5 | |
| [CFC97]SC18 | 00:00:56 | -41:08:53 | dIrr | 17.50.1 | 2.10.2 | 1, 2, 4 | |
| ESO349-G031 | 00:08:13 | -34:34:42 | IBm | 15.50.1 | 3.20.3 | 1, 2, 6 | |
| NGC24 | 00:09:57 | -24:57:47 | SA(s)c | 12.40.1 | 5, 7 | ||
| NGC45 | 00:14:04 | -23:10:55 | SA(s)dm | 11.50.1 | 5, 7 | ||
| NGC55 | 00:14:54 | -39:11:48 | SB(s)m:sp | 8.80.1 | 1.90.1 | 8, 5 | |
| NGC59 | 00:15:25 | -21:26:38 | dS0 | 12.970.03 | 4.40.4 | 2, 9, 10 | |
| ESO410-G005 | 00:15:31 | -32:10:55 | dE/Im | 14.80.1 | 1.90.2 | 1, 11 | |
| Scl-dE1 | 00:23:51 | -24:42:18 | dE | 17.70.2 | 4.20.4 | 1, 9 | |
| ESO294-G010 | 00:26:33 | -41:51:19 | dS0/Im | 15.530.04 | 1.710.07 | 9, 10, 11 | |
| ESO473-G024 | 00:31:23 | -22:45:58 | Im | 16.00.1 | 5.90.4 | 4, 5 | |
| [CFC97]SC24 | 00:36:39 | -32:34:25 | dIrr | 18.00.1 | 1.70.2 | 1, 2, 4 | |
| IC1574 | 00:43:04 | -22:14:49 | IB(s)m | 14.40.1 | 4.90.6 | 1, 5 | |
| NGC247 | 00:47:09 | -20:45:37 | SAB(s)d | 9.90.1 | 3.70.4 | 1, 5, 6 | |
| NGC253 | 00:47:33 | -25:17:18 | SAB(s)c | 7.90.1 | 3.90.4 | 1, 5 | |
| ESO540-G030 | 00:49:21 | -18:04:34 | dE/Im | 16.370.07 | 3.20.1 | 9, 10, 11 | |
| DDO6 | 00:49:49 | -21:00:54 | IB(s)m: | 15.20.1 | 3.30.2 | 1, 5 | |
| ESO540-G032 | 00:50:25 | -19:54:23 | dE/Im | 16.440.08 | 3.70.2 | 12, 11 | |
| NGC300 | 00:54:54 | -37:41:04 | SA(s)d | 9.00.1 | 2.20.2 | 1, 5 | |
| AM0106-382 | 01:08:22 | -38:12:33 | dIm | 16.30.1 | 6.10.4 | 2, 4 | |
| NGC625 | 01:35:06 | -41:26:05 | SB(s)m?sp | 11.60.1 | 4.10.4 | 1, 5 | |
| ESO245-G005 | 01:45:04 | -43:35:53 | IB(s)m | 12.70.1 | 4.40.5 | 1, 5 |
-
•
Note — Galaxies with the symbol preceding there name, are objects that were observed in this study. Units of right ascension are hours, minutes, and seconds, and units of declination are degrees, arcminutes, and arcseconds (J2000.0).
-
•
References — (1) Karachentsev et al. (2004); (2) Côté et al. (1997); (3) Karachentsev et al. (2002); (4) Skillman et al. (2003); (5) Koribalski et al. (2004); (6) Karachentsev et al. (2006); (7) de Vaucouleurs et al. (1991); (8) Pietrzyński et al. (2006); (9) Jerjen et al. (2000a); (10) Jerjen et al. (1998); (11) Bouchard et al. (2005); (12) Da Costa et al. (2007)
2.4 H observations
The H line emission was imaged using the Australian National University 2.3 m Telescope at the Siding Spring Observatory. The Nasmyth Imager, equipped with the SITe 10241024 thinned CCD, has a circular field of view of 66 in diameter and pixel size of 059. For the Scl galaxies, three exposures of 900 seconds were taken with a narrowband 7 nm wide “on-band” filter centered on a wavelength of 657.5 nm, encompassing the H rest frequency of 656.3 nm. Three 300 seconds exposures of the same field, using an 8 nm wide H “off-band” filter centered on 645 nm, were used to estimate the H continuum. For the galaxies in CenA, bad weather conditions permitted only one 900 seconds on-band and one 300 seconds off-band exposure per galaxy. Additionally, several Planetary Nebulæ (PNs) from the list by Dopita & Hua (1997) were observed for flux calibration purposes.
After subtraction of the bias, flat fielding, removal of the sky background and combination of the multiple images to increase the signal-to-noise ratio (where multiple images were available), the intensity of the off-band images were scaled to match that of their counterpart on-band images by comparing the intensities of foreground stars. This normalisation removed the effects caused by the differences in the bandpass of each filter as well as the different integration times. The off-band images were then subtracted from the on-band, thus leaving only the line emission in the resulting frames.
The H line total flux, i. e., the sum of the flux value of each pixel where a significant amount of emission is detected, was compared with the data from the PNs. In practice, the sum is done on all pixels situated inside the 3 contour level, where is taken to be the standard deviation of the noise distribution in a sky region of final image. This value includes all noise sources such as readout and photon noise. The flux was corrected to take into account the difference in transmission caused by the varying redshifts at which the H line is observed and the shape of the bandpass of the on-band H filter. When the redshift of the target galaxy was unknown, the H transmission was assumed to be the most common value for other galaxies of the same group.
2.5 H results
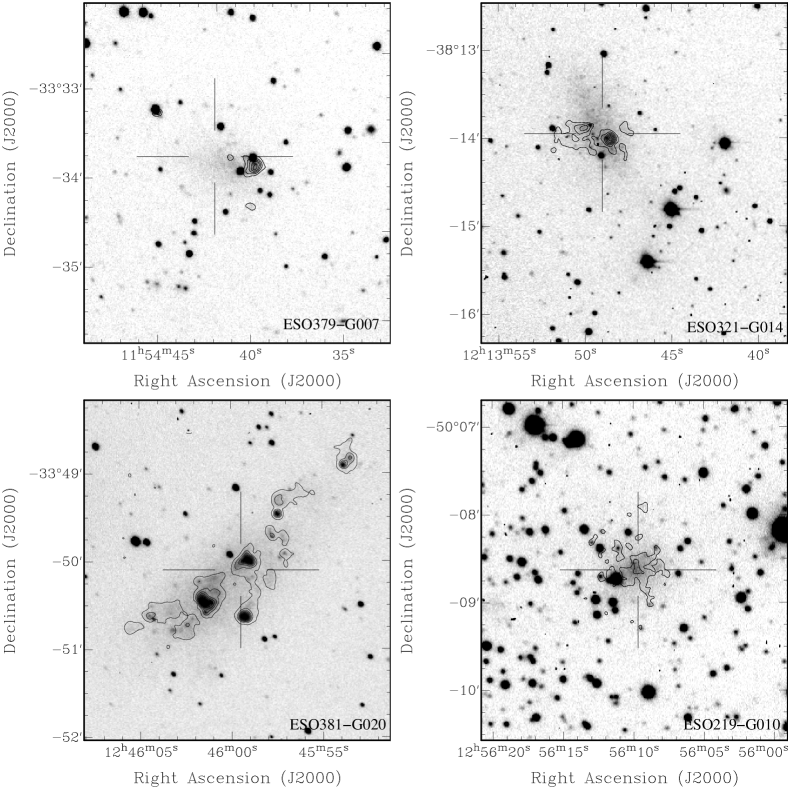
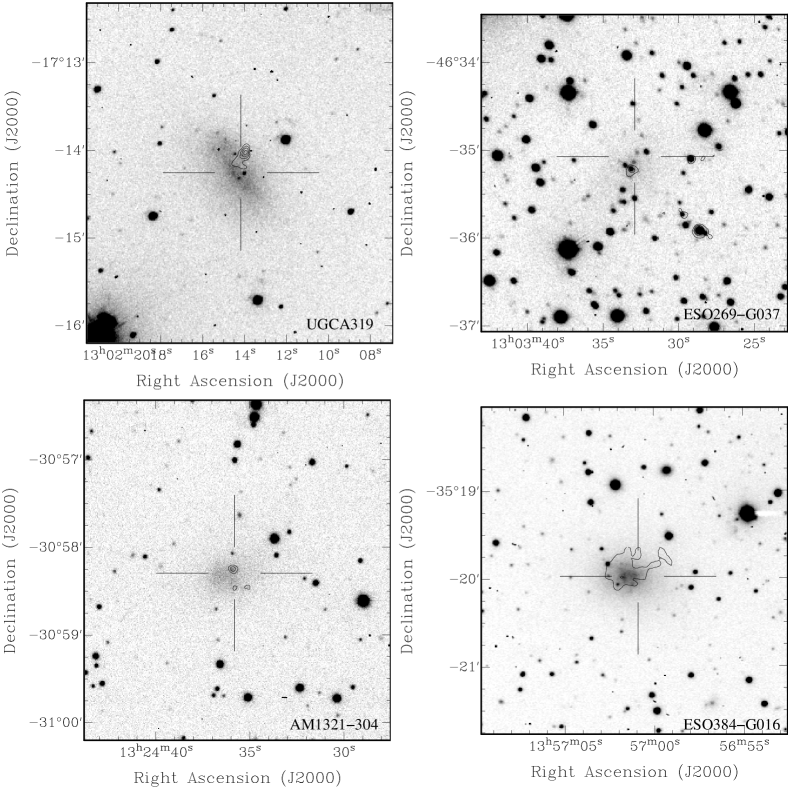
Figure 2 shows the location of the H line emission in the dIrr ESO379-G007, the IBm ESO321-G014, the IB(s)m ESO381-G020 and the dE,N ESO219-G010. Similarly, Figure 3 shows the H line emission in the IABm ESO269-G037, the dIm AM1321-304, the dS0/Im ESO384-G016 and the IB(s)m UGCA319. All eight galaxies are members of CenA. The galaxies of Scl are presented in Figure 4, for the IBm ESO349-G031, the dS0/Im ESO294-G010, the IB(s)m DDO6 and the dE/Im ESO540-G032 while the dIm galaxy AM0106-382 is in Figure 5.
The total integrated H line flux for these objects are found in Table 3. The table also lists several non-detections where an upper-limit on the H flux is listed. This limit is taken to be approximately 3 times the typical noise over an area of 100 pixels square or .

| Galaxy | H line flux |
|---|---|
| (10-15 erg s-1 cm-2) | |
| CenA group | |
| ESO379-G007 | 7.31.9 |
| ESO321-G014 | 6718 |
| ESO381-G020 | 22861 |
| ESO219-G010 | 27.37.8† |
| UGCA319 | 7.21.9 |
| ESO269-G037 | 3.20.9† |
| CenA-dE1 | |
| ESO269-G066 | |
| HIPASS1321-31 | |
| CenA-dE2 | |
| SGC1319.1-4216 | |
| [CFC97]Cen8 | |
| AM1320-230 | |
| AM1321-304 | 2.20.6 |
| [KK98]208 | |
| AM1339-445 | |
| LEDA166172 | |
| CenA-dE3 | |
| CenA-dE4 | |
| ESO384-G016 | 13.63.7 |
| CenA-dE5 | |
| Scl group | |
| WHIB2317-32 | |
| ESO349-G031 | 5.91.6 |
| ESO410-G005 | |
| Scl-dE1 | |
| ESO294-G010 | 13.33.6 |
| ESO540-G030 | |
| DDO 6 | 6.21.7 |
| ESO540-G032 | 0.80.3 |
| AM0106-382 | 7119 |
-
•
Note — The values marked with † may be false detections, see text for details.
2.6 Comments on individual objects of the CenA group
2.6.1 ESO379-G007
An Hii region in this dIrr galaxy is situated ″ (or 250 pc projected distance at Mpc) west of the optical center and is slightly extended. Concordantly, the colour-magnitude diagram (CMD) for this object also reveals some young main sequence stars (Karachentsev et al., 2002). The arc-shape of the H emission and its position with respect to the optical center may suggest that ram pressure is operating. This however seems unlikely as this galaxy is one of the most isolated objects of the CenA group, situated at Mpc (3D distance) from NGC5236 ( Mpc from NGC5102).
2.6.2 ESO321-G014
This IABm galaxy has an Hii point source that is displaced from the center of the galaxy by about 15″ or 230 pc projected distance, at Mpc. It is accompanied by low level diffuse emission that extends along the minor axis of the galaxy. The CMD shows young main sequence and some upper-AGB stars — signature of the presence of an intermediate age population, i. e., 1 Gyr and older — are found (Karachentsev et al., 2002). This galaxy is a fairly isolated object of the CenA group, situated at kpc (3D) from NGC5102.
2.6.3 ESO381-G020
This dwarf clearly contains both upper-AGB and young main sequence stars (Karachentsev et al., 2007). It has several H point sources and a considerable amount of diffuse emission. As for the two preceding galaxies, it is a relatively isolated object at kpc (3D) from NGC5236 ( Mpc from NGC5102).
2.6.4 ESO219-G010
This galaxy seems to have faint diffuse Hii emission that is not accompanied by any point source. However, previous investigations failed to detect Hi for this object (Beaulieu et al., 2006; Bouchard et al., 2007). The upper-limits, and are very low and the Hi properties are consistent with that of other early-type dwarfs. The H detection could be interpreted as a spurious detection. Careful inspection of the H, off band and residual images reveal no signs of an under-subtracted continuum but different seeing conditions in the off-band and on-band images is likely to have altered our capacity of making a good continuum estimate. No CMD is available for this galaxy to help resolve this issue, additional data is required to confirm this detection. It is situated at Mpc (3D) from NGC4945.
2.6.5 UGCA319
This IB(s)m galaxy contains an H point source ″ or 320 pc projected distance (at Mpc) north of its center with some extended emission. No CMD information is available for this isolated dwarf, situated at a distance of Mpc (3D) from NGC5236.
2.6.6 ESO269-G037
Because of stellar crowding in the field of this galaxy it is hard to tell if the CMD shows young main sequence and upper-AGB stars or if these are the results of contamination. Karachentsev et al. (2002) classifies this galaxy as a dSph.
This object was detected in Hi and contains in a cloud extending south-east of the optical centre. It is the only object of the CenA group where an Hi mass below 107 was detected and it is believed to be presently losing its Hi through ram pressure stripping (Bouchard et al., 2007).
We have found some H emission coinciding with the optical centre of the dwarf, which is also a high density Hi region. There is also H emission in two regions to the West and South-West of the optical center, surrounding foreground stars.
After close inspection of the H image, it seems that the different seeing conditions for the on-band and the off-band images have created artifacts around some foreground stars. The emission structure of the West and South-West features are indeed reminiscent of subtraction difficulties. We can not rule out this possibility for the central feature. In this case, however, the emission is slightly extended (FWHM compared to the FWHM seeing) and does not show signs of an unsuccessful sky subtraction (e. g., a flux depression at the location of the point source). We consider this central emission as real but confirmation should be sought.
ESO269-G037 is situated at kpc (3D) from NGC4945.
2.6.7 AM1321-304
The CMD for this dIm seems to reveal some hints of main sequence and upper-AGB stars (Karachentsev et al., 2002) consistent with the small Hii point source near the center of the dwarf. This galaxy is situated at kpc (3D) from NGC5236.
2.6.8 ESO384-G016
2.7 Comments on individual objects of the Scl group
2.7.1 ESO349-G031
Only two H point sources, one centered on the galaxy and one at ″ or 390 pc projected distance (at Mpc) to the south-east are detected. The CMD also has clear upper-AGB and main sequence population (Karachentsev et al., 2006). This IBm galaxy is situated kpc (3D) from NGC300.
2.7.2 ESO294-G010
Existing spectroscopic data for this object showed clear detections of the H (656.3 nm) and [O iii] (500.7 nm) lines but the signal to noise ratio did not allow the detection of the second [O iii] (495.9 nm) line (see Jerjen et al., 1998, Figure 5). These lines reportedly originate from a feature 18″ or 150 kpc projected distance (at Mpc) south of the center of the galaxy. This is in disagreement with the present results which show H emission ″ or 60 kpc north of the center, more or less coincident with the detected Hi emission (Bouchard et al., 2005). Careful inspection of our residual H image shows no sign of emission on the southern side. This dS0/Im galaxy is situated kpc (3D) from NGC55 and kpc from NGC300.
2.7.3 DDO6
2.7.4 ESO540-G032
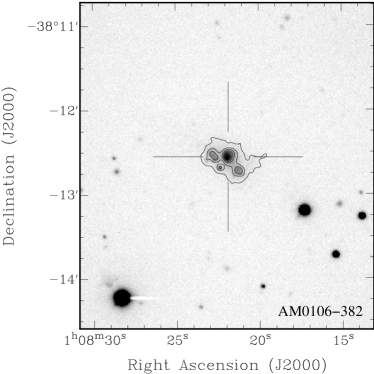
2.7.5 AM0106-382
This isolated galaxy is Mpc (3D) from NGC7793. It has strong H emission concentrated around four point sources. This dIm galaxy was not detected by Côté et al. (1997) who placed an upper-limit of (corrected to a distance of 6.1 Mpc). However, the HIPASS survey (Barnes et al., 2001) reveals a faint Hi feature at km s-1 corresponding to (if at 6.1 Mpc)222We use (c.f., Bouchard et al., 2005)..
3 The influence of environment on evolution of dwarf galaxies
It is a well established fact that the fraction of galaxies sustaining current star formation decreases towards the projected center of dense galaxy clusters and this influence can be seen to several virial radii (Ellingson et al., 2001; Lewis et al., 2002; Gómez et al., 2003; Balogh et al., 2004; Rines et al., 2005). Similarly, the morphology-density relation is evident in the Local Group with the majority of the late-type dwarfs occurring in relatively isolated locations while the early-type dwarfs are concentrated mainly in the vicinity of the two large spirals, the Milky Way and M31. Apart from this qualitative morphology-density relation, there has otherwise been virtually no attempt to quantify this relation using local volume galaxies.
3.1 Physical properties of dwarfs: Quantifying the evolution
Based on the values presented in Table 3, we can derive the current star formation rate (SFR) for each galaxy. Here, we follow the discussion by Skillman et al. (2003), which, in turn, was based on Kennicutt et al. (1994):
| (1) |
where SFR is in yr-1 and (H), in erg s-1, is given by:
| (2) |
where is the line of sight distance, in centimeters and the H flux, , is in erg s-1 cm-2.
Because SFR is known to correlate with the Hi mass, , and blue luminosity, , one should be careful when interpreting these parameters. We can, however, define a new set of independent parameters by taking the ratios of these quantities. These are the galaxy formation timescale , the gas depletion timescale and Hi mass to light ratio .
Here,
| (3) |
where is the total stellar mass in solar units . However, cannot be directly determined. It is usually inferred from the observable B band luminosity, , in solar units and the stellar mass to light ratio , which is a model dependent quantity. To avoid making any assumptions on this last parameter, we will use
| (4) |
In this context, is the amount of time, in years, that it would have taken to form the currently observed galaxy if it always had the current SFR and a stellar mass to light ratio of 1. We should bear in mind that any variations seen in can be due to variations in either of or . For this last parameter, values between 0.1 and 5 are typical for dwarf galaxies (Worthey, 1994).
Similarly,
| (5) |
is the time, in years, before all the remaining Hi gas will be exhausted if the galaxy retains the current SFR. We emphasise that both timescales are instantaneous parameters and by no means represent any past average values.
| Galaxy | log() | log (H) | SFR | log() | log() | Ref. | |||
|---|---|---|---|---|---|---|---|---|---|
| ( Mpc-3) | (erg s-1) | ( yr-1) | (106 ) | (10) | (yr) | (yr) | (/) | ||
| ESO379-G007 | 9.60.1 | 37.40.1 | 196 | 336 | 9.90.8 | 10.70.2 | 11.30.2 | 3.40.8 | 1 |
| ESO321-G014 | 10.00.2 | 37.90.1 | 6520 | 153 | 13.31.1 | 10.30.2 | 10.40.2 | 1.20.3 | 1 |
| ESO381-G018 | 10.10.1 | 232 | |||||||
| ESO381-G020 | 10.10.3 | 38.90.1 | 600200 | 2230 | 958 | 10.20.2 | 10.50.1 | 2.40.4 | 2 |
| ESO443-G009 | 10.00.5 | 7.90.7 | |||||||
| ESO219-G010 | 9.70.2 | 37.90.1 | 6020 | 0.7 | 9.81.5 | 10.20.2 | 9.1 | 0.03 | 5 |
| UGCA319 | 9.60.3 | 37.20.2 | 13.56.0 | 249 | 232 | 11.20.3 | 11.30.3 | 1.10.6 | 2 |
| DDO161 | 9.60.3 | 37.400.15 | 19.87.0 | 430160 | 949 | 11.70.3 | 12.30.2 | 4.52.3 | 2, 4 |
| ESO269-G037 | 10.90.3 | 36.70.1 | 3.71.2 | 0.40.1 | 5.90.5 | 11.20.2 | 10.00.2 | 0.070.02 | 5 |
| [CFC97]Cen6 | 9.60.2 | 425 | 15.61.4 | 2.70.50 | 5 | ||||
| NGC4945 | 10.60.1 | 1100200 | 4500900 | 0.240.07 | 1 | ||||
| ESO269-G058 | 11.50.1 | 11010 | |||||||
| CenA-dE1 | 10.70.4 | 35.7 | 0.4 | 0.2 | 2.20.2 | 0.07 | 5 | ||
| ESO269-G066 | 11.10.5 | 35.7 | 0.4 | 0.1 | 383 | 0.003 | 5 | ||
| HIPASSJ1321-31 | 11.60.2 | 35.9 | 0.6 | 385 | 6.20.6 | 12.0 | 12.8 | 61 | 1 |
| CenA-dE2 | 10.30.3 | 35.7 | 0.5 | 0.6 | 1.70.3 | 0.3 | 5 | ||
| [KK98]196 | 11.40.6 | 8.80.8 | |||||||
| NGC5102 | 10.60.3 | 38.850.08 | 570110 | 22040 | 1880240 | 11.50.1 | 10.60.1 | 0.120.03 | 1, 6 |
| SGC1319.1-4216 | 12.51.2 | 35.7 | 0.4 | 0.3 | 132 | 0.02 | 5 | ||
| [KK2000]55 | 11.90.9 | 1.00.1 | |||||||
| [CFC97]Cen8 | 10.30.3 | 35.8 | 0.5 | 0.6 | 2.70.2 | 0.2 | 5 | ||
| AM1320-230 | 9.90.4 | 35.8 | 0.5 | 0.5 | 3.00.2 | 0.2 | 5 | ||
| AM1321-304 | 10.70.4 | 36.80.2 | 4.51.4 | 2010 | 7.30.7 | 11.20.2 | 11.60.5 | 32 | 7 |
| NGC5128 | 10.70.3 | 31050 | 165001400 | 0.0180.005 | 1 | ||||
| IC4247 | 11.61.3 | 3725 | 676 | 0.50.4 | 7 | ||||
| ESO324-G024 | 12.40.7 | 36.90.1 | 7.11.6 | 20030 | 15112 | 12.30.1 | 12.40.1 | 1.30.3 | 1, 4 |
| NGC5206 | 10.80.3 | 5.4 | 43040 | 0.01 | 2 | ||||
| ESO270-G017 | 10.30.4 | 920340 | 65050 | 1.40.7 | 1 | ||||
| UGCA365 | 13.00.6 | 182 | 272 | 0.660.12 | 1 | ||||
| [KK98]208 | 10.90.4 | 35.8 | 0.5 | 2.1 | 666 | 0.03 | 5 | ||
| NGC5236 | 10.20.4 | 42.230.08 | 1360000200000 | 102001500 | 217001800 | 9.20.1 | 8.880.09 | 0.50.1 | 1, 8 |
| DEEPJ1337-33 | 10.40.3 | 3.90.4 | |||||||
| ESO444-G084 | 10.70.3 | 35.920.09 | 0.70.1 | 14030 | 333 | 12.70.1 | 13.30.1 | 41 | 2, 4 |
| HIPASSJ1337-39 | 10.10.1 | 9.60.9 | |||||||
| NGC5237 | 10.90.5 | 213 | 918 | 0.230.04 | 2 | ||||
| NGC5253 | 10.40.1 | 40.130.08 | 221002500 | 14020 | 72060 | 9.510.09 | 8.800.08 | 0.190.04 | 1, 8 |
| IC4316 | 10.60.3 | 366.0 | 326 | 1.10.3 | 2 | ||||
| NGC5264 | 10.50.3 | 36.600.07 | 3.20.5 | 8020 | 29741 | 13.00.1 | 12.40.1 | 0.280.08 | 2, 4 |
| [KK2000]57 | 11.40.7 | 1.40.1 | |||||||
| AM1339-445 | 11.50.1 | 35.6 | 0.3 | 1.2 | 6.60.6 | 0.2 | 3 | ||
| LEDA166172 | 11.40.5 | 35.6 | 0.3 | 1.3 | 0.80.1 | 1.5 | 7 | ||
| ESO325-G011 | 10.80.5 | 11020 | 454 | 2.40.7 | 2 | ||||
| CenA-dE3 | 10.20.3 | 35.8 | 0.5 | 0.5 | 3.30.5 | 0.2 | 5 | ||
| AM1343-452 | 11.00.6 | 0.2 | 2.30.2 | 0.06 | 5 | ||||
| CenA-dE4 | 10.71.4 | 35.8 | 0.5 | 0.2 | 2.80.4 | 0.06 | 5 | ||
| CenN | 10.90.2 | 2.11.3 | |||||||
| HIPASSJ1348-37 | 9.80.3 | 9.10.8 | |||||||
| LEDA166179 | 10.80.3 | 1.5 | 1.60.1 | 1 | 7 | ||||
| ESO383-G087 | 10.80.2 | 37.500.05 | 25.03.0 | 10416 | 75060 | 12.480.09 | 11.620.08 | 0.140.03 | 2, 4 |
| HIPASSJ1351-47 | 8.70.1 | 5.10.5 | |||||||
| ESO384-G016 | 10.20.2 | 37.50.1 | 236 | 4.40.8 | 25.61.4 | 11.00.1 | 10.30.1 | 0.170.03 | 5 |
| NGC5408 | 9.90.2 | 32050 | 48090 | 0.70.2 | 2 | ||||
| UKS1424-460 | 10.10.1 | 5020 | 5.00.5 | 104 | 2 | ||||
| CenA-dE5 | 10.00.3 | 35.8 | 0.5 | 0.4 | 1.30.2 | 0.3 | 5 | ||
| ESO222-G010 | 9.60.3 | 4215 | 9.00.8 | 4.62.4 | 2 | ||||
| ESO272-G025 | 9.70.3 | 73 | 373 | 0.20.1 | 5 | ||||
| ESO223-G009 | 8.80.1 | 880110 | 787 | 112 | 2 | ||||
| ESO274-G001 | 9.60.1 | 33050 | 23050 | 1.40.4 | 2 |
| Galaxy | log() | log (H) | SFR | log() | log() | Ref. | |||
|---|---|---|---|---|---|---|---|---|---|
| ( Mpc-3) | (erg s-1) | ( yr-1) | (106 ) | (10) | (yr) | (yr) | (/) | ||
| WHIB2317-32 | 10.30.4 | 35.4 | 0.2 | 3321 | 1.40.1 | 11.8 | 13.2 | 2421 | 1 |
| UGCA438 | 10.00.1 | 22.52 | |||||||
| ESO347-G017 | 8.80.2 | 38.890.08 | 610110 | 12020 | 10310 | 10.20.1 | 10.30.1 | 1.20.3 | 1, 2 |
| UGCA442 | 10.30.3 | 37.140.08 | 11.02.0 | 23040 | 10510 | 12.00.1 | 12.30.1 | 2.20.6 | 1, 3 |
| ESO348-G009 | 8.80.1 | 37.540.09 | 285 | 8413 | 24020 | 12.00.1 | 11.50.1 | 0.340.08 | 1, 2 |
| NGC7793 | 10.20.1 | 38.60.1 | 1.50.2 | 1000200 | 3100300 | 14.30.1 | 13.80.1 | 0.320.08 | 4, 5 |
| [CFC97]SC18 | 10.60.2 | 36.460.07 | 2.30.4 | 5.01.0 | 0.90.1 | 10.60.1 | 11.30.1 | 5.71.5 | 1, 2 |
| ESO349-G031 | 9.80.2 | 36.70.1 | 3.81.2 | 4.41.2 | 7.00.6 | 11.30.2 | 11.10.2 | 0.60.2 | 1 |
| NGC24 | 8.90.3 | 39.30.3 | 18001100 | 59050 | 82080 | 10.10.5 | 10.50.3 | 0.70.2 | 4, 6 |
| NGC45 | 9.30.2 | 1520200 | 1320120 | 1.20.3 | 4 | ||||
| NGC55 | 10.20.3 | 40.440.06 | 218003000 | 1500300 | 1670150 | 9.80.1 | 9.80.1 | 1.00.2 | 4, 8 |
| NGC59 | 10.60.3 | 38.570.09 | 30060 | 174 | 1986 | 10.80.1 | 9.80.1 | 0.080.02 | 2, 9 |
| ESO410-G005 | 10.60.1 | 34.8 | 0.1 | 0.70.1 | 6.80.6 | 13.1 | 12.1 | 0.110.02 | 10 |
| Scl-dE1 | 11.10.5 | 35.5 | 0.3 | 0.19 | 2.30.4 | 0.08 | 10 | ||
| ESO294-G010 | 10.70.2 | 36.70.1 | 3.71.0 | 0.300.03 | 2.80.1 | 10.90.1 | 9.80.1 | 0.080.01 | 10 |
| ESO473-G024 | 10.70.5 | 38.200.08 | 12622 | 6410 | 232 | 10.30.1 | 10.70.1 | 2.80.7 | 1, 2 |
| [CFC97]SC24 | 10.30.2 | 35.420.08 | 0.20.05 | 7.71.2 | 0.30.1 | 11.10.1 | 12.60.1 | 276 | 1, 2 |
| IC1574 | 9.80.3 | 38.30.1 | 16035 | 428 | 706 | 10.60.2 | 10.40.1 | 0.60.2 | 1, 11 |
| NGC247 | 11.00.4 | 2400400 | 3000300 | 0.80.2 | 4 | ||||
| NGC253 | 10.30.3 | 2500400 | 167001500 | 0.150.04 | 4 | ||||
| ESO540-G030 | 9.90.3 | 35.3 | 0.1 | 0.80.1 | 4.60.3 | 12.5 | 11.7 | 0.170.02 | 10 |
| DDO6 | 10.20.4 | 36.90.1 | 6.61.9 | 11.82.0 | 14.81.4 | 11.40.2 | 11.30.2 | 0.80.2 | 1 |
| ESO540-G032 | 10.80.3 | 36.00.2 | 0.80.3 | 0.90.1 | 5.80.4 | 11.80.2 | 11.10.2 | 0.190.03 | 10 |
| NGC300 | 10.10.4 | 2200400 | 1900200 | 1.10.3 | 4 | ||||
| AM0106-382 | 8.80.3 | 38.50.1 | 25080 | 306 | 192 | 9.90.2 | 10.10.2 | 1.60.4 | 1 |
| NGC625 | 9.60.1 | 39.780.07 | 4800750 | 11817 | 57050 | 10.10.1 | 9.40.1 | 0.210.05 | 1, 2 |
| ESO245-G005 | 9.40.2 | 39.060.08 | 920160 | 40060 | 26020 | 10.50.1 | 10.60.1 | 1.60.4 | 1, 12 |
-
•
References — (1) Côté et al. (1997); (2) Skillman et al. (2003); (3) Lee et al. (2003); (4) Koribalski et al. (2004); (5) Buat et al. (2002); (6) Romanishin (1990); (7) Chemin et al. (2006); (8) Miller & Veilleux (2003); (9) Beaulieu et al. (2006); (10) Bouchard et al. (2005); (11) van Zee (2000); (12) Miller (1996); References for can be found in Table 2.
3.2 Luminosity density: Quantifying the environment
Environment is a difficult concept to quantify and the methods used to describe it vary greatly. In distant clusters most authors use either projected distance from the cluster center or the local surface number density (e. g., Rines et al., 2005). The first assumes a spherically symmetric distribution. The second assumes that the influence from each galaxy is strictly the same and, to minimize the impact of this assumption, authors generally apply a cutoff by only considering bright galaxies.
In the present study, we can not afford making either of these assumptions. There are two main reasons: first, these groups are not symmetric (see Jerjen et al., 1998). Second, there is only a handful of large galaxies in the groups and discarding dwarfs from the sample would result in considering only one or two objects per group. Fortunately, independent radial distances measurements are available for most galaxies in the local volume (see references in Tables 1 and 2). Using this information, we can estimate the 3D local galaxy density within the groups. Since our aim is to compare galaxies from very different environments, it is important to define a parameter that is truly representative of the local surroundings of each studied galaxy.
The local luminosity density (in ) at the position of galaxy as a function of the B band luminosity (, in ) and 3D distance (, in Mpc) is defined by:
| (6) |
where the sum goes over all neighbour galaxies . This quantity accurately and systematically describes the environment of each galaxy in the groups. Here, is simply defined as the spatial separation of galaxies and :
| (7) |
with being the angular separation between a pair of galaxies. Unfortunately, not all values of can be calculated because not all radial distances have been measured. In these cases, we adopted Mpc for galaxies of the CenA group and Mpc for galaxies of the Scl group. These correspond to the mean distance to all galaxies in the groups with known distances and an interval which encompasses of those distances.
The value of varies by some 5 orders of magnitudes. It ranges from 10L for the most isolated objects in the groups, such as the Scl dwarf ESO348-G009, and goes up to 10L for NGC5264, which is at roughly 75 kpc (true distance) from NGC5236 (M83, ). As such, we are not probing any regime of extremely high densities. For comparison, the Sagittarius dwarf is at kpc (Monaco et al., 2004) from the Milky Way (), which gives and the Small Magellanic Cloud, at kpc, has . Moreover, the clusters studied by Rines et al. (2005) showed cases where galaxy surface number densities reached well above 100 Mpc-2 by only considering galaxies with . This is roughly equivalent to having the closest neighbour at 100 kpc projected distance and would correspond to . The present work is therefore extending previous studies to regimes of lower densities that have not been tested before.

Figure 6 presents a comparison between and the 3D distance to the nearest galaxy. Within our target galaxy groups, the environment of objects situated less than 350 kpc from a bright massive object (L) is equally well describe by either the 3D distance to that galaxy or by . In these cases, the bright galaxy clearly dominates and the contribution from the rest of the group is negligible. However, for objects further than 350 kpc there may be significant discrepancies between and the 3D distance to the nearest galaxy. This is particularly true for Sculptor galaxies where no clearly dominant object may be defined as the group center and where the nearest massive galaxy may be situated in another group, a situation we have not considered. Presumably, this effect may become more important as we try to include galaxies from even lower density environment.
Strictly speaking, these values of are lower limits because we have an incomplete list of group members. The missing galaxies, those that are yet to be discovered, will, however, be of low luminosity and therefore have minimal impact on .
3.3 Physical properties as a function of environment
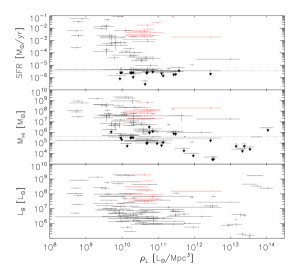

The values of SFR, and are plotted against in Figure 7. The same is done for , and in Figure 8. The figures include data from the CenA and Scl group (Tables 4 and 5) and, to increase the significance of the results, from the Local Group (Mateo, 1998, and references therein).
The dotted horizontal lines in the first 2 panels of Figure 7 represent the typical detection limit for SFR and . On average, the lowest detectable H flux in our sample is ergs s-1 cm-2 (Table 3) and the average distance of these galaxies is 4.13 Mpc (Tables 1 and 2). This means that the typical detection limit is SFR yr-1. The limit for Hi flux is considered to be 100 mJy km s-1 (Bouchard et al., 2005, 2007), which brings the typical Hi mass detection limit to .
These figures show a very large scatter in the data points and no directly obvious correlation can be seen. We recognise that this scatter is largely due to intrinsic variations from source to source and that the factors are not solely a function of environment. It is also important to say that is a static description of the present environment and contains no historical information on its evolution. Nevertheless, this is the best that can be done short of a full orbit reconstruction for each objects in the groups (e. g., Peebles, 1990). Yet, however uncertain this environmental parameter may be, if the quantities in Figures 7 or 8 have any dependence, then some level of correlation is expected.
| Excl. ND | Incl. ND | ‘Genuine’ ND | ||||
| () | () | () | ||||
| SFR | (0.075) | (0.0003) | (0.001) | |||
| (0.002) | () | () | ||||
| (0.01) | ||||||
| (0.03) | (0.0002) | () | ||||
| (0.31) | (0.05) | (0.14) | ||||
| (0.04) | () | () | ||||
To investigate this possibility, we have used a Spearman Rank correlation test. This assesses whether a monotonic function could accurately describe the data without making any assumptions on what the exact relation might be. A correlation coefficient () with a value approaching means that there is a strong correlation (or anti-correlation) between the two given quantities, while implies that the quantities are independent. The results of these correlation measurements can be found in Table 6, along with the probability that this corresponds to the null hypothesis (no correlation) using a random permutation test. In order to determine the effects of the non-detections on , the analysis was done in three different ways: Firstly by ignoring any non-detections (col. 1 of Table 6), secondly by including the non-detections at the value of their detection limit (col. 2) and thirdly by considering them as genuine non-detections (SFR = 0 yr-1 or , col. 3).
As the detection limits are not spread evenly in but are slightly shifted to the right hand side of the plots, the correlations are all significantly better when these limits are included in the correlation measurements. Since is known for each system, the distinction between the various methods is irrelevant for this quantity.
Regardless of the method used to handle detection limits, our data show that there are strong levels of correlation between and SFR, , and : the low corresponding values rule out any possibility of random occurrence. For SFR, the correlation significance may seem weak () when detection limits are not considered but the value substantially decreases when these limits are included. Only for does the data not indicate any significant correlation.
Although highly significant, the values of remain on the low side () and do not approach 1. This is caused by the scatter in the data and may be a quantitative way of saying that other, probably source-specific parameters (i. e., not linked to environment) have not been considered.
On a more specific note, the dependance of SFR and on ( and respectively) are coherent with previous findings: galaxies in high density regions harbour less current star formation (Rines et al., 2005) and less Hi (Gavazzi et al., 2006) than their lower density counterparts. This is also consistent with the morphology-density relation, where early-type dwarfs are more concentrated near larger members of groups than late-type dwarfs. Indeed, early-types are known to have low current star formation, low Hi mass and overall old stellar population. Finally, the anti-correlation of and () indicates a slight tendency of having brighter objects in the outskirts of the groups. Assuming that this is not simply driven by a selection effect — given the area of sky to be surveyed brighter galaxies are easier to find in group outskirts — we note that, for a given baryonic mass, galaxies with a dominant young stellar population have higher values of than older ones, because young stars contribute strongly to . Therefore, knowing that galaxies with higher star formation rates tend to be in the outskirts of groups, the dependance of on should not blindly be interpreted as a variation of baryonic mass with density. Ideally, such a relation should be measured using the near infrared (e. g., H band), as is a much better tracer of stellar mass than (Kirby et al., 2008). In a more general context, these results are consistent with other recent evidence that early-type giant galaxies in high density environments are both older (Thomas et al., 2005; Clemens et al., 2006) and fainter (Bernardi et al., 2006) than their field counterparts. Overall, this is at odds with CDM hierarchical merger simulations which predicted an increase of dark matter halo masses (and presumably baryonic luminosity) with increasing density (Lemson & Kauffmann, 1999; Maulbetsch et al., 2007).
From the lower panel of Figure 8, we see that galaxies at low values of have higher gas mass fraction then the ones with higher . There are three possible explanations for this. First, the gas may have been stripped from the dwarfs by various mechanisms. Such stripping process are likely to be more prevalent at high . Second, the fraction of gas that is ionised may be greater for galaxies in the central regions of groups as the ambient ionising flux level might be higher. Finally, the gas may have been used up more efficiently in early star formation. We note that the quantity should, in principle, correlate with various physical factors. The density of the intergalactic medium (IGM), responsible for ram pressure, will presumably increase with increasing . Similarly, the tidal fields, which are due to variations in the gravitational field, have the same dependence as in Equation 6. Additionally, is also a measure of the radiation received from the neighbouring galaxies. Hence, environments with large values provide the mechanisms needed for both removing and ionising the ISM in the dwarfs (assuming a relation between B band and ionising flux). The third possibility, the gas being transformed more efficiently in early star formation epochs, would make the dwarfs in high regions have greater stellar masses for the same than those in the outskirts of groups. Again, the relation between and would allow investigation of this issue by permitting direct estimates of the baryonic masses.
Interestingly, is comparable to or larger than
the age of the Universe for almost all sample galaxies. This is a sign that
the current SFR is lower than the past average rate in most galaxies.
Similarly, is also comparable to or greater than the age
of the Universe. However, as increases with
, remains more or less constant, i. e., does
not affect the rate at which gas is being used up by star formation in
present day dwarf galaxies. This could have also been seen from the fact
that and SFR have similar dependencies.
Unsurprisingly, we also note that ratio decreases.
So although the star formation seems to be lower at high ,
the neutral gas fraction (as opposed to absolute quantity) available for
further star formation is lower than average. This supports the idea that
the Hi must have been depleted in an early and strong burst of star
formation or is being removed by external mechanisms.
In the upper panel of Figure 7 there appears to be a sub-sample of galaxies, identified by red markers, that have higher SFR values than might be expected for their values. In particular, there are 14 galaxies with SFR yr-1 and (Figure 7). These objects do not belong to any given group: IC10, IC1613, NGC3109 and NGC6822 are in the Local Group; NGC59 and ESO473-G024 are in the Sculptor group; and ESO324-G024, ESO444-G084, NGC5237, NGC5264, IC4316, ESO325-G011, ESO383-G087, NGC5102 belong the CenA group. These galaxies also have higher Hi mass than the overall sample average. This could be explained if they come from regions of lower than most of their counterparts, either because of highly elliptical orbits or they are on their first infall onto the group. One would expect such galaxies to have colder ISM, since they would have been overall less affected by ISM warming mechanisms, e. g., tidal stirring and neighbouring galaxy radiation. On top of being a prerequisite for star formation, cold ISM should also be more resilient to gas removal by ram pressure since its density would be higher (see Gunn & Gott, 1972).
Moreover, if these 14 galaxies that are potentially on their first group infall are excluded, then is no longer largely independent of (cf. Table 6) but instead rises significantly with increasing (). Whether this is driven by the low SFR or the lack of ISM at high is unclear.
Grebel et al. (2003) also noted that the removal of the ISM from a given dwarf would not produce a non-rotating object and that therefore the late-type and early-type dwarfs should be considered as intrinsically different objects. However, as previously noted, the tidal fields should also correlate with . These have been known to remove angular momentum from low total mass objects (Read & Gilmore, 2005). We would therefore expect a dependence of galaxy kinematics on nearby galaxy density. This can be measured observationally: given a sufficient sample, suitably normalised measures of rotation velocity should decrease with increasing .
3.4 Centaurus A vs Sculptor: An environmental comparison
As it can be implied from Figure 1, the scarce population of the
Scl group makes for a very different environment to the denser distribution
of the CenA group. The detailed galaxy phase-space distributions (Tables
1 and 2) reveals the extent of the difference. On
the one hand, Scl is a loose filament of galaxies (Jerjen et al., 1998) that
more or less obeys the Hubble flow (Karachentsev et al., 2003, km s-1 Mpc-1). On the other hand, the CenA group
is a similar environment to that of the Local Group. CenA has a slightly
higher total mass then the Local Group (Karachentsev et al., 2002), but an
otherwise similar two central body structure.

Figure 9 shows a breakup of the distribution for each
group. It can be seen that the method devised in this paper has the merit
of not assuming that all galaxies in each group are in the same situation.
Indeed, analysing the environment on a ‘per galaxy’ basis shows that both
groups have regions with equally low values, yet, as expected, the mean
of the Scl group is lower than that of CenA. This latter group,
however, lacks the high objects seen in the Local Group. These
missing galaxies are, presumably, optically faint dSphs lying close to NGC5128
(CenA) and NGC5236 (M83). Their low surface brightness and relatively large
angular size makes them very hard to detect and thorough searches are
needed to better constrain the high end of the density distribution in the
CenA group. Note that the addition of low surface brightness galaxies is
unlikely to have any notable effects on the currently measured
distribution.
It should also be noted that the low end of the spectrum is a
matter of definition. No ‘field’ galaxies were included in this study and,
therefore, the cutoff at Mpc-3 is an
artificially imposed one. Nevertheless, the effects of environment can be
seen even at these lowest values, i. e., no clear departure from the presumed correlations can be observed in Figures 7 and 8. One would have expected a turnoff
at low where the effects of environment become negligible.
The correlations seen in Figure 8 suggest that environment
accelerates the evolution of dwarfs: galaxies encountered in high regions
have already formed most of their stars and are transforming their remaining Hi
reserve inefficiently at a very slow rate. This implies that the global effect a galaxy
has on its surrounding environment extends very far, at least as far as
1 Mpc for a galaxy. Indeed, the lack of a change of
slope at low in the relation of Figures 7 and
8 indicates we have not probed regimes where dwarf galaxy
evolution is not influenced by environment.
4 Conclusions
The results of H imaging of Scl and CenA dwarf galaxies were presented and the data were analysed in the context of the morphology-density relation. The main results are:
-
1.
Of the 30 observed objects we have detected H emission in 13. These consist of five late-type dwarfs in the CenA group, three in the Scl group, two early-type dwarfs in CenA, one mixed-type in CenA and two in Scl.
-
2.
The density of the surrounding environment (i. e., the luminosity and proximity of other nearby galaxies, as measured by ) significantly influences the properties of dwarfs. Dwarf galaxies in high regions of the CenA and Scl group have, in general, lower star formation rates, lower Hi masses, lower Hi mass to luminosity ratios, as well as higher star formation timescale. The gas depletion timescale is unaffected by . These effects can even be observed out to the lowest probed densities ( Mpc-3).
-
3.
While there are clearly a number of unaccounted parameters that contribute to the scatter in the factors determining galaxy morphology, an environmental dependence is evident. One of the unaccounted factors is likely to be the orbital history of each object: we only see a snapshot but orbit averaged values of quantities such as are really what is required.
-
4.
Some galaxies do not follow the relation between instantaneous star formation rate and that would be expected by taking the morphology-density relation at face value. These galaxies also have larger Hi masses than the sample average and may be objects on their first infall onto the galaxy groups: some of their intrinsic properties (e. g., interstellar medium temperature) may be a reflection of this.
-
5.
The centrally located dwarfs have lower current star formation rates. Consequently, for the same total stellar mass the objects at high probably formed most of their stars at earlier times than the ones in low regions.
-
6.
Our data indicate that there is a weak anti-correlation between B band luminosity and . This may be at odds with CDM which predicts and increase in total galaxy mass with increasing density. H band photometry of these objects is needed to further investigate this possibility.
References
- Balogh et al. (2004) Balogh, M., Eke, V., Miller, C., Lewis, I., Bower, R., Couch, W., Nichol, R., Bland-Hawthorn, J., Baldry, I. K., Baugh, C., Bridges, T., Cannon, R., Cole, S., Colless, M., Collins, C., Cross, N., Dalton, G., de Propris, R., Driver, S. P., Efstathiou, G., Ellis, R. S., Frenk, C. S., Glazebrook, K., Gomez, P., Gray, A., Hawkins, E., Jackson, C., Lahav, O., Lumsden, S., Maddox, S., Madgwick, D., Norberg, P., Peacock, J. A., Percival, W., Peterson, B. A., Sutherland, W., & Taylor, K. 2004, MNRAS, 348, 1355
- Banks et al. (1999) Banks, G. D., Disney, M. J., Knezek, P. M., Jerjen, H., Barnes, D. G., Bhatal, R., de Blok, W. J. G., Boyce, P. J., Ekers, R. D., Freeman, K. C., Gibson, B. K., Henning, P. A., Kilborn, V., Koribalski, B., Kraan-Korteweg, R. C., Malin, D. F., Minchin, R. F., Mould, J. R., Oosterloo, T., Price, R. M., Putman, M. E., Ryder, S. D., Sadler, E. M., Staveley-Smith, L., Stewart, I., Stootman, F., Vaile, R. A., Webster, R. L., & Wright, A. E. 1999, ApJ, 524, 612
- Barnes et al. (2001) Barnes, D. G., Staveley-Smith, L., de Blok, W. J. G., Oosterloo, T., Stewart, I. M., Wright, A. E., Banks, G. D., Bhathal, R., Boyce, P. J., Calabretta, M. R., Disney, M. J., Drinkwater, M. J., Ekers, R. D., Freeman, K. C., Gibson, B. K., Green, A. J., Haynes, R. F., te Lintel Hekkert, P., Henning, P. A., Jerjen, H., Juraszek, S., Kesteven, M. J., Kilborn, V. A., Knezek, P. M., Koribalski, B., Kraan-Korteweg, R. C., Malin, D. F., Marquarding, M., Minchin, R. F., Mould, J. R., Price, R. M., Putman, M. E., Ryder, S. D., Sadler, E. M., Schröder, A., Stootman, F., Webster, R. L., Wilson, W. E., & Ye, T. 2001, MNRAS, 322, 486
- Beaulieu et al. (2006) Beaulieu, S. F., Freeman, K. C., Carignan, C., Lockman, F. J., & Jerjen, H. 2006, AJ, 131, 325
- Bernardi et al. (2006) Bernardi, M., Nichol, R. C., Sheth, R. K., Miller, C. J., & Brinkmann, J. 2006, AJ, 131, 1288
- Binggeli et al. (1990) Binggeli, B., Tarenghi, M., & Sandage, A. 1990, A&A, 228, 42
- Blitz & Robishaw (2000) Blitz, L., & Robishaw, T. 2000, ApJ, 541, 675
- Bouchard et al. (2006) Bouchard, A., Carignan, C., & Staveley-Smith, L. 2006, AJ, 131, 2913
- Bouchard et al. (2005) Bouchard, A., Jerjen, H., Da Costa, G. S., & Ott, J. 2005, AJ, 130, 2058
- Bouchard et al. (2007) —. 2007, AJ, 133, 261
- Buat et al. (2002) Buat, V., Boselli, A., Gavazzi, G., & Bonfanti, C. 2002, A&A, 383, 801
- Chemin et al. (2006) Chemin, L., Carignan, C., Drouin, N., & Freeman, K. C. 2006, AJ, 132, 2527
- Clemens et al. (2006) Clemens, M. S., Bressan, A., Nikolic, B., Alexander, P., Annibali, F., & Rampazzo, R. 2006, MNRAS, 370, 702
- Coleman et al. (2004) Coleman, M., Da Costa, G. S., Bland-Hawthorn, J., Martínez-Delgado, D., Freeman, K. C., & Malin, D. 2004, AJ, 127, 832
- Coleman et al. (2005) Coleman, M. G., Da Costa, G. S., & Bland-Hawthorn, J. 2005, AJ, 130, 1065
- Côté et al. (2008) Côté, S., Draginda, A., Skillman, E., & Miller, B. W. 2008, AJ submitted
- Côté et al. (1997) Côté, S., Freeman, K. C., Carignan, C., & Quinn, P. J. 1997, AJ, 114, 1313
- Da Costa et al. (2007) Da Costa, G. S., Jerjen, H., & Bouchard, A. 2007, ArXiv e-prints: astro-ph/0710.1420
- De Rijcke et al. (2003) De Rijcke, S., Dejonghe, H., Zeilinger, W. W., & Hau, G. K. T. 2003, A&A, 400, 119
- De Rijcke et al. (2004) —. 2004, A&A, 426, 53
- de Vaucouleurs et al. (1991) de Vaucouleurs, G., de Vaucouleurs, A., Corwin, H. G., Buta, R. J., Paturel, G., & Fouque, P. 1991, Third Reference Catalogue of Bright Galaxies (Volume 1-3, XII, 2069 pp. 7 figs.. Springer-Verlag Berlin Heidelberg New York)
- Dellenbusch et al. (2008) Dellenbusch, K. E., Gallagher, III, J. S., Knezek, P. M., & Noble, A. G. 2008, AJ, 135, 326
- Dopita & Hua (1997) Dopita, M. A., & Hua, C. T. 1997, ApJS, 108, 515
- Dressler (1980) Dressler, A. 1980, ApJ, 236, 351
- Einasto et al. (1974) Einasto, J., Saar, E., Kaasik, A., & Chernin, A. D. 1974, Nature, 252, 111
- Ellingson et al. (2001) Ellingson, E., Lin, H., Yee, H. K. C., & Carlberg, R. G. 2001, ApJ, 547, 609
- Gavazzi et al. (2006) Gavazzi, G., O’Neil, K., Boselli, A., & van Driel, W. 2006, A&A, 449, 929
- Gómez et al. (2003) Gómez, P. L., Nichol, R. C., Miller, C. J., Balogh, M. L., Goto, T., Zabludoff, A. I., Romer, A. K., Bernardi, M., Sheth, R., Hopkins, A. M., Castander, F. J., Connolly, A. J., Schneider, D. P., Brinkmann, J., Lamb, D. Q., SubbaRao, M., & York, D. G. 2003, ApJ, 584, 210
- Grebel (2001) Grebel, E. K. 2001, Astrophysics and Space Science Supplement, 277, 231
- Grebel et al. (2003) Grebel, E. K., Gallagher, J. S., & Harbeck, D. 2003, AJ, 125, 1926
- Gunn & Gott (1972) Gunn, J. E., & Gott, J. R. I. 1972, ApJ, 176, 1
- Huchtmeier et al. (2000) Huchtmeier, W. K., Karachentsev, I. D., Karachentseva, V. E., & Ehle, M. 2000, A&AS, 141, 469
- Israel (1998) Israel, F. P. 1998, A&A Rev., 8, 237
- Jerjen et al. (2000a) Jerjen, H., Binggeli, B., & Freeman, K. C. 2000a, AJ, 119, 593
- Jerjen et al. (1998) Jerjen, H., Freeman, K. C., & Binggeli, B. 1998, AJ, 116, 2873
- Jerjen et al. (2000b) —. 2000b, AJ, 119, 166
- Jerjen et al. (2000c) Jerjen, H., Kalnajs, A., & Binggeli, B. 2000c, A&A, 358, 845
- Jerjen & Rejkuba (2001) Jerjen, H., & Rejkuba, M. 2001, A&A, 371, 487
- Jerjen et al. (2001) Jerjen, H., Rekola, R., Takalo, L., Coleman, M., & Valtonen, M. 2001, A&A, 380, 90
- Karachentsev et al. (2006) Karachentsev, I. D., Dolphin, A., Tully, R. B., Sharina, M., Makarova, L., Makarov, D., Karachentseva, V., Sakai, S., & Shaya, E. J. 2006, AJ, 131, 1361
- Karachentsev et al. (2003) Karachentsev, I. D., Grebel, E. K., Sharina, M. E., Dolphin, A. E., Geisler, D., Guhathakurta, P., Hodge, P. W., Karachentseva, V. E., Sarajedini, A., & Seitzer, P. 2003, A&A, 404, 93
- Karachentsev et al. (2004) Karachentsev, I. D., Karachentseva, V. E., Huchtmeier, W. K., & Makarov, D. I. 2004, AJ, 127, 2031
- Karachentsev et al. (2002) Karachentsev, I. D., Sharina, M. E., Dolphin, A. E., Grebel, E. K., Geisler, D., Guhathakurta, P., Hodge, P. W., Karachentseva, V. E., Sarajedini, A., & Seitzer, P. 2002, A&A, 385, 21
- Karachentsev et al. (2007) Karachentsev, I. D., Tully, R. B., Dolphin, A., Sharina, M., Makarova, L., Makarov, D., Sakai, S., Shaya, E. J., Kashibadze, O. G., Karachentseva, V., & Rizzi, L. 2007, AJ, 133, 504
- Kennicutt et al. (1994) Kennicutt, R. C., Tamblyn, P., & Congdon, C. E. 1994, ApJ, 435, 22
- Kirby et al. (2008) Kirby, E., Jerjen, H., Ryder, S., & Driver, S. 2008, AJ, in press, ArXiv e-prints 0808.2529
- Koribalski et al. (2004) Koribalski, B. S., Staveley-Smith, L., Kilborn, V. A., Ryder, S. D., Kraan-Korteweg, R. C., Ryan-Weber, E. V., Ekers, R. D., Jerjen, H., Henning, P. A., Putman, M. E., Zwaan, M. A., de Blok, W. J. G., Calabretta, M. R., Disney, M. J., Minchin, R. F., Bhathal, R., Boyce, P. J., Drinkwater, M. J., Freeman, K. C., Gibson, B. K., Green, A. J., Haynes, R. F., Juraszek, S., Kesteven, M. J., Knezek, P. M., Mader, S., Marquarding, M., Meyer, M., Mould, J. R., Oosterloo, T., O’Brien, J., Price, R. M., Sadler, E. M., Schröder, A., Stewart, I. M., Stootman, F., Waugh, M., Warren, B. E., Webster, R. L., & Wright, A. E. 2004, AJ, 128, 16
- Lee et al. (2003) Lee, H., Grebel, E. K., & Hodge, P. W. 2003, A&A, 401, 141
- Lee et al. (2007) Lee, H., Zucker, D. B., & Grebel, E. K. 2007, MNRAS, 376, 820
- Lemson & Kauffmann (1999) Lemson, G., & Kauffmann, G. 1999, MNRAS, 302, 111
- Lewis et al. (2002) Lewis, I., Balogh, M., De Propris, R., Couch, W., Bower, R., Offer, A., Bland-Hawthorn, J., Baldry, I. K., Baugh, C., Bridges, T., Cannon, R., Cole, S., Colless, M., Collins, C., Cross, N., Dalton, G., Driver, S. P., Efstathiou, G., Ellis, R. S., Frenk, C. S., Glazebrook, K., Hawkins, E., Jackson, C., Lahav, O., Lumsden, S., Maddox, S., Madgwick, D., Norberg, P., Peacock, J. A., Percival, W., Peterson, B. A., Sutherland, W., & Taylor, K. 2002, MNRAS, 334, 673
- Lo et al. (1993) Lo, K. Y., Sargent, W. L. W., & Young, K. 1993, AJ, 106, 507
- Macchetto et al. (1996) Macchetto, F., Pastoriza, M., Caon, N., Sparks, W. B., Giavalisco, M., Bender, R., & Capaccioli, M. 1996, A&AS, 120, 463
- Martínez-Delgado & Aparicio (1997) Martínez-Delgado, D., & Aparicio, A. 1997, ApJ, 480, L107
- Mateo (1998) Mateo, M. L. 1998, ARA&A, 36, 435
- Maulbetsch et al. (2007) Maulbetsch, C., Avila-Reese, V., Colín, P., Gottlöber, S., Khalatyan, A., & Steinmetz, M. 2007, ApJ, 654, 53
- Mayer et al. (2001) Mayer, L., Governato, F., Colpi, M., Moore, B., Quinn, T., Wadsley, J., Stadel, J., & Lake, G. 2001, ApJ, 547, L123
- Miller (1996) Miller, B. W. 1996, AJ, 112, 991
- Miller & Veilleux (2003) Miller, S. T., & Veilleux, S. 2003, ApJS, 148, 383
- Monaco et al. (2004) Monaco, L., Bellazzini, M., Ferraro, F. R., & Pancino, E. 2004, MNRAS, 353, 874
- Pedraz et al. (2002) Pedraz, S., Gorgas, J., Cardiel, N., Sánchez-Blázquez, P., & Guzmán, R. 2002, MNRAS, 332, L59
- Peebles (1990) Peebles, P. J. E. 1990, ApJ, 362, 1
- Pietrzyński et al. (2006) Pietrzyński, G., Gieren, W., Soszyński, I., Udalski, A., Bresolin, F., Kudritzki, R.-P., Mennickent, R., Walker, A., Garcia, A., Szewczyk, O., Szymański, M., Kubiak, M., & Wyrzykowski, Ł. 2006, AJ, 132, 2556
- Postman & Geller (1984) Postman, M., & Geller, M. J. 1984, ApJ, 281, 95
- Read & Gilmore (2005) Read, J. I., & Gilmore, G. 2005, MNRAS, 356, 107
- Rejkuba et al. (2006) Rejkuba, M., da Costa, G. S., Jerjen, H., Zoccali, M., & Binggeli, B. 2006, A&A, 448, 983
- Rines et al. (2005) Rines, K., Geller, M. J., Kurtz, M. J., & Diaferio, A. 2005, AJ, 130, 1482
- Romanishin (1990) Romanishin, W. 1990, AJ, 100, 373
- Sakai et al. (2004) Sakai, S., Ferrarese, L., Kennicutt, Jr., R. C., & Saha, A. 2004, ApJ, 608, 42
- Sandage & Binggeli (1984) Sandage, A., & Binggeli, B. 1984, AJ, 89, 919
- Simien & Prugniel (2002) Simien, F., & Prugniel, P. 2002, A&A, 384, 371
- Skillman et al. (2003) Skillman, E. D., Côté, S., & Miller, B. W. 2003, AJ, 125, 593
- St-Germain et al. (1999) St-Germain, J., Carignan, C., Côté, S., & Oosterloo, T. 1999, AJ, 118, 1235
- Thomas et al. (2005) Thomas, D., Maraston, C., Bender, R., & de Oliveira, C. M. 2005, ApJ, 621, 673
- Tolstoy et al. (2004) Tolstoy, E., Irwin, M. J., Helmi, A., Battaglia, G., Jablonka, P., Hill, V., Venn, K. A., Shetrone, M. D., Letarte, B., Cole, A. A., Primas, F., Francois, P., Arimoto, N., Sadakane, K., Kaufer, A., Szeifert, T., & Abel, T. 2004, ApJ, 617, L119
- van den Bergh (1994) van den Bergh, S. 1994, ApJ, 428, 617
- van Zee (2000) van Zee, L. 2000, AJ, 119, 2757
- van Zee et al. (2004) van Zee, L., Skillman, E. D., & Haynes, M. P. 2004, AJ, 128, 121
- Whitmore & Gilmore (1991) Whitmore, B. C., & Gilmore, D. M. 1991, ApJ, 367, 64
- Worthey (1994) Worthey, G. 1994, ApJS, 95, 107
- Young & Lo (1997) Young, L. M., & Lo, K. Y. 1997, ApJ, 476, 127