Precise measurement of hadronic -decays with an meson
K. Inami
T. Ohshima
H. Kaji
I. Adachi
H. Aihara
K. Arinstein
V. Aulchenko
T. Aushev
I. Bedny
V. Bhardwaj
A. Bondar
M. Bračko
T. E. Browder
M.-C. Chang
Y. Chao
R. Chistov
I.-S. Cho
Y. Choi
J. Dalseno
M. Dash
S. Eidelman
D. Epifanov
N. Gabyshev
B. Golob
J. Haba
K. Hara
K. Hayasaka
H. Hayashii
D. Heffernan
Y. Hoshi
W.-S. Hou
H. J. Hyun
T. Iijima
A. Ishikawa
Y. Iwasaki
D. H. Kah
J. H. Kang
T. Kawasaki
H. Kichimi
H. O. Kim
S. K. Kim
Y. I. Kim
Y. J. Kim
P. Krokovny
R. Kumar
A. Kuzmin
Y.-J. Kwon
S.-H. Kyeong
J. S. Lange
J. S. Lee
M. J. Lee
S. E. Lee
A. Limosani
S.-W. Lin
R. Louvot
F. Mandl
S. McOnie
T. Medvedeva
K. Miyabayashi
H. Miyata
Y. Miyazaki
R. Mizuk
E. Nakano
M. Nakao
H. Nakazawa
O. Nitoh
S. Noguchi
S. Ogawa
S. Okuno
H. Ozaki
P. Pakhlov
G. Pakhlova
C. W. Park
H. Park
H. K. Park
K. S. Park
L. S. Peak
L. E. Piilonen
A. Poluektov
Y. Sakai
O. Schneider
M. Shapkin
V. Shebalin
J.-G. Shiu
B. Shwartz
J. B. Singh
S. Stanič
M. Starič
T. Sumiyoshi
M. Tanaka
G. N. Taylor
Y. Teramoto
S. Uehara
T. Uglov
S. Uno
Y. Usov
Y. Usuki
G. Varner
A. Vinokurova
C. H. Wang
P. Wang
X. L. Wang
Y. Watanabe
R. Wedd
E. Won
Y. Yamashita
Z. P. Zhang
V. Zhilich
V. Zhulanov
T. Zivko
A. Zupanc
O. Zyukova
Budker Institute of Nuclear Physics, Novosibirsk, Russia
Department of Physics, Fu Jen Catholic University, Taipei, Taiwan
Justus-Liebig-Universität Gießen, Gießen, Germany
The Graduate University for Advanced Studies, Hayama, Japan
University of Hawaii, Honolulu, HI, USA
High Energy Accelerator Research Organization (KEK), Tsukuba, Japan
Institute of High Energy Physics, Chinese Academy of Sciences, Beijing, PR China
Institute for High Energy Physics, Protvino, Russia
Institute of High Energy Physics, Vienna, Austria
Institute for Theoretical and Experimental Physics, Moscow, Russia
J. Stefan Institute, Ljubljana, Slovenia
Kanagawa University, Yokohama, Japan
Korea University, Seoul, South Korea
Kyungpook National University, Taegu, South Korea
École Polytechnique Fédérale de Lausanne, EPFL, Lausanne, Switzerland
Faculty of Mathematics and Physics, University of Ljubljana, Ljubljana, Slovenia
University of Maribor, Maribor, Slovenia
University of Melbourne, Victoria, Australia
Nagoya University, Nagoya, Japan
Nara Women’s University, Nara, Japan
National Central University, Chung-li, Taiwan
National United University, Miao Li, Taiwan
Department of Physics, National Taiwan University, Taipei, Taiwan
Nippon Dental University, Niigata, Japan
Niigata University, Niigata, Japan
University of Nova Gorica, Nova Gorica, Slovenia
Osaka City University, Osaka, Japan
Osaka University, Osaka, Japan
Panjab University, Chandigarh, India
Saga University, Saga, Japan
University of Science and Technology of China, Hefei, PR China
Seoul National University, Seoul, South Korea
Sungkyunkwan University, Suwon, South Korea
University of Sydney, Sydney, NSW, Australia
Toho University, Funabashi, Japan
Tohoku Gakuin University, Tagajo, Japan
Department of Physics, University of Tokyo, Tokyo, Japan
Tokyo Metropolitan University, Tokyo, Japan
Tokyo University of Agriculture and Technology, Tokyo, Japan
IPNAS, Virginia Polytechnic Institute and State University, Blacksburg, VA, USA
Yonsei University, Seoul, South Korea
Abstract
We have studied hadronic decay modes involving
an meson using 490 fb-1 of data collected with the Belle
detector at the KEKB asymmetric-energy collider.
The following branching fractions have been measured:
,
,
,
, and
.
These results are substantially more precise than previous measurements.
The new measurements are compared with theoretical calculations based on the CVC
hypothesis or the chiral perturbation theory.
We also set upper limits on branching fractions for decays
into , ,
,
and non-resonant final states.
Hadronic decays of the lepton are very important for studying
QCD phenomena at a low-energy scale.
Various decay modes including an -meson represent a wide class
of such decays, which are still poorly studied.
One of the important tasks in this field is to test
effective chiral theories [1, 2, 3, 4].
The decay amplitudes in these theories
are based on an effective Lagrangian of pseudoscalar,
vector and axial-vector mesons with
symmetry.
On the other hand, for some decays the branching fractions
as well as spectral functions of the final states can be predicted
using the vector dominance model (VDM).
Another important issue is testing the relations
between the cross section of and
the spectral function in decay
predicted by conservation of vector current (CVC) and
isospin symmetry [5].
For all of the above tasks, precise measurements of the branching
fractions as well as detailed studies of the final-state invariant mass
distributions are highly desirable.
Three -decay modes involving mesons,
111Unless specified otherwise,
charge-conjugate decays are implied throughout the paper.,
, and
, have been studied by
CLEO [6, 7, 8] and ALEPH [9].
However, the experimental statistics were very limited.
For example, CLEO has the most precise measurements with 85
events in the mode, 125 events in the
mode and 25 in the
mode.
The limited statistics of these measurements result in
large uncertainties for the branching fractions and do not
allow study of the hadronic mass spectra.
We report a detailed study of the branching
fractions for ,
, ,
as well as decays. The invariant mass
in the decay and the invariant
mass in the decay are studied to evaluate
the branching fraction of the decay.
In addition, some other final-state invariant mass distributions are
presented and discussed.
This study was performed at the KEKB asymmetric-energy
collider [10] with the Belle detector.
The results are based on a 490 fb-1 data sample that
contains about 450 million -pairs, which is almost 100 times larger
than in any of the previous measurements.
The structure of this paper is as follows.
Section 2 describes the Belle detector.
Event selection is explained in Section 3.
The branching fractions are determined in Section 4,
where that of is evaluated from
analysis of the and
samples in Section 4.3. Finally,
some concluding remarks are given in Section 5.
2 Experimental apparatus and Monte-Carlo simulation
The Belle detector is a large-solid-angle magnetic spectrometer that
consists of a silicon vertex detector (SVD),
a 50-layer central drift chamber (CDC), an array of
aerogel threshold Cherenkov counters (ACC),
a barrel-like arrangement of time-of-flight
scintillation counters (TOF), and an electromagnetic calorimeter (ECL)
comprised of CsI(Tl) crystals located inside
a superconducting solenoid coil that provides a 1.5 T
magnetic field. An iron flux-return located outside
the coil is instrumented to detect mesons and to identify
muons (KLM). The detector is described in detail elsewhere [11].
Two inner detector configurations were used. A 2.0 cm radius beam pipe
and a 3-layer silicon vertex detector were used for the first sample
of 140 fb-1, while a 1.5 cm radius beam pipe, a 4-layer
silicon detector and a small-cell inner drift chamber were used to record
the remaining 350 fb-1 [12].
Particle identification (PID) of the charged tracks uses
likelihood ratios, , for a charged particle of species
().
is defined as
(the sum runs over the relevant particle species), where is
a likelihood based on the energy deposit and shower shape in the ECL,
the momentum and measured in the CDC, the particle range
in the KLM, the light yield in the ACC, and the particle’s time-of-flight
from the TOF counter [13].
The efficiencies for kaon, muon and electron identification are
77% for momenta of GeV/,
92% for GeV/ and
94% for GeV/, respectively.
The detection efficiency for each signal mode and the level of background (BG)
contribution are estimated from Monte Carlo (MC)
simulations. To generate signal events as well as -decay
backgrounds, the KKMC program [14] is used.
For the decay modes not covered by KKMC, like
, , ,
the signal MC is produced assuming a pure phase-space distribution
of the hadronic system with a weak interaction.
The background
from ( continuum) is simulated
using the EvtGen procedure [15].
The detector response is simulated by a GEANT3 [16] based program.
Throughout the paper the efficiencies quoted include the branching ratios
of the corresponding decays.
3 Event Selections
The signal events should have the following common features
in the reaction:
where denotes
, , , or
systems. The , and are
reconstructed through , ,
and decays, respectively.
The meson is identified through the
decay mode for all channels while
the mode is added for the
decay mode.
The signal events, therefore, comprise either two or four charged tracks
with zero net charge and two or four ’s.
In order to take into account initial-state radiation,
we allow at most one
extra on both the signal and tag sides.
Each charged track is required to have a transverse momentum
GeV/, and a polar angle of ,
where and are measured relative to the direction opposite
to that of the incident beam in the laboratory frame.
Each photon candidate should have an energy GeV within the
same polar angle region as for the charged particles.
The tag-side is required to decay
into leptons, i.e.
,
which corresponds to a branching fraction of 35.2% [17].
The lepton candidates are required to be well identified
by requirements on the or PID parameters
with GeV/.
The thrust axis () is defined to maximize
,
where denotes the momentum of each particle in
the center-of-mass system (CM),
and the sum runs over all detected particles in an event.
The requirement is applied to remove events.
An event is divided into two hemispheres by the plane perpendicular to
.
The hemisphere
that includes with an
is referred to as the signal side, while the opposite hemisphere,
which includes , is defined as the tag side.
In order to remove non- pair backgrounds, such as the
continuum, the total energy in CM is required to be in the range
GeV.
In addition, the invariant masses of both the signal and the tag sides are
required to be
smaller than the -mass:
(1.78 GeV/).
To remove two-photon backgrounds, the missing momentum should
correspond to a particle crossing the fiducial region;
we require that the missing momentum satisfy
.
After applying these requirements, the background level
is 3% of the signal yield.
Background from two-photon reactions is negligible.
To reconstruct an , two ’s with GeV
are required in the barrel region ().
In addition, we allow combinations with
at most one extra with GeV in
the endcap region on the signal side
to take into account initial-state
radiation as well as beam-induced BG clusters in the calorimeter.
In order to reduce the number of incorrect combinations with
a from
decay (denoted hereafter as ), the -candidate
() should not form a mass with any
other , i.e., a -veto is applied.
The mass window is defined in this paper as
0.105 GeV/ 0.165 GeV/, which is a
range of the detector resolution.
3.1 decay
Candidate events for this decay mode must contain
one charged track and at least two ’s in the case,
or three charged tracks and two ’s in the
case.
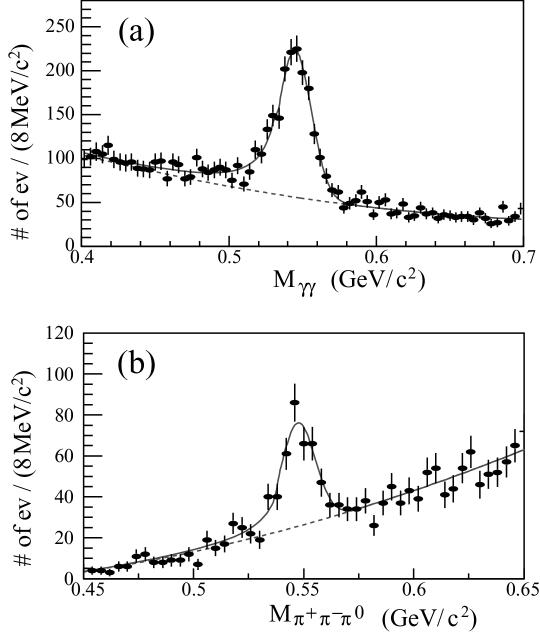
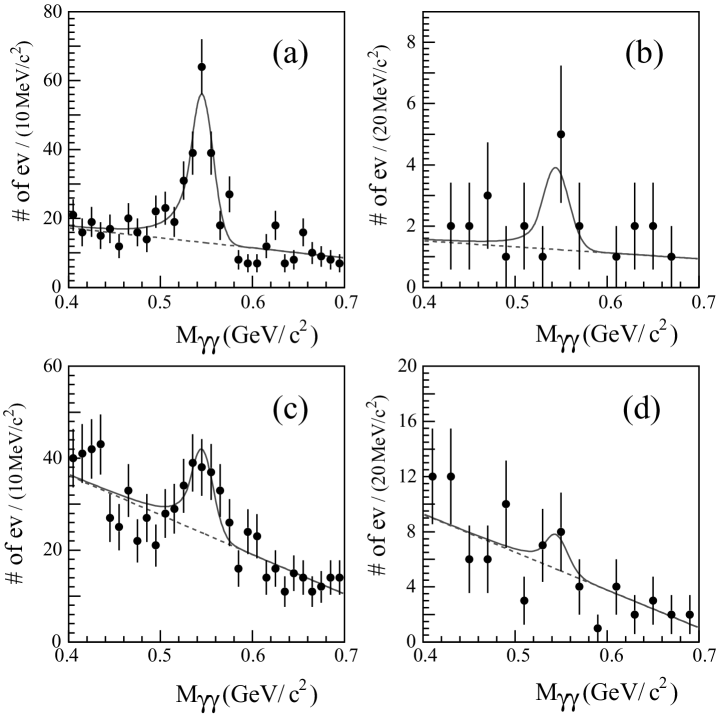
Figure 1: (a)
and (b) distributions for
selection in
and decays,
respectively.
Data are fit with a Crystal Ball function
plus a second-order polynomial for the BG.
The best-fit result is indicated by the solid curve with the BG shown
by the dashed curve.
A kaon is identified by the parameter with
GeV/. In addition,
a low value is required to remove beam electrons
from two-photon processes;
this requirement reduces two-photon BG to a negligible level.
The opening angle between the and is required to satisfy
the condition ,
to reduce the combinatorial BG.
In addition, the opening angle and energy of the two ’s should
fulfill the following conditions:
and
, respectively.
For reconstruction,
the selection criteria are basically the same as in
the case.
Here candidates should have two additional charged tracks,
and two of the ’s must form a instead of an .
The and invariant mass distributions
around mass
are shown in Figs.1 (a) and (b), respectively.
The peak is clearly seen in both cases.
The selection efficiencies (including the intermediate branching fractions
of , , and
)
are in the and
in the case.
3.2 and
decays
For these decays, an is reconstructed through the mode
only, so that the signal event should contain one charged track and four
’s on the signal side.
All ’s, except for a possible extra , are required to
be detected in
the barrel region of the calorimeter, and two of them should
form a combination consistent the mass.
The total momentum on the signal side is required to satisfy
GeV/.
A condition on the opening angle between the missing momentum
in the CM and the thrust axis is imposed:
,
to remove BG’s with large missing
momentum on the signal side.
Charged kaons and pions are selected by requiring
large and small
in the mode, while
small and small are selected in
the mode.
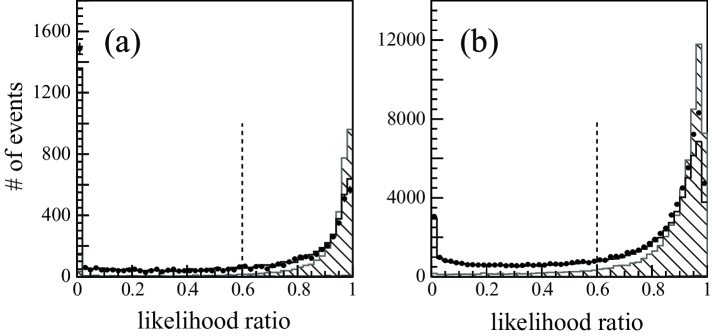
For further background rejection, we construct a likelihood
using the following seven variables:
, momenta of the and in the CM
(, ), the missing-mass squared
(), the energy of the ’s in the CM
(), , and
.
The MC simulation is used to study the likelihood distributions of
generic and the small residual
BG ()
as well as the signal ().
A likelihood ratio is defined as
.
The distribution is shown in Figs. 2 (a) for
and (b) for decay;
with the requirement , about half of the background is removed,
while 93% and 90% of the signal samples are retained, respectively.
Figure 2: Distribution of the likelihood ratio for
(a) and (b) .
Dots are experimental data.
The hatched and normal histograms
indicate the signal and BG
MC distributions, respectively. The dashed line shows the threshold of
this selection.
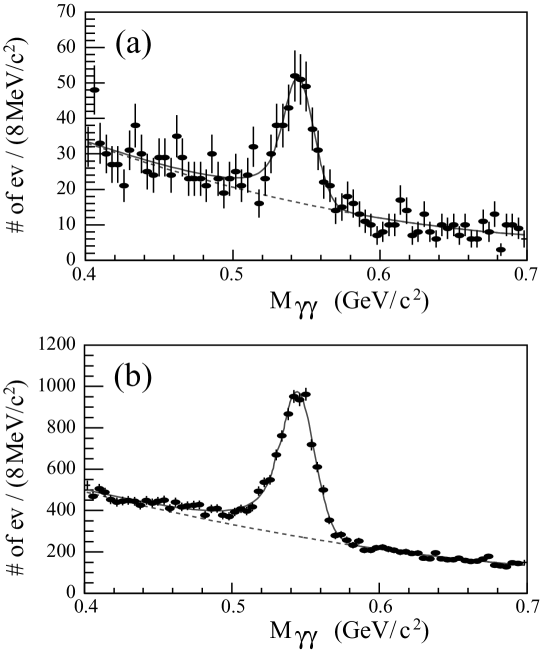
Figure 3: distributions
for (a) and (b)
candidates.
Data are fit with a Crystal Ball function plus a second-order polynomial
for the BG.
The result of the best fit is indicated by the solid curve with the BG
shown by the dashed curve.
The resulting distributions are shown in
Figs.3 (a) and (b) for the
and modes, respectively.
The peaks are clearly visible.
The detection efficiencies are and
in the and
decays, respectively.
3.3 decay
On the signal side, three charged tracks and at least two ’s are
required.
To suppress two-photon BG, the tracks should not be identified
as electrons.
Without ID the pion mass of GeV/ is
assigned to all three tracks on the signal side, two of the three tracks
with opposite charges are the daughters,
the invariant mass () of which
is required to be within a mass window (),
.
To ensure that these tracks are daughters,
the distance from the interaction
point to the decay vertex on the plane perpendicular to the beam axis
() is required to satisfy the condition:
.
To avoid multiple candidates, the mass of the other possible combination must
not satisfy the mass condition.
Pairs of ’s with GeV are used to form
candidates. We require that
the energy of an candidate, , must be greater than 1.2 GeV.
The resulting distribution is shown in
Fig.5 (a).
The detection efficiency is ,
which includes the tag-side efficiency,
and .
4 Branching Fractions
4.1 ,
and decays
4.1.1 Signal candidates
The meson yields are obtained from fits to
the invariant mass distributions
shown in Figs.1
and 3.
Fits are performed with a Crystal Ball (CB) function [18]
plus a second-order polynomial function to represent the
contribution and combinatorial BG, respectively.
All five parameters of the CB function, as well as three others for BG are
treated as free parameters in the fit.
The results of the fit are shown by the solid curve in
the corresponding figures.
The best fits give masses of
, and
GeV/ for ,
, and decays,
respectively, in the subsample,
while GeV/ for
in the subsample.
The corresponding mass resolutions are
, ,
, and GeV/, respectively.
These values of and are
in good agreement with those obtained from the MC simulation,
although the obtained masses are shifted by 2 - 3 from
the mass in Ref. [17], which is due to the incomplete
detector calibration.
For instance, 0.5442, 0.5450, 0.5464, and 0.5473
GeV/ for a generated mass of 0.54745
GeV/.
The yields obtained from the fits are ,
, and events for the ,
, and modes,
respectively, in the case,
while events for the
decay in the case.
These yields include BG,
attributed to other decays with meson(s), such as
the and
;
continuum with meson(s); cross-feeds among the signal
modes.
4.1.2 Background
The possible backgrounds in the ,
and decay modes include
(a) feed-across from signal modes and (b) other processes such as
, ,
, and .
We first discuss the second source.
BG from generic decays is evaluated using a MC simulation
where the value of
is taken from Ref. [19].
This BG is negligible for and
decays, and is only events, which is smaller than the statistical
uncertainty in the yield
for the decay.
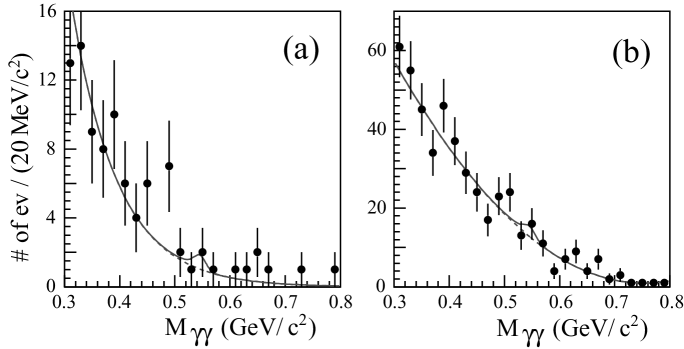
To examine the and
contaminations, we analyze data using selection criteria similar to
those used for the
and modes.
An additional , instead of a , is reconstructed,
and no selection on the likelihood ratio is implemented.
Requiring one photon pair to be in the mass region,
GeV/,
which includes the largest energy ,
the invariant mass distribution of the other candidate,
, is shown in
Figure 4.
The evaluated yields are and events
in the and decays,
respectively,
with detection efficiencies of and ,
respectively.
We then set the upper limits [20]
(1)
and
(2)
at the 90 confidence level (CL)
including systematic uncertainties of 6.9% and 7.1%, respectively.
Since the cross feed probability for these modes with extra ’s is
below 3%, their contamination is ignored.
The decay proceeds via a second-class
current so that its branching fraction is expected to be small,
as low as [3] or less.
Since the efficiency for detecting as signal is
of the order of , the total contamination is then
or less so that this decay can be ignored.
BG from the continuum is examined using both MC and data
in order to take into account the production uncertainty of
the MC.
A enriched sample is produced with some variations of the signal
selection criteria.
We require
, while the requirement is
not applied; the PID requirement on the tag side is reversed.
Other criteria are not changed.
A comparison between the resulting yields of MC and
the data resulted in the following MC scale factors:
for , for
,
and for .
Therefore, we obtain rescaled contaminations of
events in ,
events in and
events in the decay.
These BG’s correspond to 2.8%, 10% and 3.6% of the raw signal yields,
, respectively.
Figure 4: Mass of the ’s combination,
which does not include
the largest energy , for
(a) the sample and
(b) the sample. Data are fit with
a Crystal Ball function plus a second-order polynomial
for the BG. The result of the best fit is indicated by
the solid curve with the BG
shown by the dashed curve.
The yields in the three candidate samples
after the BG subtraction evaluated above, ,
( , , ) are used to
evaluate the corresponding branching fractions, .
To take into account the cross-feeds between
decay channels, we solve the following system of linear equations:
(3)
where
is the efficiency for detecting mode
as mode , which is estimated by MC;
is the total number of -pairs produced.
In the case,
is calculated using
the relation
(the prime indicates quantities for this mode)
with and obtained in the case.
The statistical uncertainty in is , while
the cross-feed contamination is , and is thus insignificant.
The resulting branching fractions are
,
, and
in the case, and
in the case.
4.1.3 Systematic uncertainties
Systematic uncertainties are discussed below, and listed in
Table 1.
Table 1: Summary of systematic uncertainties in each mode ().
The uncertainty in the number of events comes from
the uncertainties in our luminosity measurement by Bhabha events
and the cross section of [21].
Signal modes
Items
BG subtraction
0.6
0.3
0.4
3.3
0.1
0.4
1.5
6.0
0.5
1.5
Detection efficiency
- /lepton-id
3.3/ 2.3
2.2/ 2.8
1.0/2.6
2.8/ 2.6
Tracking
1.3
1.3
1.3
3.3
/ 2.0
2.0/ 2.0
2.0/ 2.0
2.0/
veto
2.8
2.8
2.8
Stat. error of signal MC
0.5
1.7
0.5
1.3
1.6
Luminosity meas.
1.4
0.3
Total
5.9
9.1
5.3
6.2
Subtraction of the BG discussed above provides the systematic
uncertainties includes the statistical errors in the
detection efficiencies for BG processes,
as listed in the Table.
Sizable uncertainties are found only in decay
from and the continuum
and amount to
3.3% and 6.0%, respectively.
The systematic uncertainties for PID, track finding, and
reconstruction, and the -veto are also estimated.
The modeling of the PID likelihood is tested by studying
inclusive samples for and two-photon
samples for leptons; the
Uncertainty in the PID efficiency is 2-3%, 1% and
for , and , respectively.
The uncertainty for finding a track is 1.0 for hadrons and 0.3% for
leptons.
The uncertainty in reconstruction is 2.0%,
obtained from a comparison of and
data samples.
The -veto inefficiency in samples
is evaluated by comparing its effect on the data and MC samples
when the tag-side lepton-PID criterion is reversed from the ordinary
selection.
The statistical errors on the MC simulation are 0.5, 1.7 and
0.5 for , and in the
case, respectively, and 1.3% for
in the case.
The branching fractions used in the MC are cited from
Ref. [17], where
yields a sizable uncertainty of
1.6%, while others are negligible.
The uncertainty of the cross section and
the integrated luminosity are 0.3% and 1.4%, respectively.
All contributions are summed up in quadrature to
obtain the total
uncertainties; they amount to 5.9%, 9.1% and 5.3% for
,
and
, respectively, in the
case,
and 6.2% for in the
case.
Taking into account the systematic errors, we obtain the
following branching fractions:
(4)
(5)
(6)
(7)
For , the two measurements are combined to obtain
(8)
4.2 decay
4.2.1 Signal candidates
For , the signal yield is evaluated from
a fit to the mass distribution in the same way, as discussed
in 4.1.1, but the parameters of the CB function
are fixed to those determined by the signal MC simulation.
The fit result is shown in Fig. 5 (a), yielding
events.
Figure 5: distributions for
(a) , (b) ,
(c) without a , and
(d) samples.
Data are fit with a Crystal Ball function plus a second-order polynomial
for the BG.
The result of the best fit is indicated by the solid curve with the BG
shown by the dashed curve.
We examine and
decays in order to determine their cross-feed contaminations, with selection
criteria similar to those for .
For , the charged track on the signal side is required
to be a kaon; events is
obtained from the fit (see Fig.5 (b)).
For , its mass
distribution, as shown in Fig. 5 (c), is formed from a sample
in which the invariant mass lies outside the mass range
while the other requirements for daughters are the same;
the fit gives events.
4.2.2 Background
The possible background to the signal comes from
and the continuum.
The former sample is selected, requiring an additional on
the signal side.
No clear peak is found in the distribution,
as can be seen in Fig. 5 (d):
events
is obtained with a detection efficiency of .
We therefore set an upper limit on the branching fraction
at the 90% CL.
The BG from this mode in the sample is calculated
to be events.
The contamination of in
decay is events,
following from MC simulation with a scale factor
estimated from the enriched sample.
After subtracting the two above BG’s from the yield for
decay, we solve the simultaneous equations of
Eq.(3) in order to take into account the cross-feeds among
the three modes. Now, the (super)subscripts for the equations
correspond to
, ,
.
The last category includes other peaking BG from generic decays,
which are estimated using samples in the sidebands.
The detection efficiencies are, for instance,
and .
The resulting branching fractions are
and
,
respectively.
4.2.3 Systematic uncertainties
Systematic errors for
include the following sources.
Uncertainty in the signal CB function used to fit the
spectrum is examined by varying and
within their errors:
the fitted yield varies by 0.7%.
The dominant BG comes from the continuum: its uncertainty
is evaluated to be 6.2%, while that of the others is negligible.
The uncertainties in the luminosity evaluation and
are 0.3% and 1.4%, respectively.
The value of
used in MC has a 0.4% error [17].
The uncertainty in the CB function yields a 0.5% contribution.
The total systematic uncertainty is consequently calculated to be
7.9%, by adding all of the above errors in quadrature.
As a result, we obtain the following branching fractions:
(9)
and
(10)
at the 90% CL.
4.3 decay
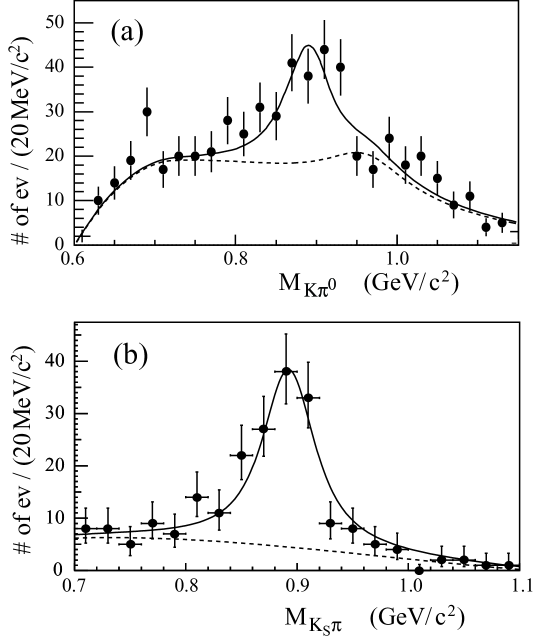
Figure 6:
(a) invariant mass distribution for
events and (b) the invariant mass distribution for
events. Data are fitted with a convoluted
Breit-Wigner function, and the best
fit is indicated by the solid
curve, while
the BG component is shown by the dashed curve.
The fits give events (a) and
(b), respectively.
The invariant mass spectra in both and decays are analyzed
to determine the content in the final state.
4.3.1 samples
To select , the signal is
identified with the criterion
,
and then the
invariant mass distribution is analyzed
(see Fig. 6 (a)).
The contribution of the combinatorial
BG under the peak is evaluated from
the sidebands with
and
.
The dashed curve in Fig. 6 (a)
indicates the BG component estimated from the above samples and from MC
that includes a decay with an .
A MC study indicates that the enhancement in the
higher mass region mostly
arises from events through misidentification
of , while
the dominant BG, mostly populating the lower mass region, is composed of
contributions from generic decays.
A clear signal over BG can be seen in
the spectrum shown in Fig. 6 (a).
The observed spectrum is fitted with a Breit-Wigner (BW)
function plus a BG component, where the former is convoluted with
a response function with a mass resolution of
= 13.5 MeV/c2.
The latter is fixed so as to reproduce the spectrum of
the sidebands.
The mass and width of the BW function are fixed to those of the
[17] in the fit.
The best-fit result is indicated by the solid curve in the figure, and
gives events with
a .
We examine the non-resonant contamination by
adding an additional term in the fit, assuming a phase-space
distribution with a weak interaction
for a hadronic final system.
The fit gives events and
events with a .
Since no significant difference between the two fits is found within
the errors, we here simply take the intermediate state to be purely
and the difference is taken into account as
the systematic uncertainty for the fitting function.
Even allowing for interference between the and non-resonant ,
the difference is found to be negligible.
No significant BG contribution is found in
generic decays, while events are estimated
from the MC.
The detection efficiency is evaluated from MC as ,
including the branching fractions for and
decays.
The systematic uncertainties in the evaluation of
are summarized in Table 2.
The dominant error arises from the uncertainty in the
fitting function discussed above. It amounts to 15%.
Other sources of systematic uncertainties are the same as those for
decay.
The total systematic uncertainty is 16.2%.
Thus we obtain the branching fraction
(11)
For the non-resonant decay,
we set an upper limit on its branching fraction
(12)
at the 90% CL, assuming a pure phase-space distribution
for the final hadronic system.
Table 2: Summary of the systematic uncertainties in
analysis (%).
decay mode
BG subtraction
2.0
Detection efficiency
- /lepton-id
2.2/ 2.5
/ 2.4
Tracking
1.3
3.3
2.0/ 2.0
/ 2.0
-veto
2.8
Stat. error of signal MC
1.7
0.7
0.1
Mass spectrum
0.5
0.5
Luminosity meas.
1.4
0.3
Fitting function
15.0
4.1
Total
16.2
6.4
4.3.2 samples
The distribution
is shown in Fig. 6(b) and is similar to the
case.
A clear signal can be seen over a small continuum BG.
Assuming no non-resonant contribution,
the distribution is fitted with a convoluted
BW function plus a BG, composed of a
third-order polynomial, applying the same method used
for the sample.
The yield of is events.
The BG is estimated to be
events from the continuum, and is subtracted
from the above yield.
We examine a possible non-resonant contribution, whose
mass spectrum is calculated by MC, assuming a pure hadronic phase-space
distribution with a weak interaction.
Including the non-resonant component, the best fit gives
events and events.
Therefore, we give results assuming no non-resonant background.
The detection efficiency is evaluated by MC as ,
which includes the relevant branching fractions:
, ,
and .
The systematic uncertainties are summarized in Table 2.
Their magnitudes are similar to those in the case,
except for the non-resonant contribution.
The total systematic uncertainty is 6.4.
Consequently, the branching fraction is
(13)
Two measurements using and
decays are in agreement, in accordance with isospin symmetry.
Therefore we combine the two results and obtain
Using a high statistics 450 million -pair data sample from Belle, we
have obtained the following branching fractions
for five different decay modes:
where the first and second errors are statistical and systematic,
respectively.
We also set the upper limits on the following decay modes at the 90% CL:
In Table 3, our results are compared to those previously
obtained by the CLEO [6, 7, 8] and
ALEPH [9] collaborations.
It is clearly seen that the precision of the measured values
has been considerably improved.
It is also noteworthy that the central values of our branching fractions
are in all modes lower than those of the other
experiments [6, 7, 8, 9].
This fact can be mostly attributed to the underestimation
of the BG contamination
in previous low statistics measurements.
For instance,
the BG estimation in the previous analyses relied on the MC.
However, this analysis evaluates the BG rate using
a enriched data sample.
Furthermore,
Ref. [7] ignored the BG
contribution, since they estimated it as BG, based on a theoretical
calculation that predicted its branching fraction to be
[3].
However, its rate is about 1% of the signal in our measurement, and
its branching fraction is
about five times as large.
Our high statistics allows us to reliably and precisely
scrutinize various BG contributions, while the previous measurements,
which had low statistics, did not have sufficient sensitivity to notice, or
correctly judge, the BG contamination.
Our results are compared with different theoretical calculations
in Table 4.
The branching fraction for decay
can be predicted by the isospin symmetry (CVC) using the experimental
results on
[5, 22].
Our branching fraction agrees with the predictions,
[5] and [22].
Pich [3], Braaten [23], Li [4] and
Aubrecht [24]
calculated the branching fractions of various decays
involving meson(s),
based on chiral perturbation theory, as listed in
Table 4.
Their results are in fair agreement with our measurements,
particularly taking into
account possible uncertainties in theoretical predictions.
Further detailed studies of the physical dynamics in decays
with mesons are required.
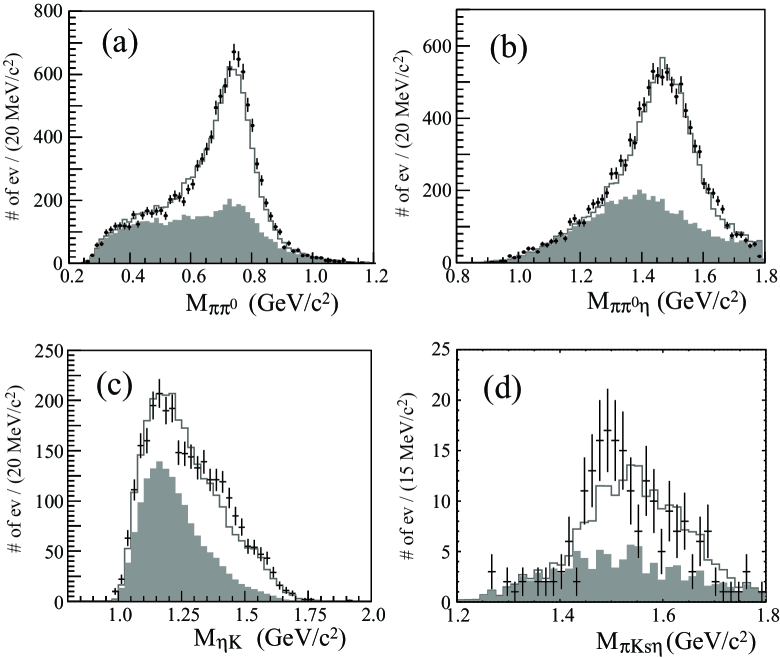
It should be mentioned that the TAUOLA MC
program [14] qualitatively reproduces our
hadronic mass distributions in ,
and decays,
as shown in Fig. 7.
Further analysis of the spectra including various phenomenological models
is in progress.
Figure 7: Invariant mass distributions of (a)
and (b) for decay,
(c) for and
(d) for ,
.
The points with error bars are the data.
The normal and filled histograms indicate the signal and BG
MC distributions, respectively.
The BG is strongly suppressed and negligible in our sample.
Acknowledgments
We thank the KEKB group for the excellent operation of the
accelerator, the KEK cryogenics group for the efficient
operation of the solenoid, and the KEK computer group and
the National Institute of Informatics for valuable computing
and SINET3 network support as well as Tau lepton physics research
center of Nagoya University. We acknowledge support from
the Ministry of Education, Culture, Sports, Science, and
Technology of Japan and the Japan Society for the Promotion
of Science; the Australian Research Council and the
Australian Department of Education, Science and Training;
the National Natural Science Foundation of China under
contract No. 10575109 and 10775142; the Department of
Science and Technology of India;
the BK21 program of the Ministry of Education of Korea,
the CHEP src program and Basic Research program (grant
No. R01-2008-000-10477-0) of the
Korea Science and Engineering Foundation;
the Polish State Committee for Scientific Research;
the Ministry of Education and Science of the Russian
Federation and the Russian Federal Agency for Atomic Energy;
the Slovenian Research Agency; the Swiss
National Science Foundation; the National Science Council
and the Ministry of Education of Taiwan; and the U.S. Department of Energy. This work is supported by
a Grant-in-Aid for Science Research on Priority Area (New
Development of Flavor Physics) from the Ministry of Education,
Culture, Sports, Science and Technology of Japan and Creative
Scientific Research (Evolution of Tau-lepton Physics) from the
Japan Society for the Promotion of Science.
References
[1] J. Wess and B. Zumino, Phys. Lett. B 37 (1971) 95.
[2] E. Witten, Nucl. Phys. B 223 (1983) 422.
[3] A. Pich, Phys. Lett. B 196 (1987) 561.
[4] B. A. Li, Phys. Rev. D 55 (1997) 1436.
[5] S. Eidelman and V. Ivanchenko, Phys. Lett. B 257 (1991) 437.
[6] CLEO Collaboration, M. Artuso et al.,
Phys. Rev. Lett. 69 (1992) 3278.
[7] CLEO Collaboration, J. Bartelt et al.,
Phys. Rev. Lett. 76 (1996) 4119.
[8] CLEO Collaboration, M. Bishai et al.,
Phys. Rev. Lett. 82 (1999) 281.
[9] ALEPH Collaboration, D. Buskulic et al., Z. Phys. C
74 (1997) 263.
[10]
S. Kurokawa and E. Kikutani, Nucl. Instr. and Meth. A 499 (2003) 1, and other papers included in this volume.
[11] Belle Collaboration, A. Abashian et al.,
Nucl. Instr. and Meth. A 479 (2002) 117.
[12] Z. Natkaniec et al. (Belle SVD2 Group),
Nucl. Instr. and Meth. A 560 (2006) 1.
[13] K. Hanagaki et al., Nucl. Instr. and Meth. A 485 (2002) 490;
A. Abashian et al., Nucl. Instr. and Meth. A 491 (2002) 69;
E. Nakano et al., Nucl. Instr. and Meth. A 494 (2002) 402.
[14] S. Jadach, B. F. L. Ward, Z. Wa̧s, Comp. Phys. Commun. 130 (2000) 260.
[15] D. J. Lange, Nucl. Instr. Meth. Phys. Res. Sect. A 462 (2001) 152.
[16] CERN Program Library Long Writeup No. W5013 1993.
[17] C. Amsler et al. (Particle Data Group),
Phys. Lett. B 667 (2008) 1.
[18] J. E. Gaiser, Ph.D. thesis, SLAC-R-255 (1982).
[19] CLEO Collaboration, A. Anastassov et al.,
Phys. Rev. Lett. 86 (2001) 4467.
[20]
The upper limit is estimated by following the method described in
Ref. [17] section 32.3.2.4.
[21] S. Banerjee et al., Phys. Rev. D 77 (2008) 054012.
[22] F. J. Gilman, Phys. Rev. D 35 (1987) 3541.
[23] E. Braaten, R. J. Oakes and S. M. Tse,
Phys. Rev. D 36 (1987) 2188.
[24] G. J. Aubrecht, N. Chahrouri and K. Slanec,
Phys. Rev. D 24 (1981) 1318.