2 Department of Physics and Astronomy, University of Southern California, Los Angeles,CA 90089-0484
3 Observatoire Astronomique de Lyon, 9 avenue Charles Andre, 69561 Saint Genis Laval Cedex, France
4 Institute of Cosmology and Gravitation, University of Portsmouth, Mercantile House, Hampshire Terrace, Portsmouth, PO1 2EG, UK
GalICS II: the [/Fe]-mass relation in elliptical galaxies
Abstract
Aims. We aim at reproducing the mass- and -[/Fe] relations in the stellar populations of early-type galaxies by means of a cosmologically motivated assembly history for the spheroids.
Methods. We implement a detailed treatment for the chemical evolution of H, He, O and Fe in GalICS, a semi-analytical model for galaxy formation which successfully reproduces basic low- and high-redshift galaxy properties. The contribution of supernovae (both type Ia and II) as well as low- and intermediate-mass stars to chemical feedback are taken into account. The model predictions are compared to the most recent observational results.
Results. We find that this chemically improved GalICS does not produce the observed mass- and -[/Fe] relations. The slope is too shallow and scatter too large, in particular in the low and intermediate mass range. The model shows significant improvement at the highest masses and velocity dispersions, where the predicted [/Fe] ratios are now marginally consistent with observed values. We show that this result comes from the implementation of AGN (plus halo) quenching of the star formation in massive haloes. A thorough exploration of the parameter space shows that the failure of reproducing the mass- and -[/Fe] relations can partly be attributed to the way in which star formation and feedback are currently modelled. The merger process is responsible for a part of the scatter. We suggest that the next generation of semi-analytical model should feature feedback (either stellar of from AGN) mechanisms linked to single galaxies and not only to the halo, especially in the low and intermediate mass range.
Conclusions. The integral star formation history of a single galaxy determines its final stellar [/Fe] as it might be expected from the results of closed box chemical evolution models. However, the presence of dry-mergers and metal recycling in the hot gas phase helps in keeping the element abundance in the stars at a super-solar level in a hierarchical galaxy formation scenario.
Key Words.:
galaxies: elliptical and lenticular, cD - galaxies: abundances - galaxies: formation1 Introduction
The Cold Dark Matter (CDM) scenario (Peebles, 1982) successfully explains the growth of the large scale structure of the universe (Springel, Frank & White 2006). Since the original application of this scenario to the galaxy formation process problem (Kauffmann & White, 1993, Cole et al 1994), however, several modifications to the pure hierarchical assembly of the building blocks had to be introduced in order to deal with the complexity of baryonic physics. Among the main open issues, we mention the anti-hierarchical behaviour of the AGNs (e.g. Hasinger et al. 2005), the evolution of luminosity function with red-shift (e.g. Bundy et al. 2005) as well as the increase of mean stellar [/Fe] with galaxy mass (or ) in elliptical galaxies (e.g., Worthey et al 1992; Trager et al 2000; Thomas et al 2005, Nelan et al. 2005).This relationship together with the old inferred ages implies that more massive ellipticals formed earlier and faster with respect to smaller objects (Matteucci 1994; Thomas et al. 2005). In the following we will refer to the above observational constraints with the term downsizing (Cowie et al. 1996).
Thomas (1999) was the first to study the chemical enrichment of and Fe-peak elements in the framework of hierarchical models of galaxy formation. In a very simplistic approach, Thomas (1999)ran chemical evolution simulations over the star formation histories predicted by Kauffmann (1996) neglecting the complex merger history of the galaxies. It turned out that the predicted star formation histories of massive elliptical galaxies were to extended to produce /Fe consistent with observations. This conclusion was later reinforced by Nagashima et al. (2005), who included a self-consistent treatment of chemical enrichment in semi-analytic galaxy formation models, and by Pipino & Matteucci (2006, PM06).
More recently, a plethora of new models have been presented to address the general phenomenon of downsizing (e.g. Croton et al 2006, De Lucia et al. 2006, Bower et al 2006, Cattaneo et al., 2005, Sommerville et al. 2008, Kaviraj et al. 2005, Fontanot et al., 2007). The new key ingredient in these models is feedback from super-massive black holes, which is used to suppress residual star formation at late times in the evolution of massive galaxies (Granato et al. 2004). Such a suggested scenario seems to be supported by observations (e.g. Nesvadba et al. 2006). In practice, the mass assembly still occurs at late times in these models , whereas most of the stars have been formed at high red-shift in small sub-units (but see Cimatti et al. 2006). The preferred mechanism for the assembly of massive spheroids is a sequence of dissipation-less (dry) mergers. This leads generally to better agreement with the observed downsizing pattern.
However, the [/Fe]-mass relation has not been studied in these new generation models (see Pipino & Matteucci 2008, PM08). The aim of this paper is to fill this gap. To this end we implement a fully self-consistent treatment of the chemical evolution, which includes a robust estimate of the type Ia supernova rate and of the Fe production into GalICS (Hatton et al., 2003; Paper I hereafter), a state-of-the-art semi-analytical model for galaxy formation and evolution based on a CDM-driven growth of the structures. The main goal is to check model predictions against the latest observational results for the -mass relation and the mass-metallicity relation (MMR, e.g. Carollo et al. 1993), that so far could be simultaneously accounted for only by revised monolithic models (Pipino & Matteucci, 2004, PM04). The new results will be then interpreted in the light of our previous work with the chemical evolution models (Thomas 1999, PM04, PM06, PM08).
The structure of the paper is as follows: the main improvements with respect to Paper I are spread out in Sec.2; in Sec.3 the chemical evolution scheme is tested against the Milky Way and the local SNIa rate. In Sec. 4, 5 and 6 the results are presented and discussed, respectively.
2 The model
2.1 The GalICS galaxy formation model
GalICS is a model of hierarchical galaxy formation which combines high resolution cosmological N-body simulations to describe the dark matter content of the Universe with semi-analytic prescriptions to follow the physics of the baryonic matter. GalICS has been thoroughly presented in Paper I, which we refer the reader to for a detailed discussion of the model assumptions and properties. It has already been used for the study of the colour-magnitude relation and the progenitor bias of elliptical galaxies (Kaviraj et al. 2005), the reproduction of the Galex NUV-optical colours (Kaviraj et al. 2007) and the black-hole mass - relation (Cattaneo et al 2005). It has also been used to explore the consequences the halo-quenching mechanism (Keres et al. 2005) by Cattaneo et al. (2008 and references therein). The above mentioned papers represent a comprehensive set of benchmark tests that we will not repeat here, but simply point out that results are preserved to a large extent in our present implementation.
We briefly recall the specifications of cosmological N-body simulation used to construct the halo merger trees. This simulation is a realization of flat cold dark matter universe with a cosmological constant of . The simulated volume is a cube of side Mpc, with , which contains particles of mass M⊙ each, the cold dark matter power spectrum was normalised in agreement with the present day abundance of rich clusters (). One should bear in mind that the dark matter simulation cannot resolve haloes less massive than , which implies that a galaxy less massive than is formally below the resolution limit. The spatial resolution, instead, is such that we cannot resolve scales below 30 kpc.
As hot gas cools and falls to the centre of its dark matter halo, it settles in a rotationally supported disc. According to Paper I, if the specific angular momentum of the accreted gas is conserved and starts off with the specific angular momentum of the dark matter halo, we assume it forms an exponential disc with scale length given by:
| (1) |
Galaxies remain pure discs if their disc is globally stable (i.e. where is the circular velocity of the disk-bulge-halo system ; see e.g. van den Bosh et al 1998), and they do not undergo a merger with another galaxy. In the case where the latter of these two events occurs, we employ a recipe to distribute the stars and gas in the galaxy between three components in the resulting, post-merger galaxy, that is the disc, the bulge, and a star-burst (see Paper I). In the case of a disc instability, we simply transfer the mass of gas and stars necessary to make the disc stable to the burst component, and compute the properties of the bulge/burst in a similar fashion as that described in Paper I. Bulges are assumed to have a density profile given by Hernquist (1990). The bulges are assumed to be pressure supported with a characteristic velocity dispersion , computed at their half-mass radius.
Galaxy morphology in the model is determined by the ratio of the B-band luminosities of the disc and bulge components. A morphology index is defined as
| (2) |
such that a pure disc has and a pure bulge has . Following Baugh et al (1996), ellipticals have , S0s have and spirals have . This simple prescription is clearly incapable of capturing the complex spectrum of real galaxy morphologies. Therefore, in what follows, ‘spirals’ refer to all systems which do not have a dominant spheroidal (bulge) component. Observationally, this includes not only systems with distinctive spiral morphologies, but also peculiar or irregular systems.
2.2 The chemical evolution
The main novelty of the present versions of GalICS is the implementation of a self-consistent treatment of the chemical evolution with finite stellar lifetimes and both type Ia and type II supernovae ejecta. In practice, we follow the chemical evolution of only four elements, namely H, He, O and Fe. This set of elements is good enough to characterise our simulated elliptical galaxy from the chemical evolution point of view as well as small enough in order to minimise computational resources. In fact, as shown by the time-delay model (Matteucci & Greggio, 1986), the [/Fe] ratio is a powerful estimator of the duration of the SF. Moreover, both the predicted [Fe/H]-mass and [Z/H]-mass relationships in the stars can be tested against the observed Colour-Magnitude Relations (hereafter CMRs; e.g. Bower et al. 1992, Kaviraj et al 2005) and MMR. In order to clarify this point, we recall that the O is the major contributor to the total metallicity, therefore its abundance is a good tracer of the metal abundance Z. Moreover, in this paper we focus on the theoretical evolution of the elements, and the O is by far the most important. On the other hand, the Fe abundance is probably the most commonly used probe of the metal content in stars, therefore it enables a quick comparison between our model predictions and the existing literature.
In the following [/Fe] ratio will always refer to the luminosity-weighted average over the stellar populations that make a galaxy, unless stated otherwise. This value guarantees a robust comparison with its observational counterpart, namely to the “SSP-equivalent” value inferred from the integrated spectra of elliptical galaxies. We refer to Pipino et al. (2006) for details and caveats on the use of“SSP-equivalent” abundances and abundance ratios as proxies for the mean properties of a composite stellar populations like an elliptical galaxy.
The star formation rate in the disc is
| (3) |
Here is the mass of the gas in the disc (all the gas in the disc is cold and all the gas in the halo is hot) and is the dynamical time (the time to complete a half rotation at the disc half mass radius). The parameter , which determines the efficiency of star formation has a fiducial value of (Guiderdoni et al 1998).
A Salpeter (1955) initial mass function (IMF) constant in time in the range is assumed, since PM04 showed that the majority of the photochemical properties of an elliptical galaxy can be reproduced with this choice for the IMF. We adopted the yields from Iwamoto et al. (1999, and references therein) for both SNIa and SNII. The SNIa rate for a SSP formed at a given radius is calculated assuming the single degenerate scenario and the Matteucci & Recchi (2001) Delay Time Distribution (DTD). The convolution of this DTD with (see Greggio 2005) gives the total SNIa rate, according to the following equation:
| (4) |
where is the fraction of binary systems which give rise to Type Ia SNe. Here we will assume it constant (see Matteucci et al. 2006 for a more detailed discussion). The time is the delay time defined in the range so that:
| (5) |
where is the minimum delay time for the occurrence of Type Ia SNe, in other words the time at which the first SNe Ia start occurring. We assume, for this new formulation of the SNIa rate that is the lifetime of a 8 star, while for , which is the maximum delay time, we assume the lifetime of a star. Finally, is the number of stars per unit mass in a stellar generation and contains the IMF. The detailed treatment of SNIa is a substantial improvement with respect to Paper I.
Stars are evolved between time-steps using a sub-stepping of at least 1 Myr. During each sub-step, stars release mass and energy into the interstellar medium. In GalICS, the enriched material released in the late stages of stellar evolution is mixed to the cold phase, while the energy released from supernovae is used to re-heat the cold gas and return it to the hot phase in halo. The re-heated gas can also be ejected from the halo if the potential is shallow enough (see also Paper I). The rate of mass loss in the supernova-driven wind that flows out of the disc is directly proportional to the supernova rate.
The original formula for the chemical processing of the total metal content (see Paper I) has been extended to the elemental species we deal with, so that the ejecta in the gas mass from the stellar population are:
| (6) |
where is the mass of a star having lifetime , is the mass of the remnant left after the star has died, and is the IMF. The first term on the right hand side represents the re-introduction of the metals that were originally in the stars when they formed, and is the fraction of the initial stellar mass transformed via stellar nucleosynthesis into the element . Throughout this work, we assume chemical homogeneity (instantaneous mixing), such that outflows caused by feedback processes are assumed to have the same metallicity as the inter-stellar medium, though in reality the material in the outflow is likely to be metal-enhanced (see Sec 6.3).
2.3 Galaxy evolution and properties
The fundamental assumption is that all galaxies are born as discs at the centre of a dark matter halo. The transformation of disc stars into bulge stars and of disc gas into star-bursting gas is due to bar instabilities and mergers. Gas is never added to bulges directly and the only gas in bulges is that coming from stellar mass loss. The star-bursting gas forms a young stellar population that becomes part of the bulge stellar population when the stars have reached an age of 100 Myr. We do not readjust the bulge radius when this happens. The disc has an exponential profile, while the bulge and the star-burst are described by a Hernquist (1990) density distribution. The star-burst scale is with .
The star formation law (Eq. 3) has the same form and uses the same efficiency parameter for all three components when we redefine as the mass of the gas in the component and as the dynamical time of the component. For the components described by a Hernquist profile, the dynamical time is , where is the half mass radius and is the velocity dispersion at the half mass radius.
The fraction of the disc mass transferred to the spheroidal component (the bulge and the star-burst) depends on the mass ratio of the merging galaxies. The separation between a minor and a major merger is for a mass ratio of 1:3.
GalICS cannot spatially resolve galaxies, therefore we can only predict chemical properties averaged over the galactic radius.
2.4 Energetics
The SNII feedback is given by:
| (7) |
where is the efficiency of the supernova-triggered wind which is proportional to and depends both on the porosity of the ISM (see Silk 2001 for details) and the mass–loading factor. This latter accounts for entrainment of interstellar gas by the wind and can be considered as a free parameter whose value is around 10. Note that in the previous equation, is the number of supernovae per unit star-forming mass, which is a prediction of the Initial Mass Function (IMF) chosen, and is the energy of a supernova, assumed to be .
At variance with chemical evolution models as PM04, where the total Ia+II SNe feedback is sufficient to halt the SF, Paper I relies onto the observed correlation between AGN and velocity dispersion (Ferrarese & Merrit, 2000), and simply prevents gas from cooling in a halo which as a mass above the critical value of M⊙ to quench cold gas accretion (Granato et al. 2004). A further halo-quenching mechanism has been implemented into GalICS by Cattaneo et al. (2008), who showed how this further refinement leads to a better agreement between our model predictions and SDSS observations of the luminosity function and the colour bimodality (Baldry et al. 2004).
3 Calibration of the model
3.1 Comparison to the Milky Way
To provide a consistency check for our model, we adopt a procedure typical of chemical evolution studies. We first compare MW-like galaxies in our simulations with the known properties of our galaxy. Since many properties of such galaxies have already been tested in the calibration of Paper I, here we use the same selection criteria of MW-like galaxies (namely and requiring that the galaxy have spiral morphology) and we show only chemical evolution predictions. We found that 3% of the spiral population is made by MW-like objects in agreement with Paper I statistics.
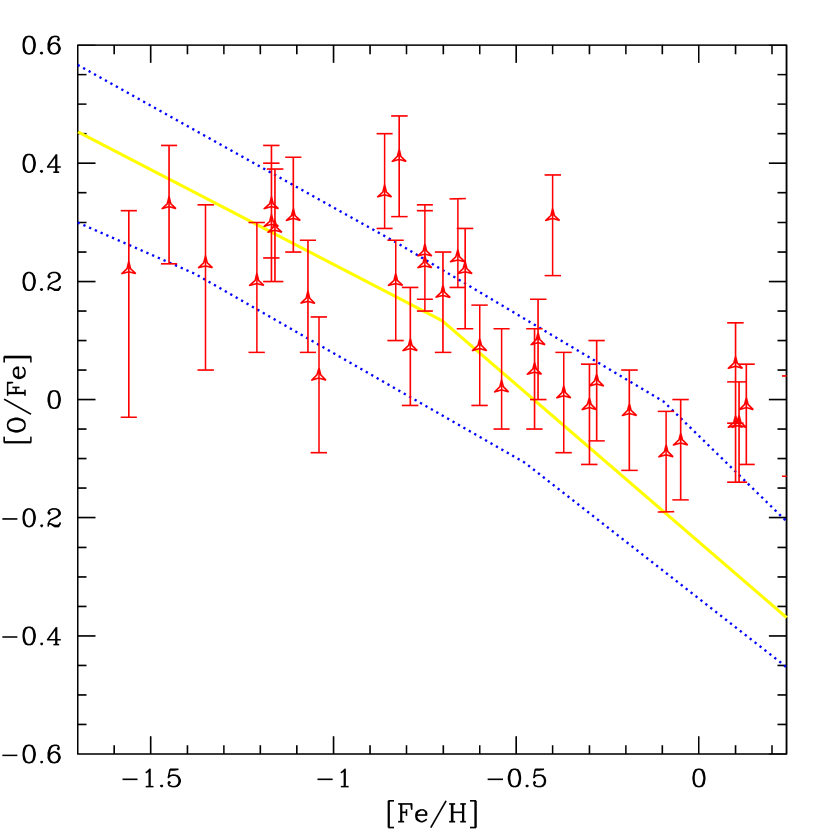
In Fig. 1 we plot [O/Fe] ratio as a function of [Fe/H] in the stars of the MW-like spirals predicted by GalICS. The dotted lines give the distribution of stars formed out of gas with a given chemical pattern (i.e. a given [] and []) as a 3 contour in the []-[] plane, whereas the thick solid line give the median trend. The agreement with the overall trend observed in our own Galaxy makes us confident that the model is correctly calibrated. Unfortunately, due to the metallicity resolution (five bins in total metallicity Z, namely 0.001,0.004,0.008,0.02 and 0.04) of the code and to the fact that galaxies are identified only once their host DM haloes are quite massive (), we cannot explore the region at . We plan to use higher mass resolution simulations in future work, but for sake of comparison with Paper I we restrict our analysis to the same simulation that was used in Hatton et al. (2003).
3.2 Present-day SNIa rate
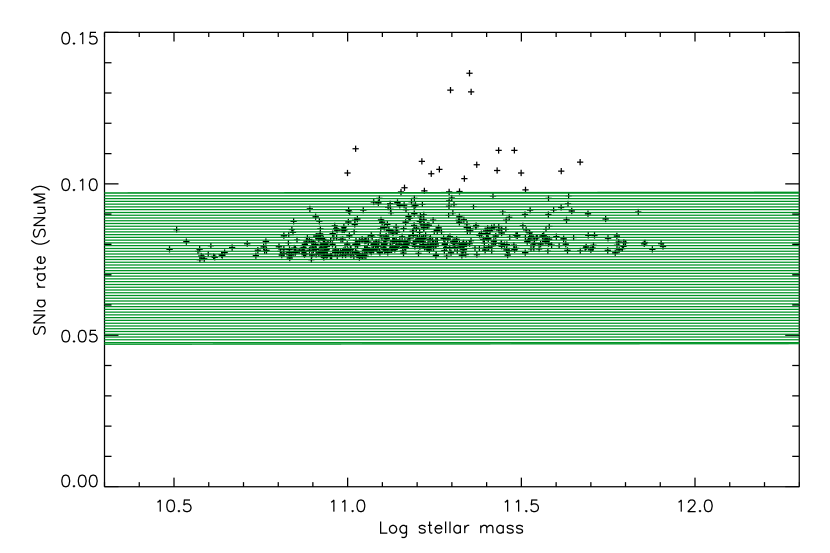
We then verify that the model galaxies predict a present-day morphology dependent SNIa rate in agreement with observations. The MW-like spirals presented above exhibit a SNIa rate of 0.09 SNuM (i.e. specific SN explosion rate in units of of stars per century). which is in fair agreement with the observational estimates ( for S0a/b and for Sbc/d, respectively, see Mannucci et al. 2008) given the fact the GalICS does not allow a finer morphological classification. As shown in Fig. 2 the vast majority of our simulated ellipticals exhibit a present-day SNIa rate within 1 from the observational mean value given by Mannucci et al. (2008). This test basically guarantees that, given the star formation history of the model galaxies, we have calibrated the uncertainties in the progenitor nature and delay time distribution of SNIa which are incorporated in the parameter (see Eq. 2). In particular, in order to reproduce the present-day observed SNIa rate we assume which is the value typically adopted in chemical evolution models of the Milky Way (see Matteucci et al. 2006). As a result the Fe production rate from SNIa is also calibrated.
4 The - and mass-[/Fe] relations
4.1 The standard GalICS model
From this section onwards we deal with the mean novelty of the present work, namely the study of the predicted -mass relation and its comparison to the observations. To be consistent with observed values we present luminosity-weighted values which take into account the disc component (if any). We stress, however, that the mass-weighted quantities do not differ much from the luminosity-weighted ones especially at the high mass end of the sample, where SF has been suppressed at high redshift. At variance with our previous work (PM04, PM06, PM08) on the -enhancement in the very central part of the galaxies, here we present our predictions on the [/Fe] ratio in the whole galaxy (we recall that GalICS’s spatial resolution is larger than typical galactic effective radii) and consistently compare them to the recent observational estimates by Thomas et al. (2008) which pertain to the entire galaxies.
We also recall that observations suggest that the observed radial gradient slope in the [/Fe] has, on average, a null value (e.g. Mehlert et al. 2003). As shown by Pipino, D’Ercole & Matteucci (2008a), in fact, even though the observed gradients (Carollo et al. 1993, Davies et al. 1993) suggest that most ellipticals form outside-in, the expected strong and positive [/Fe] gradient can be affected by the metal rich gaseous flows inside the galaxy acting together with the SFR. The net result is a gradient in the [/Fe] ratio nearly flat. Hence, we can safely neglect the presence of gradients in our study. Instead, they might affect the MMR (see discussion in Sec. 5)
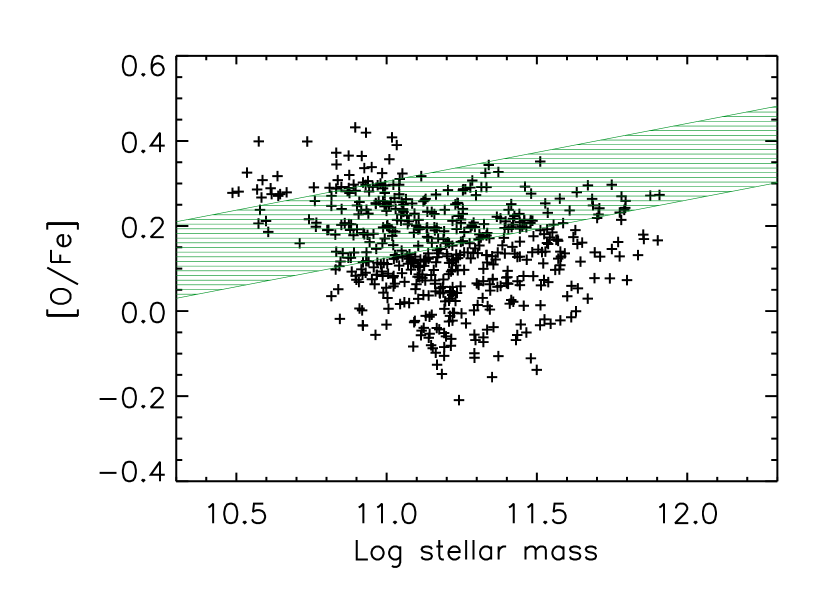
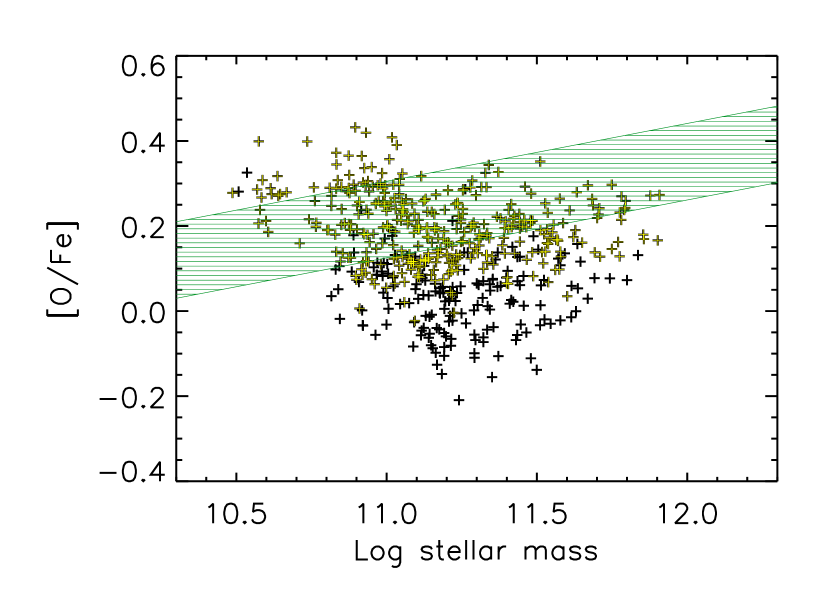
The results for our fiducial GalICS version are presented in Fig. 3. In agreement with Nagashima et al. (2005), the ratios do not show any correlation with mass (Fig. 3, top panel), in strong contrast with the clear positive correlation derived observationally. The simulations seem to produce decreasing [/Fe] ratios with increasing galaxy mass, with a slight upturn at the high-mass end. As a result the scatter is large. A linear fit of the simulation results in the [/Fe]-mass plane would give a flat relationship. It is interesting to note that this result does not depend on the environment in the sense that, if we restrict the regression analysis to a sub-sample of galaxies living in haloes whose mass is comparable to rich cluster of galaxies, we do not notice substantial changes in the predicted relationships.
We notice that the most massive galaxies attain a typical level of -enhancement that is only 1 off the value suggested by the observations. This is an improvements with respect to previous results and mainly caused by the implementation of AGN feedback (see Discussion). There are two possible formation paths for these objects: i) either these galaxies assemble through dry (gas-poor) mergers or ii) assemble most of their mass over very short time-scales (less than 0.5 Gyr). Indeed, this ensures that the pollution from SNIa is kept at a low level and, hence, that they maintain an over-solar [/Fe] ratio in their stars. However, as showed by Pipino & Matteucci (2008), low-mass and highly -enhanced galaxies are needed if one wants to create the most massive spheroids with a suitable enhancement by means of dry-mergers. GalICS then predicts that a small number of them, with masses should survive down to redshift zero. Unfortunately such galaxies are not observed. In a sense one could turn the argument around and say that a robust prediction of semi-analytic models of hierarchical galaxy formation is the presence of low-mass, highly [/Fe]-enhanced galaxies at high redshift because it is the only way in these models to build local massive ellipticals with the observed [/Fe] ratios. We know from observations that such objects do not seem to exist at moderately high redshifts around (Ziegler et al. 2005)
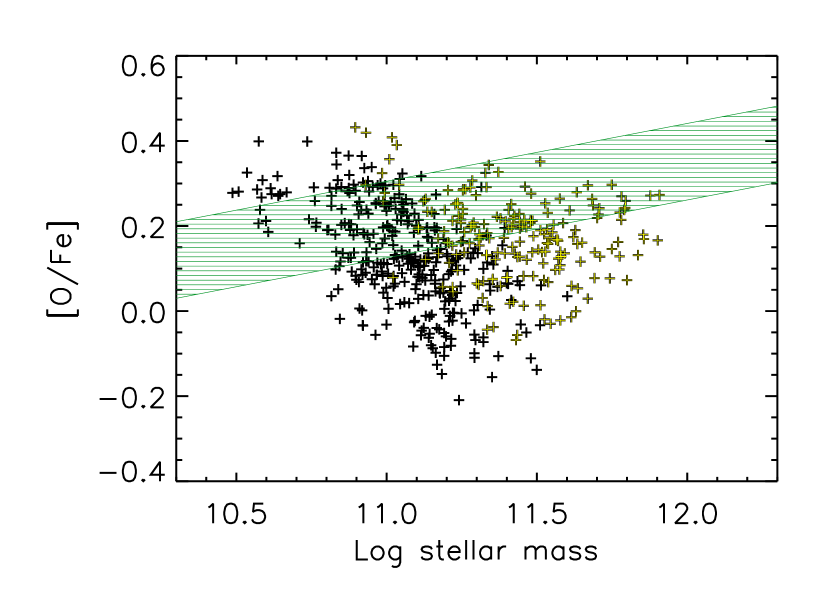
If we consider the subsample of galaxies whose luminosity-weighted ages are larger than 10 Gyr (lighter points in fig. 4) we notice that the galaxies populating the region below the observed area in the [/Fe]-mass plane disappear.
We attribute this to the fact that these galaxies live in the centre of massive haloes where both the original AGN feedback implemented in GalICS and the halo-quenching mechanism (Cattaneo et al. 2008) halted the cooling in the gas a long time ago. This finding confirms the interpretation of the [/Fe] ratios below the observed range as being related to a too long duration of the star formation, as we will discuss later in the paper. However, there has been some improvement in the agreement with observations with respect to previous models.
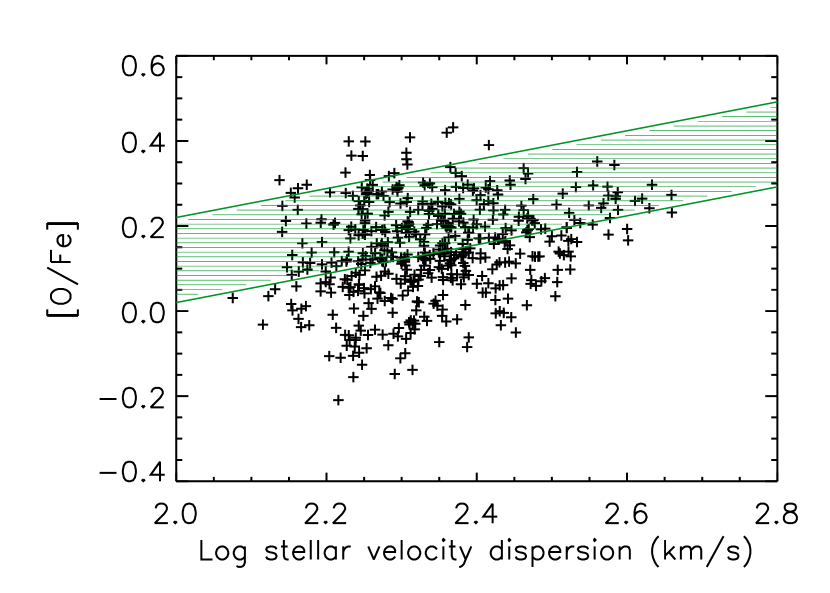
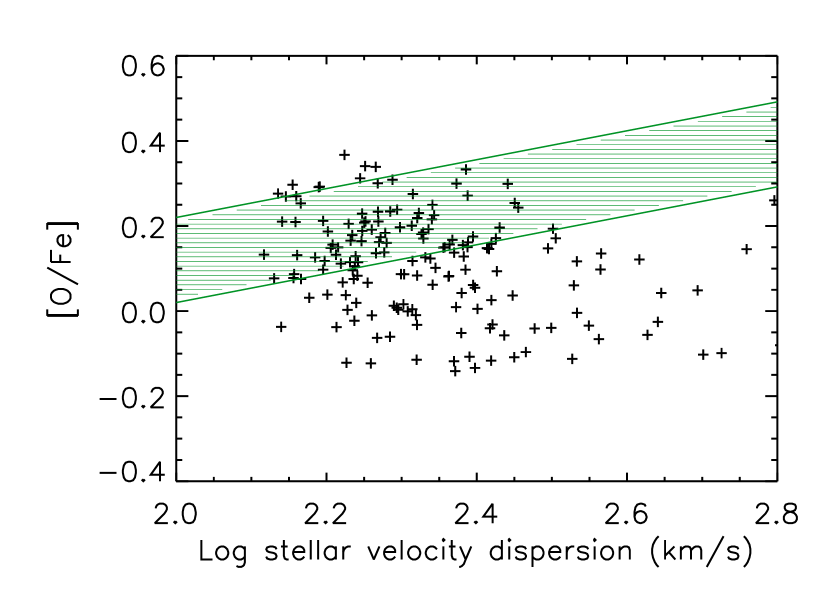
Similar results are obtained when plotting the [/Fe] as a function of the stellar velocity dispersion (fig. 3, bottom panel). Comparing the two panels in fig. 3, we notice that the scatter is somehow reduced and that the galaxies follow a trend which is closer to the observational results. We can understand this as we expect the velocity dispersion to be more correlated with the properties of the DM host haloes, whereas the baryonic mass is more sensitive to our modelling of feedback processes. However, one should bear in mind that GalICS assumes virialization and a fixed density profile (see Paper I) to calculate . Whilst this assumptions are reasonable at z=0, they very likely should be revised at high redshifts.
Moreover, we should note that the scatter is still much larger than the observed one and that, for a given velocity dispersion, the model galaxies tend to have on average a lower ratio than the observed ones. The latter problem can be handled in several ways (stellar yields, IMF, feedback, SF efficiency, see Sec. 6 for details), whereas the former is intrinsic to the model, being linked to the stochastic nature of the merger process where errors in the estimate of individual SF histories add up as galaxies merge together.
In order to better understand the origin of this scatter, we now focus on few selected galaxies with the same mass, but very different [O/Fe] and we study their star formation histories. We perform this exercise for two masses: i) typical ellipticals of ; ii) massive ellipticals of .
4.2 Typical ellipticals

We start the analysis in the mass range, where most of the predicted galaxies scatter outside of region of the observed values. A useful test bench for understanding the behaviour of such galaxies is provided by running chemical evolution models with the same stellar yields, IMF and the same integral star formation rate as the selected semi-analytic galaxies.
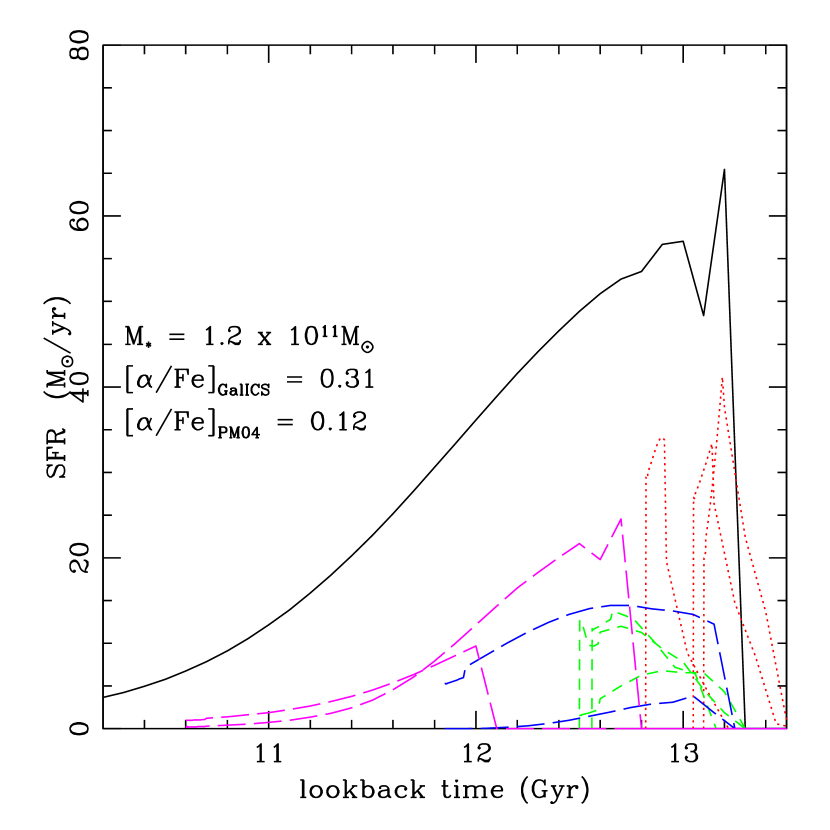
Indeed when we force the SFH pictured in Fig. 5 (solid line) to happen in a standard chemical evolution model (PM04), the predicted [O/Fe] is lower by 0.2 dex than that obtained with GalICS. This brings the galaxy from a value of [/Fe]=0.31 down to a value of [/Fe]=0.12 which is within the range of the observed values.
On the other hand, for the SFH presented in Fig. 6 we have an -depletion with GalICS, which does not occur in PM04. Once again this change is enough to bring the galaxy back within the range of observed values.
The difference here is that the galaxy whose SFH is portrayed in Fig. 5 has 9 progenitors with 4 of them merging very early on (i.e. at ), and which is passively evolving from red-shift 2. Looking at Fig. 5 (dashed and dotted lines) we see that all the progenitors of this galaxy actually have individual SF time-scales which are shorter than the one that would be inferred from the mass-weighted SFH of the galaxy itself. This explains why the [/Fe] ratio calculated by GalICS is higher than the one derived by a pure chemical evolution model of a single object with the same mass-weighted SFH. This is a systematic trend of hierarchical galaxy formation when compared to pure chemical evolution models as is shown also in Figs. 8 and 9 for massive ellipticals. On the other hand, in the case of fig. 6, we have only one progenitor which explains why the [/Fe] ratios of GalICS and the pure chemical evolution model are in good agreement. Looking at statistics with the help of Fig. 7 the latter case (black points) represents 42% of the total number of elliptical galaxies and it is biased towards lower mass as we would expect since massive ellipticals are built by multiple mergers in the hierarchical galaxy formation scenario (lighter points in Fig. 7 indicate galaxies which experienced at least two mergers.). One might be worried that these results depend on the mass resolution of the N-body simulation, however as stated earlier in the paper our mass resolution is such that galaxies more massive than are resolved and this mass is about a factor of 10 lower than the mass of ellipticals considered in our analysis. This means that increasing the resolution would only change the number of minor mergers (except, of course, in the very early stages of the formation of these galaxies).
4.3 Massive ellipticals


If we analyse the most massive galaxies, we confirm the findings of the previous section (see figs. 8- 9).
In general, despite the quite high -enhancement, the integral star formation history appears to be broader than the one obtained by means of a monolithic collapse model which would predict the same [/Fe] ratio. To better explain this point, let us think to the ideal case in which we have two progenitors with the same masses, same star formation histories (such that their final [/Fe] is appropriate for their mass), but say also that their peak in the star formation rate is shifted by about 1 Gyr (one is younger than the other and this difference in age cannot be detected with the standard line-strength indices technique if this objects are more than 10 Gyr old). Let us also assume that these two galaxies coalesce via a dry merger later in their evolution. The final object still has the same [/Fe] of the progenitors, its mass in only doubled (therefore it still matches the observations, given the spread in the -mass relation, see PM08), but the integral star formation history will look like the one in Fig. 8, thus broader than the 0.5-0.7 Gyr expected by PM04 (their model II).
We also note that in GalICS, the galaxies do not evolve as closed box. They instead exchange metals with the surrounding hot halo as well as stars can be created in discs and the moved to bulges because of instabilities. Such processes, render the interpretation of the final [/Fe] ratio on the basis of the SFH alone much more complicated.
Finally, a stacked specific (i.e. per unit stellar mass) SFH for galaxies in different mass bins has already been presented by Cattaneo et al. (2008) and we do not repeat the analysis here. With the help of the SFH presented in this section, however, we explained why the average duration of the SF is a factor of 3-5 longer (and consequently the peak value is at a factor of 3-5 lower) than what is required from pure chemical evolution studies on line-strength indices analysis to reproduce the [/Fe] in massive ellipticals.
5 The mass-metallicity relation and ages of the galaxies in the standard model
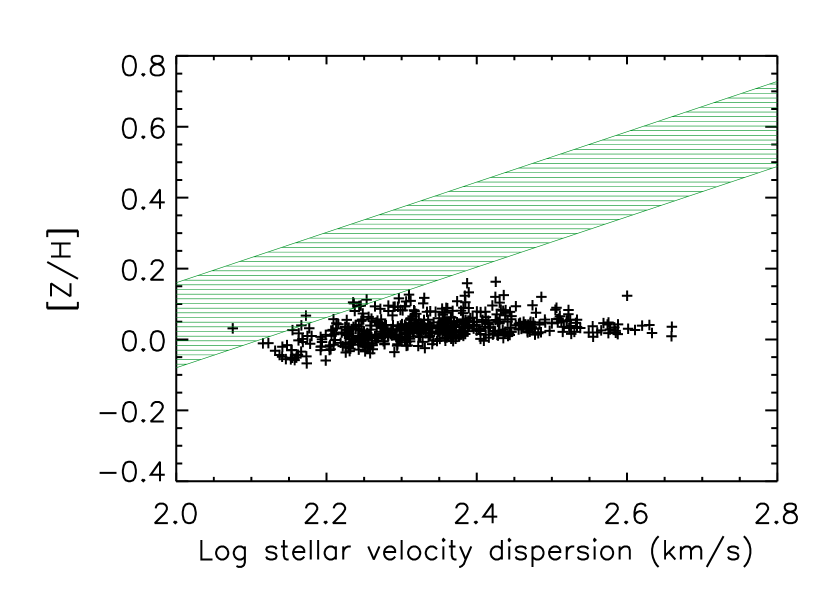
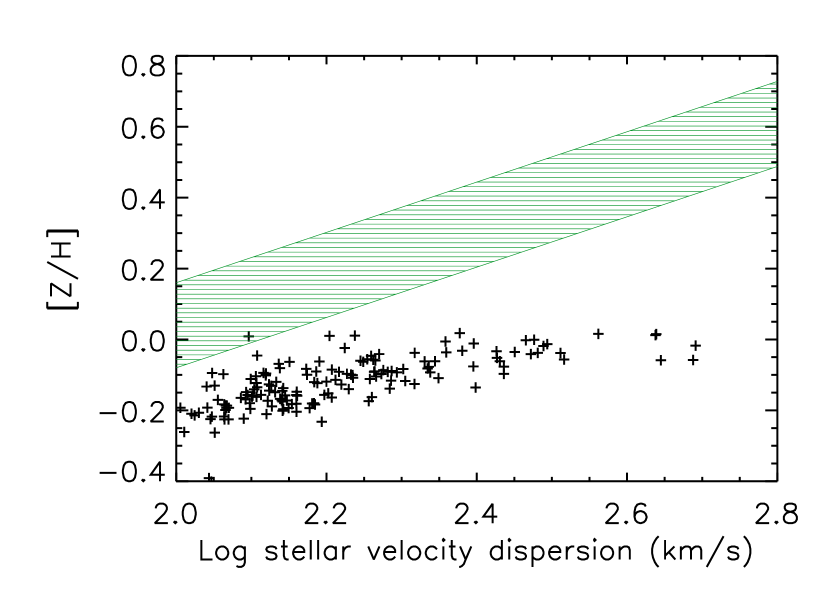
In fig. 10 we show the predicted MMR relation against the data by Thomas et al. (2008). We note that the predicted flat behaviour is unaffected by the cuts in either mass or age as done in the Sec. 4.
A failure in reproducing the MMR is expected on the basis of the preliminary analysis by PM08 who showed that the diagnostic power of the MMR and -mass relation relies in the fact that the mechanisms required to satisfy the former tend to worsen the agreement with the latter, and vice-versa. Only when most of the star formation process and the galactic assembly occur at roughly the same time and the same place both relations can be fulfilled. In the past, in fact, models were mainly aimed in reproducing the MMR, rather than the downsizing trend, therefore they failed in the -mass relation.
However, elliptical galaxies do exhibit quite strong (i.e. -0.3 dex per decade in radius) [Z/H] and [Fe/H] gradients within one effective radius (e.g. Carollo et al., 1993; Davies et al 1993). Therefore it is difficult to make a thorough comparison between our predictions and observations. In practice, given the fixed aperture set by the SDSS fiber size, it is likely that smaller galaxies contributed with most of their light, whereas only the central regions (more metal rich) are observed in bigger galaxies, thus biasing the observed slope of the MMR towards steeper values than the reality. However, a MMR does exist for the central regions of elliptical galaxies (e.g. Thomas et al. 2005) with quite a similar slope to the one holding for the entire galaxies. Therefore, the disagreement with the observed MMR at high masses cannot entirely explained by the fact that the GalICS spatial resolution is not enough to take the aperture effects into account. We recall that, as shown by Pipino et al. (2008a, see also Sec. 2.3), this is not a problem for [/Fe] ratios in the stars, because of the interplay between internal metal flows and the star formation efficiency, which keep the [/Fe] gradient flat.
We do not show predictions on the age-mass and colour magnitude relation. We refer the reader to Cattaneo et al. (2008) and Kaviraj et al. (2005) who show a remarkable agreement of the predictions made be means of GalICS and the latest observational results. We only note that the predicted scatter in the predicted MMR and (SSP-equivalent) age-mass relationships is comparable to the intrinsic scatter derived by Thomas et al. (2005, 2008). On the other hand, the scatter in the -mass relation is about twice as big.
6 Discussion


In the previous sections we showed the sensitivity of the [/Fe] to the integral star formation history of the galaxy and estimated the offset in the predicted value with respect to pure monolithic formation. Moreover, we studied the scatter in the predicted [/Fe]-mass relation in different mass ranges in order to understand the reasons for the persisting disagreement with observations. In this section we further discuss this issue and try to find viable solutions to address it.
Interestingly, according to fig. 11, on average the final [/Fe] ratio seems to be independent from the the total number of mergers (top panel) as well as from the number of major mergers (bottom panel). Moreover such a relationship also holds if we consider the number of either dry or wet mergers, and it is independent from the merger classification111Since gas is always present in the model galaxies, we tested three wet merger definitions - namely when the total mass in gas divided the total baryon mass of a newly formed galaxy exceed 0.01, 0.05 and 0.1 - and we did not find substantial difference among them. Note that dry-mergers are then defined by subtracting the number of wet mergers to the total for a given galaxy.. The model predicts a lot of ’monolithically’ (i.e. 0 mergers) behaving galaxies which exhibit a large scatter in the final [/Fe] ratio. A closer inspection tell us that this fact has several reasons:
-
i:
Galaxies which evolve from disc to bulge morphology through instabilities at late times.
-
ii:
Galaxies in environments where the AGN-quenching threshold occurs too late. These galaxies (along with those of case ) populate the [/Fe]-mass plane at values lower than the observed ones. In this case a better treatment of the feedback at galactic scales, possibly including (SNIa-driven) winds, might represent a solution.
-
iii:
Galaxies in environments where the AGN-quenching threshold occurs too early (these galaxies populate the [/Fe]-mass plane at values higher than the observed ones). This issue seems to be common to other models of galaxy formation (Kimm et al., 2008). Since these galaxies are satellite of massive haloes, one interesting (but probably not unique) possibility is to have them accrete some fresh gas over a long time-scale to keep SF going and, therefore, decrease the [/Fe] ratio.
There is a trend such that galaxies with more than mergers in their formation histories always have relatively high /Fe ratios. As the most massive galaxies are those which underwent the highest number of both total and wet mergers in their lifetime, these objects display relatively high /Fe ratios and old ages. If we select again the galaxies with SSP-weighted age larger than 10 Gyr, we find that all the galaxies with a number of mergers larger than 7 belong to this category. (Not) surprisingly they are also the most massive (stellar masses larger than ). To be more precise, we now make use of the epoch of the actual birth (defined as the time at which the galaxy is first spotted by GalICS) of the galaxy, rather than the SSP-weighted age. Fig. 12 makes clear that the higher the redshift of the final assembly (estimated as the time at which the last merger occurs), the higher the final [/Fe] ratio, as expected from the linear regression analysis on the predicted -mass relation presented earlier. The majority of galaxies with a number of mergers in their lifetime lower than 4 (2) have formation epoch larger than 1 (2) Gyr, and have mostly stellar masses smaller than 2 (1) . A confirmation of these findings comes from the pure chemical evolution study on gaseous mergers by PM06. They found that if a star-burst triggered by a significant accretion of pristine gas (comparable with the mass of stars already formed - roughly similar to a major wet merger in a galaxy formation picture) occurred at a significantly high redshift and just after the main burst of SF, the present day photo-chemical properties of the final elliptical galaxy match the observed ones. Star-burst triggered at very low-redshift, instead, implied very low predicted final [/Fe] ratios, even if the gas mass involved in the second burst was much lower than the one converted into stars during the main burst.
In conclusion, for the most massive spheroids, the interplay between the peak in the merger rate and the subsequent AGN quenching of the star formation act together in such a way that most of the star formation process and the galactic assembly occur at roughly the same time and the same place, thus mimicking a sort of “monolithic” behaviour. In other words, even though the duration of the star formation would lead to quite low [/Fe] ratios from the point of view of a pure chemical evolution model, the fact that it had happened in several sub-units makes the final [/Fe] ratios higher and in better agreement with observations. Intermediate and small objects, instead, do not have a quenching mechanism acting directly at their scales which can self-regulate the duration of the star formation. Therefore they end up having either too high or too low [/Fe] ratios.
In the remainder to this section we discuss the main ingredients that might be modified in order to improve the predicted []-mass relation.
6.1 AGN feedback
We start presenting the key factor that permitted substantial improvement. If we switch off the SMBH heating of the intra-halo gas, we predict that the more massive galaxies are younger than the less massive ones - with a typical age of 6 Gyr (at variance with the observational results) - and that they are strongly -depleted. As can be seen in fig. 13 (top panel), we basically confirm with a more self-consistent model the results that Thomas (1999) obtained: the natural prediction of a bottom-up hierarchical growth of the galaxies leads to a -mass relation which has a negative slope.
Therefore some kind of SF quenching is needed. The recipes commonly adopted in the literature (see Introduction) and in the present work assume that only the most massive galaxies are affected by SMBH feedback. This helps to predict higher [/Fe] ratios and relaxes, but does not solve yet, the problem at the high mass. As discussed above, however, little attention is paid to what becomes of the less massive objects which are the building blocks of the relation and responsible for the bulk of the scatter. Suppression of star formation at low and intermediate masses is required in the models. In fact, recent observations show that AGN feedback appears to be present also in this mass range of the early-type galaxy population (Schawinski et al 2007)
The bottom panel of fig. 13 show us that the predicted MMR slope is in better agreement with the data, although offset downwards in line with the above discussion (see Sec.5) and PM08’s analysis.
6.2 Stellar yields
A change in the stellar yields will introduce a systematic offset of a few tenths of a dex in the model predictions (see Thomas et al., 1999, PM04), hence it might let all the massive galaxies lie within the observational boundaries for a suitable choice of the stellar nucleosynthesis is done222For instance by: i) extending the upper mass limit of the IMF to 100 , ii) neglecting the ejecta of the stars in the mass range 8-11 (whose O/Fe is slightly sub-solar); iii) by setting the SNIa rate to the lowest value permitted by observations.. However, being only an offset, this change will not modify the slope of the predicted -mass relation and will exacerbate the problems for the low mass galaxies. But most importantly, the successful calibration of our model with element ratios observed in Milky Way stars does not allow significant modifications of the underlying stellar yields.
6.3 IMF
We do not test other IMFs, since a Salpeter IMF is a valid assumption for explaining most of the properties of early-type galaxies (see Renzini 2005). Furthermore, it has been already shown by Nagashima et al. (2005) that a change in the IMF is not enough (in the context of hierarchical mergers) in reproducing the correct -mass relation. We expect that a flattening of the IMF regardless of the galaxy mass leads to a overall shift towards higher values of the predicted [/Fe] ratio, but it does not affect the slope of the -mass relation unless one finds a good reason to make the IMF flatter as the galactic mass increase. We will investigate this possibility in future work. This solution appears contrived, however, because it implies that the single building block should know in advance its destiny in order to self-assign a suitable IMF.
6.4 Feedback from SNe and its efficiency
In Eq. (7) represents the efficiency of mass–loading during the triggering of a galactic wind by SNII explosions. Decreasing produces more feedback, heating more cold gas, ejecting more hot gas from halos, and thus reducing the amount of gas that can potentially form stars. In this case we find that the predicted stellar masses are smaller than the fiducial case. The galaxies look slightly more -enhanced as expected since the SF process is strongly-disfavored by the SNe explosions. However, this is not a viable solution for the -mass relation problem, since the high mass–loading also implies a very low metal content in the stars. The predicted MMR is offset downwards by at least 0.5 dex from the observational one. On the other hand, if we switch the SN feedback off, we tend to slightly worsen the -mass relation, whereas the agreement for the MMR improves.
Following the above line of thoughts, we further modify GalICS by introducing SNIa contribution into Eq. 7. Since elements and Fe are still ejected at the same rate, this change has the same effects of decreasing 333With the obvious difference that we can have ejection of matter also when the SF is zero, because of the nature of SNIa progenitors.. A 0.1 dex increase in the final ratios can be achieved when a differential wind is invoked, namely if we assume that twice more Fe than O can be ejected in the hot phase due to SNIa explosions. Again, given the nature of such a mechanism, neither the slope of the predicted -mass relation can be steepened nor its scatter reduced. Further investigation will tell us if a change in the SNe feedback, namely by allowing them to quench the star formation as in monolithic models (e.g. Pipino et al., 2008b), might be the required galactic-scale source of feedback.
6.5 Star formation efficiency
We identify the SF recipe as one of the prescriptions where one can improve upon. In fact, Pipino et al. (2008b) started from the heuristic approach of PM04, who required the SF efficiency to increase as a function of galactic mass, and showed that the -mass relation can be explained by implementing a physically motivated value for the SF efficiency. To explain the higher star formation efficiency in the most massive galaxies, they appeal to massive black holes-triggered SF: a short ( yr) super-Eddington phase can provide the accelerated triggering of associated star formation. The SMBH grows mostly in the initial super-Eddington phase while most of the spheroid stars grow during the succeeding Eddington phase, until the SN-driven wind quenches SF. According to Pipino et al. (2008b) models, the galaxy is fully assembled on a time-scale of 0.3-0.5 Gyr. This time-scale is long enough, however, to allow the SMBH to complete its growth in order to reproduce the Magorrian relation. The fact that GalICS already turns gas into stars at the maximum possible rate during the merger-induced star-burst phase and its quite low mass/space resolution hamper us from a direct implementation of the above recipe. Moreover, the fact that stars born the disc and can be transferred to the bulge of the same galaxy because of instabilities, is a possibility not taken into account in Silk (2005). This scenario will be tested in the forthcoming version of GalICS.
7 Conclusions
We implemented a detailed treatment for the chemical evolution of H, He, O and Fe in GalICS, a semi-analytical model for galaxy formation which successfully reproduces basic low- and high-redshift galaxy properties. The contribution of supernovae (both type Ia and II) as well as low- and intermediate-mass stars to chemical feedback are taken into account. The model predictions are compared to the most recent observational results by Thomas et al. (2008). We find that this chemically improved GalICS does not produce the observed mass- and -[/Fe] relations. The slope is too shallow and scatter too large, in particular in the low and intermediate mass range. The model shows significant improvement at the highest masses and velocity dispersions, where the predicted [/Fe] ratios are now marginally consistent with observed values. Moreover, an excess of low-mass ellipticals with too high a [/Fe] ratio is predicted. We show that this result comes from the implementation of AGN (plus halo) quenching of the star formation in massive haloes.
A thorough exploration of the parameter space shows that the failure of reproducing the mass- and -[/Fe] relations can partly be attributed to the way in which star formation and feedback are currently modelled. The merger process is responsible for a part of the scatter. We suggest that the next generation of semi-analytical model should feature feedback (either stellar of from AGN) mechanisms linked to single galaxies and not only to the halo, especially in the low and intermediate mass range.
Furthermore, a drawback of the is the fact that the MMR cannot be fit simultaneously. Both effects can be explained by the fact that the model is still lacking a sort of monolithic formation for all its spheroids, which is needed in order to reproduce the -mass relation and the MMR at the same time. The scatter is somehow intrinsic to the merger history, thus calling for further modification of the baryons behaviour with respect to the CDM. In other words we envisage a lack of a self-regulating mechanisms which acts on a galactic scale and counterbalances to some extent the random nature of the merger trees.
As expected from chemical evolution studies, is the shape of the SFH which sets the final [/Fe]: a galaxy with a shorter duration of the SFH (summed over all the progenitors) will have a higher [/Fe] than a galaxy with a longer one, even if the latter had less mergers. Moreover the [/Fe] achieved by the galaxies are in general 0.1-0.3 higher than what expected by feeding the integral SFH in a pure chemical evolution model. This happens because in GalICS galaxies do not evolve as closed boxes. They instead exchange metals with the surrounding hot halo, undergo dry-mergers, as well as stars can be created in discs and the moved to bulges because of mergers or instabilities.
In order to understand such a difference and to find viable solutions we tested the effect of several model parameters. Among those, we emphasise that an increase in the star formation efficiency and Fe-enhanced winds driven by the SNIa activity might play a role in removing galaxies with too a low [/Fe] ratio. However, given the way they act on the galaxy evolution, the cannot be effective in either making the slope of the predicted -mass relation steeper or in reducing its scatter. In particular, it seems hard to remove the low-mass galaxy too -enhanced.
Acknowledgments
AP acknowledges useful discussions with A. Cattaneo.
References
- Baugh et al. (1996) Baugh C. M., Cole S., Frenk C. S., 1996, MNRAS, 283, 1361
- (2) Baldry, I.K.; Glazebrook, K.; Brinkmann, J.; Ivezi, Z.; Lupton, R.H.; Nichol, R.C.; Szalay, A.S. 2004, ApJ, 600, 681
- (3) Bower, R.G., Lucey, J.R., Ellis, R.S. 1992, MNRAS, 254, 589
- (4) Bower, R. G.; Benson, A. J.; Malbon, R.; Helly, J. C.; Frenk, C. S.; Baugh, C. M.; Cole, S.; Lacey, C. G.2006, MNRAS, 370, 645
- (5) Bundy, Kevin; Ellis, Richard S.; Conselice, Christopher J. 2005, ApJ, 625, 621
- (6) Carollo, C.M., Danziger, I.J., Buson, L. 1993, MNRAS, 265, 553
- (7) Cattaneo, A.; Blaizot, J.; Devriendt, J.; Guiderdoni, B. 2005, MNRAS, 364, 407
- (8) Cattaneo, A.; Dekel, A.; Faber, S. M.; Guiderdoni, B.2008, MNRAS, 389, 567
- (9) Cimatti, A.; Daddi, E.; Renzini, A.2006, A&A, 453, 29
- Cole et al. (1994) Cole S., Aragon-Salamanca A., Frenk C., Navarro J., Zepf S., 1994, MNRAS, 271, 781
- (11) Cowie, L.L.; Songaila, A.; Hu, E.M.; Cohen, J.G. 1996 AJ, 112, 839
- (12) Croton, D.J.; Springel, V.; White, S.D.M.; De Lucia, G.; Frenk, C. S.; Gao, L.; Jenkins, A.; Kauffmann, G.; Navarro, J. F.; Yoshida, N. 2006, MNRAS, 365, 11
- (13) Davies, R.L., Sadler, E.M., Peletier, R.F., 1993, MNRAS, 262, 650
- Dekel & Silk (1986) Dekel A., Silk J., 1986, ApJ, 303, 39
- (15) De Lucia, G.; Springel, V.; White, S.D.M.; Croton, D.; Kauffmann, G. 2006 MNRAS, 366, 499
- (16) Fontanot, F., Monaco, P., Silva, L., Grazian, A., 2007, MNRAS, 382, 903
- (17) François, P., Matteucci, F., Cayrel, R., Spite, M., Spite, F., & Chiappini, C. 2004, A&A, 421, 613
- Ferrarese & Merritt (2000) Ferrarese L., Merritt D., 2000, ApJ, 539, L9
- Granato et al. (2004) Granato G. L., De Zotti G., Silva L., Bressan A., Danese L., 2004, ApJ, 600, 580
- (20) Greggio, L. 2005, A&A, 441, 1055
- Guiderdoni et al. (1998) Guiderdoni B., Hivon E., Bouchet F. R., Maffei B., 1998, MNRAS, 295, 877
- (22) Hasinger, G.; Miyaji, T.; Schmidt, M. 2005 A&A, 441, 417
- Hatton et al. (2003) Hatton S., Devriendt J. E. G., Ninin S., Bouchet F. R., Guiderdoni B., Vibert D., 2003, MNRAS, 343, 75 (Paper I)
- Hernquist (1990) Hernquist L., 1990, ApJ, 356, 359
- (25) Iwamoto, K.; Brachwitz, F.; Nomoto, K.; Kishimoto, N.; Umeda, H.; Hix, W. R.; Thielemann, F.K. 1999, ApJS, 125, 439
- (26) Kauffmann, G., 1996, MNRAS, 281, 487
- (27) Kauffmann, G., White, S.D.M. 1993, MNRAS, 261, 921
- (28) Kaviraj, S.; et al. 2007, ApJS, 173, 619
- (29) Kaviraj, S.; Devriendt, J. E. G.; Ferreras, I.; Yi, S. K. 2005, MNRAS, 360, 60
- (30) Keres, D.; Katz, N.; Weinberg, D.H.; Dave’, R. 2005, MNRAS, 363, 2
- (31) Kimm, T, et al., 2008, arXiv0810.2794
- (32) Mannucci, F., Maoz, D.; Sharon, K.; Botticella, M. T.; Della Valle, M.; Gal-Yam, A.; Panagia, N. 2007, MNRAS, tmp, 1132
- (33) Matteucci, F. 1994, AA, 288, 57
- (34) Matteucci, F., Greggio, L. 1986, AA, 154, 279
- (35) Matteucci, F.; Panagia, N.; Pipino, A.; Mannucci, F.; Recchi, S.; Della Valle, M. 2006, MNRAS, 372, 265
- (36) Matteucci, F.,Recchi, S., 2001, ApJ, 558, 351
- (37) Mehlert, D.; Thomas, D.; Saglia, R. P.; Bender, R.; Wegner, G. 2003, A&A, 407, 423
- (38) Nagashima, Masahiro; Lacey, Cedric G.; Okamoto, Takashi; Baugh, Carlton M.; Frenk, Carlos S.; Cole, Shaun 2005, MNRAS, 363L, 31
- (39) Nesvadba, N.P. H.; Lehnert, M. D.; Eisenhauer, F.; Gilbert, A.; Tecza, M.; Abuter, R., 2006, Apj, 650, 693
- (40) Nelan, J.E.; Smith, R.J.; Hudson, M.J.; Wegner, G.A.; Lucey, J.R.; Moore, S.A.W.; Quinney, S.J.; Suntzeff, N.B. 2005, ApJ, 632, 137
- Peebles (1982) Peebles P., 1982, ApJ, 263, L1
- (42) Pipino, A., D’Ercole, A., Matteucci, F, 2008a, A&A, 484, 679
- (43) Pipino, A., Matteucci, F. 2004, MNRAS, 347, 968 (PM04)
- (44) Pipino, A., Matteucci, F. 2006, MNRAS, 365, 1114 (PM06)
- (45) Pipino, A., Matteucci, F, 2008, A&A, 486, 763 (PM08)
- (46) Pipino, A.; Matteucci, F.; Chiappini, C. 2006 ApJ, 638, 739
- (47) Pipino, A., Silk, J., Matteucci, F, 2008b, MNRAS in press, arXiv0810.2045
- (48) Renzini, A., 2005, ASSL, 327, 221
- (49) Salpeter, E.E., 1955, ApJ, 121, 161
- (50) Schawinski, K.; Thomas, D.; Sarzi, M.; Maraston, C.; Kaviraj, S.; Joo, S-J; Yi, S K.; Silk, J.2007, MNRAS, 382, 1415 Giavalisco, M., Pettini, M., 2001, ApJ, 562, 95
- Silk (2001) Silk J., 2001, MNRAS, 324, 313
- (52) Silk J. 2005, MNRAS, 364, 1337
- (53) Somerville, R.S.; Hopkins, P.F.; Cox, T.J.; Robertson, B.E.; Hernquist, L., 2008, arXiv0808.1227
- (54) Springel, V., Frenk, C.S.; White, S.D.M., 2006, Nature, 440, 1137
- (55) Thomas, D., 1999, MNRAS, 306, 655
- (56) Thomas, D.; Maraston, C.; Bender, R.; Mendes de Oliveira, C. 2005, ApJ, 621, 673
- (57) Trager, S.C., Faber, S.M., Worthey, G., Gonzalez, J.J., 2000, AJ, 119, 1654
- van den Bosch (1998) van den Bosch F. C., 1998, ApJ, 507, 601
- (59) Worthey, G., Faber, S.M., Gonzalez, J.J. 1992, ApJ, 398, 69
- (60) Ziegler, B.L., Thomas, D., Bohm, A., Bender, R., Fritz, A., Maraston, C. 2005, A&A, 433, 519